Cited by 125

The DOI matches its Crossref record.

Adipose-Derived Mesenchymal Stem Cell Exosomes Suppress Hepatocellular Carcinoma Growth in a Rat Model: Apparent Diffusion Coefficient, Natural Killer T-Cell Responses, and Histopathological Features

Ko, Sheung-Fat, Yip, Hon-Kan, Zhen, Yen-Yi, Lee, Chen-Chang, Lee, Chia-Chang, Huang, Chung-Cheng, Ng, Shu-Hang, Lin, Jui-Wei·2015·Stem Cells International

Abstract

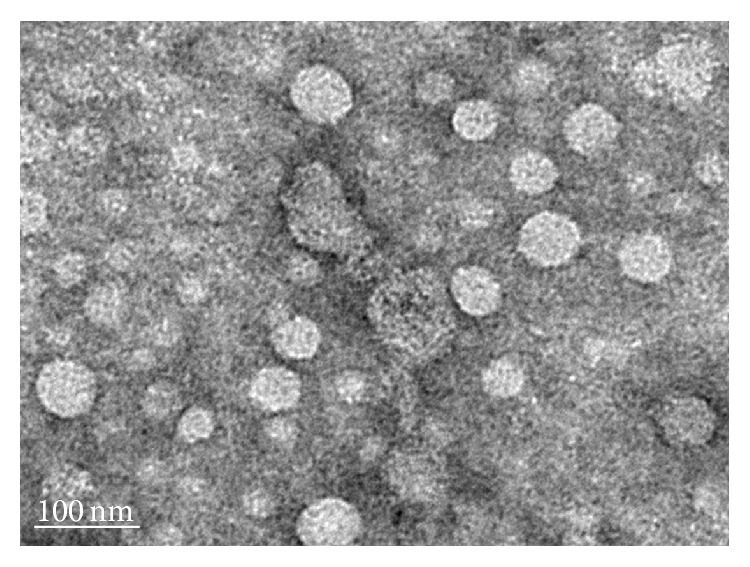
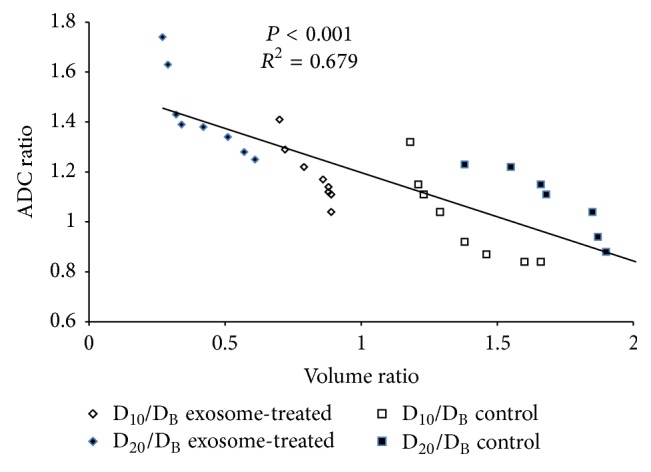
We sought to evaluate the effects of adipose-derived mesenchymal stem cells (ADMSCs) exosomes on hepatocellular carcinoma (HCC) in rats using apparent diffusion coefficient (ADC), natural killer T-cell (NKT-cell) responses, and histopathological features. ADMSC-derived exosomes appeared as nanoparticles (30–90 nm) on electron microscopy and were positive for CD63, tumor susceptibility gene-101, and β -catenin on western blotting. The control ( n = 8 ) and exosome-treated ( n = 8 ) rats with N1S1-induced HCC underwent baseline and posttreatment day 10 and day 20 magnetic resonance imaging and measurement of ADC. Magnetic resonance imaging showed rapidly enlarged HCCs with low ADCs in the controls. The exosome-treated rats showed partial but nonsignificant tumor reduction, and significant ADC and ADC ratio increases on day 10. On day 20, the exosome-treated rats harbored significantly smaller tumors and volume ratios, higher ADC and ADC ratios, more circulating and intratumoral NKT-cells, and low-grade HCC ( P < 0.05 for all comparisons) compared to the controls. The ADC and volume ratios exhibited significant inverse correlations ( P < 0.001 , R 2 = 0.679 ). ADMSC-derived exosomes promoted NKT-cell antitumor responses in rats, thereby facilitating HCC suppression, early ADC increase, and low-grade tumor differentiation. ADC may be an early biomarker of treatment response.

Overview

The claims and statistics of this paper haven’t been checked yet.

Run the check — free, no account needed. It reads the open-access text and checks the sources it cites.

A few free checks a day · papers already verified open instantly · results are public

Integrity signals

Registry

Crossref · 10.1155/2015/853506

Cites

Statistics

Figures

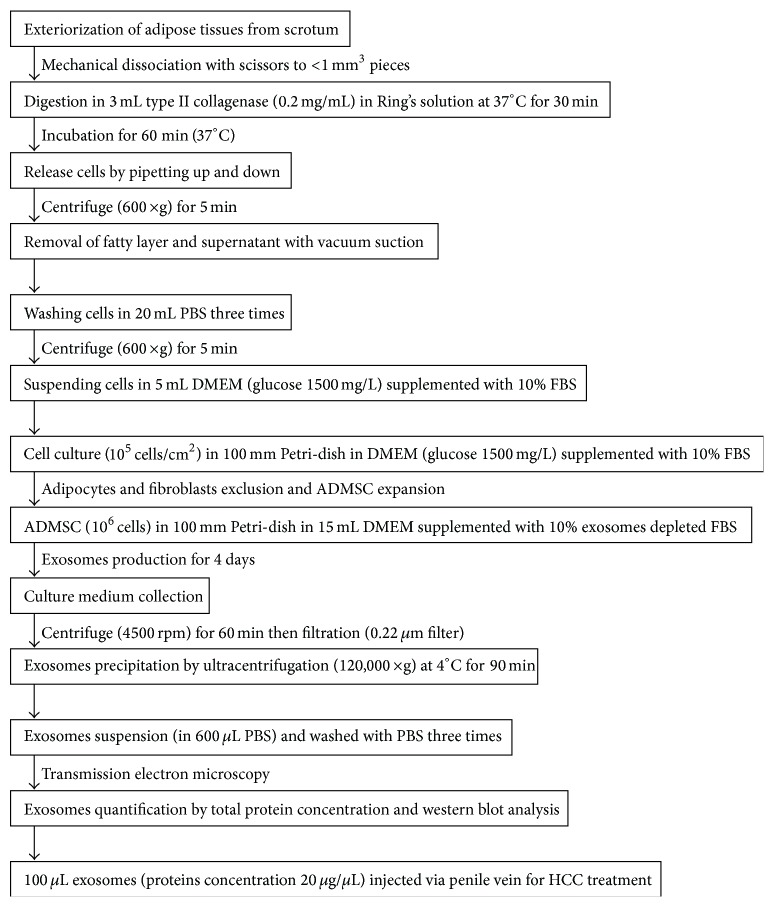
Figure 1 The flowchart shows the preparation and cultures of adipose-derived mesenchymal stem cells (ADMSCs), isolation of exosomes from culture medium, protein quantification and characterization of exosomes, and the final injection of exosomes via the penile vein for HCC treatment (min: minutes, g: gravity, PBS: phosphate buffered saline, DMEM: Dulbecco's modified Eagle's medium, FBS: fetal bovine serum, rpm: rotation per min).
Figure 1 The flowchart shows the preparation and cultures of adipose-derived mesenchymal stem cells (ADMSCs), isolation of exosomes from culture medium, protein quantification and characterization of exosomes, and the final injection of exosomes via the penile vein for HCC treatment (min: minutes, g: gravity, PBS: phosphate buffered saline, DMEM: Dulbecco's modified Eagle's medium, FBS: fetal bovine serum, rpm: rotation per min).CC BY · PubMed Central
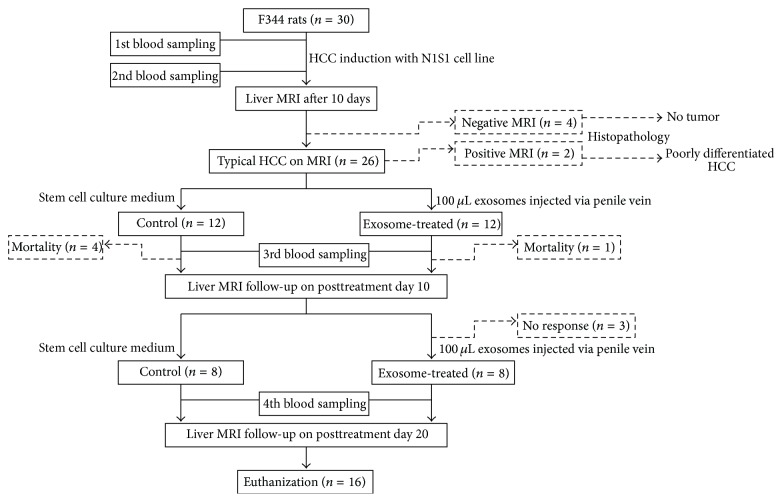
Figure 2 The flowchart shows the timetable for blood sampling (before and 10 days after HCC induction, posttreatment day 5 and day 15), exosome treatment (after baseline and posttreatment day 10 MR), liver MR and DW imaging (baseline, posttreatment day 10 and day 20), and final killing. Please note that two rats with typical HCC features and four rats with no HCC revealed on baseline MR imaging were killed for histopathological confirmation of MR findings.
Figure 2 The flowchart shows the timetable for blood sampling (before and 10 days after HCC induction, posttreatment day 5 and day 15), exosome treatment (after baseline and posttreatment day 10 MR), liver MR and DW imaging (baseline, posttreatment day 10 and day 20), and final killing. Please note that two rats with typical HCC features and four rats with no HCC revealed on baseline MR imaging were killed for histopathological confirmation of MR findings.CC BY · PubMed Central
Figure 3 Transmission electron microscopic evaluation shows small vesicles within the expected range of exosomes (30–90 nm) in the sample isolated from the ADMSCs culture medium by ultracentrifugation.
Figure 3 Transmission electron microscopic evaluation shows small vesicles within the expected range of exosomes (30–90 nm) in the sample isolated from the ADMSCs culture medium by ultracentrifugation.CC BY · PubMed Central
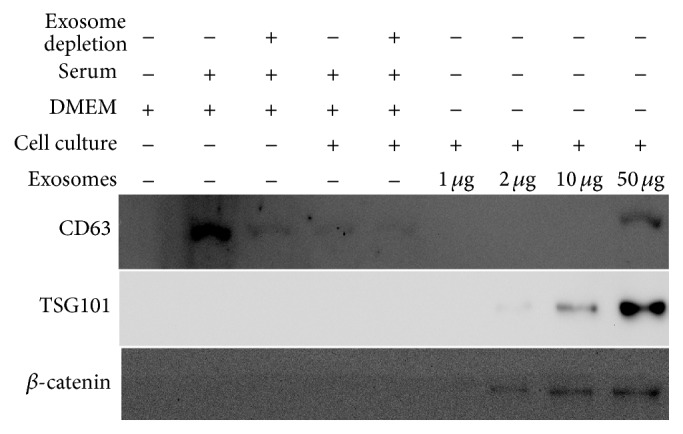
Figure 4 Western blot analysis of the culture medium, conditioned medium, and exosomes probed with antibodies against CD63, tumor susceptibility gene-101 (TSG-101), and β-catenin. Please note that CD63 is present in the culture medium, conditioned medium, and exosomes. TSG101 and β-catenin are absent in DMEM (Dulbecco's modified Eagle medium) without or with 10% serum but are present in the exosome fractions (1 μg, 2 μg, 10 μg, and 50 μg), particularly the 50 μg sample.
Figure 4 Western blot analysis of the culture medium, conditioned medium, and exosomes probed with antibodies against CD63, tumor susceptibility gene-101 (TSG-101), and β-catenin. Please note that CD63 is present in the culture medium, conditioned medium, and exosomes. TSG101 and β-catenin are absent in DMEM (Dulbecco's modified Eagle medium) without or with 10% serum but are present in the exosome fractions (1 μg, 2 μg, 10 μg, and 50 μg), particularly the 50 μg sample.CC BY · PubMed Central
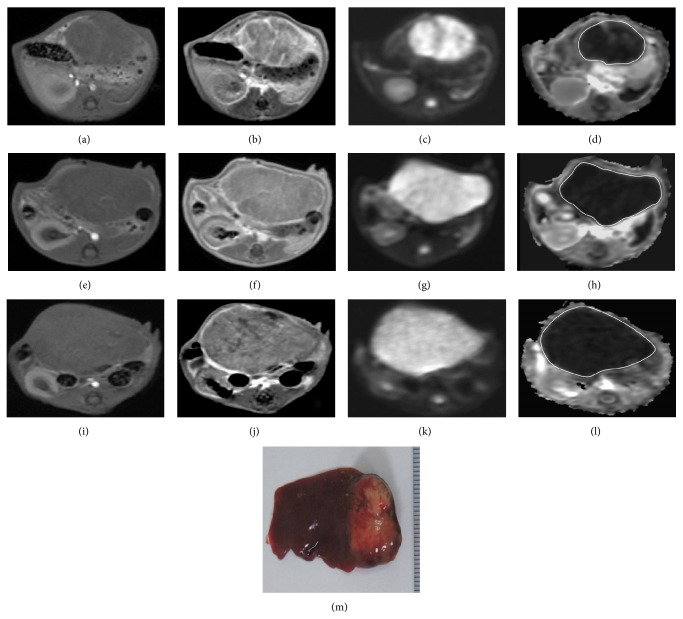
Figure 5 T1-weighted ((a), (e), and (i)), enhanced T1-weighted ((b), (f), and (j)), DW image (b value = 800 sec/mm2) ((c), (g), and (k)), and ADC map ((d), (h), and (l)) of HCC at the level of greatest tumor diameter on baseline (a, b, c, d), posttreatment day 10 ((e), (f), (g), and (h)), and posttreatment day 20 ((i), (j), (k), and (l)). MR imaging of a control rat shows heterogeneously enhanced tumor with marked enlargement (whole-tumor volume ratios: D10/baseline = 1.38, D20/baseline = 1.85) whilst the ADC value (whole-tumor ADC ratios: D10/baseline = 0.92, D20/baseline = 1.04) remains low. Gross specimen (M) of the resected liver shows a large tumor in the left lobe with good correlation to MR imaging on posttreatment day 20.
Figure 5 T1-weighted ((a), (e), and (i)), enhanced T1-weighted ((b), (f), and (j)), DW image (b value = 800 sec/mm2) ((c), (g), and (k)), and ADC map ((d), (h), and (l)) of HCC at the level of greatest tumor diameter on baseline (a, b, c, d), posttreatment day 10 ((e), (f), (g), and (h)), and posttreatment day 20 ((i), (j), (k), and (l)). MR imaging of a control rat shows heterogeneously enhanced tumor with marked enlargement (whole-tumor volume ratios: D10/baseline = 1.38, D20/baseline = 1.85) whilst the ADC value (whole-tumor ADC ratios: D10/baseline = 0.92, D20/baseline = 1.04) remains low. Gross specimen (M) of the resected liver shows a large tumor in the left lobe with good correlation to MR imaging on posttreatment day 20.CC BY · PubMed Central
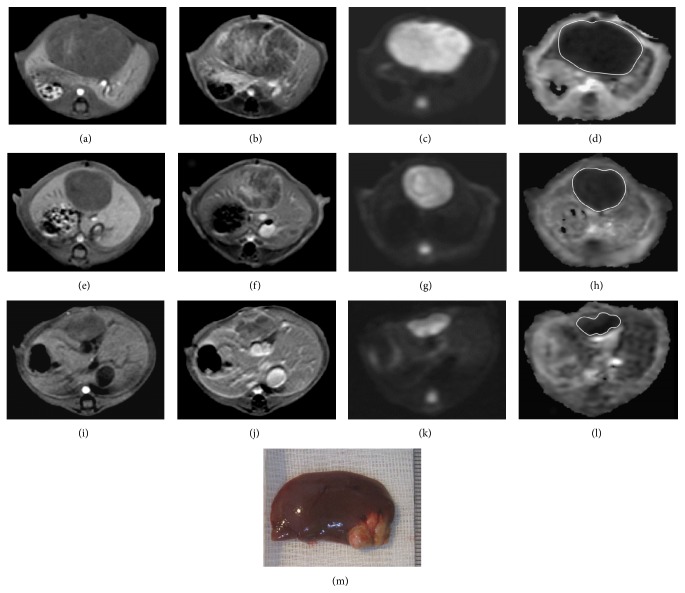
Figure 6 T1-weighted ((a), (e), and (i)), enhanced T1-weighted ((b), (f), and (j)), DW image (b value = 800 sec/mm2) ((c), (g), and (k)), and ADC map ((d), (h), and (l)) of HCC at the level of greatest tumor diameter on baseline ((a), (b), (c), and (d)), posttreatment day 10 ((e), (f), (g), and (h)), and posttreatment day 20 ((i), (j), (k), and (l)). MR imaging of an exosome-treated rat shows partial but nonsignificant tumor reduction and significantly increased ADC ratio on posttreatment day 10 (D10/baseline whole-tumor volume ratio = 0.72 and ADC ratio = 1.29). On posttreatment day 20, the exosome-treated rat harbored significantly smaller tumor and higher ADC ratio (D20/baseline whole-tumor volume ratio = 0.29 and ADC ratio = 1.63). Gross specimen (M) of the resected liver shows a small lobulated tumor in the left lobe with good correlation to MR imaging on posttreatment day 20.
Figure 6 T1-weighted ((a), (e), and (i)), enhanced T1-weighted ((b), (f), and (j)), DW image (b value = 800 sec/mm2) ((c), (g), and (k)), and ADC map ((d), (h), and (l)) of HCC at the level of greatest tumor diameter on baseline ((a), (b), (c), and (d)), posttreatment day 10 ((e), (f), (g), and (h)), and posttreatment day 20 ((i), (j), (k), and (l)). MR imaging of an exosome-treated rat shows partial but nonsignificant tumor reduction and significantly increased ADC ratio on posttreatment day 10 (D10/baseline whole-tumor volume ratio = 0.72 and ADC ratio = 1.29). On posttreatment day 20, the exosome-treated rat harbored significantly smaller tumor and higher ADC ratio (D20/baseline whole-tumor volume ratio = 0.29 and ADC ratio = 1.63). Gross specimen (M) of the resected liver shows a small lobulated tumor in the left lobe with good correlation to MR imaging on posttreatment day 20.CC BY · PubMed Central
Figure 7 The graph shows the relationship between the whole-tumor volume ratio and ADC ratio, indicating a strong correlation (P < 0.001, R 2 = 0.679; simple linear regression analysis).
Figure 7 The graph shows the relationship between the whole-tumor volume ratio and ADC ratio, indicating a strong correlation (P < 0.001, R 2 = 0.679; simple linear regression analysis).CC BY · PubMed Central
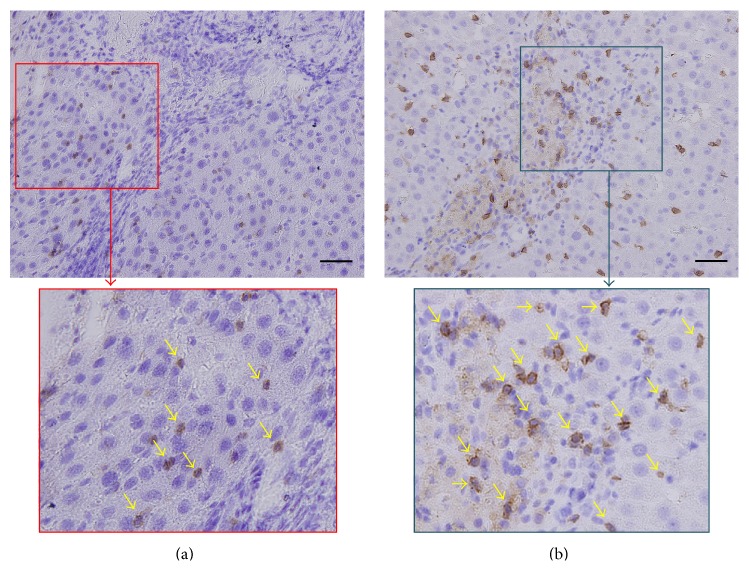
Figure 8 Immunohistochemical staining (200x) with CD8α in the rat in the control group (a) and the rat in the exosome-treated group (b) with focal magnification view shows significantly higher number of intratumoral CD8α+ NKT-cells (arrows) in the exosome-treated rat than in the control. Scale bar = 50 μm.
Figure 8 Immunohistochemical staining (200x) with CD8α in the rat in the control group (a) and the rat in the exosome-treated group (b) with focal magnification view shows significantly higher number of intratumoral CD8α+ NKT-cells (arrows) in the exosome-treated rat than in the control. Scale bar = 50 μm.CC BY · PubMed Central

Verification

Claims the paper makes

The claims and statistics of this paper haven’t been checked yet.

Run the check — free, no account needed. It reads the open-access text and checks the sources it cites.

A few free checks a day · papers already verified open instantly · results are public

Claims other papers make about this one

Each is checked against this paper’s own text: does it say what the citing paper says it does?

Self-check

Percentages, sums and reported differences re-computed from the paper’s own numbers.

The self-check needs the paper’s full text.

Citations

Cites

No references could be resolved yet.

Research works printed but not linked: 34

  1. 10.1016/S0140-6736(11)61347-0 · DOI
  2. 10.1097/sla.0b013e3181efc656 · DOI
  3. 10.1016/s1470-2045(11)70175-9 · DOI
  4. 10.1111/j.1478-3231.2010.02221.x · DOI
  5. 10.1053/j.gastro.2009.09.006 · DOI
  6. 10.1016/S1470-2045(08)70285-7 · DOI · Paper page
  7. 10.3109/10520291003659042 · DOI
  8. 10.1016/j.bcp.2011.02.011 · DOI
  9. 10.1002/hep.21060 · DOI · Paper page
  10. 10.1002/hep.22034 · DOI · Paper page
  11. 10.1038/cr.2008.40 · DOI
  12. 10.1186/2047-783x-18-34 · DOI
  13. 10.1016/j.jhep.2011.03.007 · DOI
  14. 10.1148/radiol.11110282 · DOI
  15. 10.1148/radiol.09090021 · DOI
  16. 10.1016/j.ejrad.2010.12.081 · DOI
  17. 10.1148/radiol.13130591 · DOI
  18. 10.3348/kjr.2010.11.3.295 · DOI
  19. 10.1002/jmri.21931 · DOI
  20. 10.1186/1479-5876-9-51 · DOI
  21. 10.1002/1097-0142(195405)7:360;462::aid-cncr282007030862;3.0.co;2-e · DOI
  22. 10.1136/gut.2003.026047 · DOI
  23. 10.1016/j.dld.2013.10.008 · DOI
  24. 10.3978/j.issn.2304-3881.2014.06.02 · DOI
  25. 10.2174/157488810791268636 · DOI
  26. 10.1038/nrm973 · DOI · Paper page
  27. 10.1186/1471-230x-10-83 · DOI
  28. 10.1148/radiol.14132361 · DOI
  29. 10.1016/j.jvir.2011.08.030 · DOI
  30. 10.1158/1078-0432.ccr-10-0356 · DOI
  31. 10.1016/s0065-230x(08)00408-9 · DOI
  32. 10.1002/ijc.11201 · DOI
  33. 10.1371/journal.pone.0028648 · DOI
  34. 10.1371/journal.pone.0070345 · DOI

Cited by

Sorted by citations

Metadata

Authors
Ko, S.-F., Yip, H.-K., Zhen, Y.-Y., Lee, C.-C., Lee, C.-C., Huang, C.-C., Ng, S.-H., & Lin, J.-W.
Venue
Stem Cells International
Publisher
Wiley
Published
2015
Volume
2015
Pages
1-11
ISSN
  • 1687-966X
  • 1687-9678
Cited by
125
References
0
Language
en
Funders
Ministry of Science and Technology, Taiwan (MOST-101-2314-B-182A-122-MY2)

About these checks

Registry, retraction, Cites and statistics results are computed, not judged, with one exception: a printed reference that no index lists is read once by a model before it counts as a citation error. Claims are extracted by a model and kept only when their quote appears verbatim in the text; each cited source is then checked, with a model’s help, for whether it says what the claim relies on. Those verdicts can be wrong — read the claim’s quote and the cited source before relying on one.

Statistics and arithmetic are recomputed, not judged.

Confidence bands are shown only for fields calibrated on our annotated test set. None is calibrated yet, so no band is shown.

What counts as a claim ›How we measure confidence ›How we check this ›

Are you an author, or do you see a problem with this page? Request a review