

The DOI matches its Crossref record; 56 of the 56 references it cites were found in a registry or an index.
Modeling Clinical Responses to Targeted Therapies by Patient-Derived Organoids of Advanced Lung Adenocarcinoma
Open accessPublished version of a preprint
Abstract
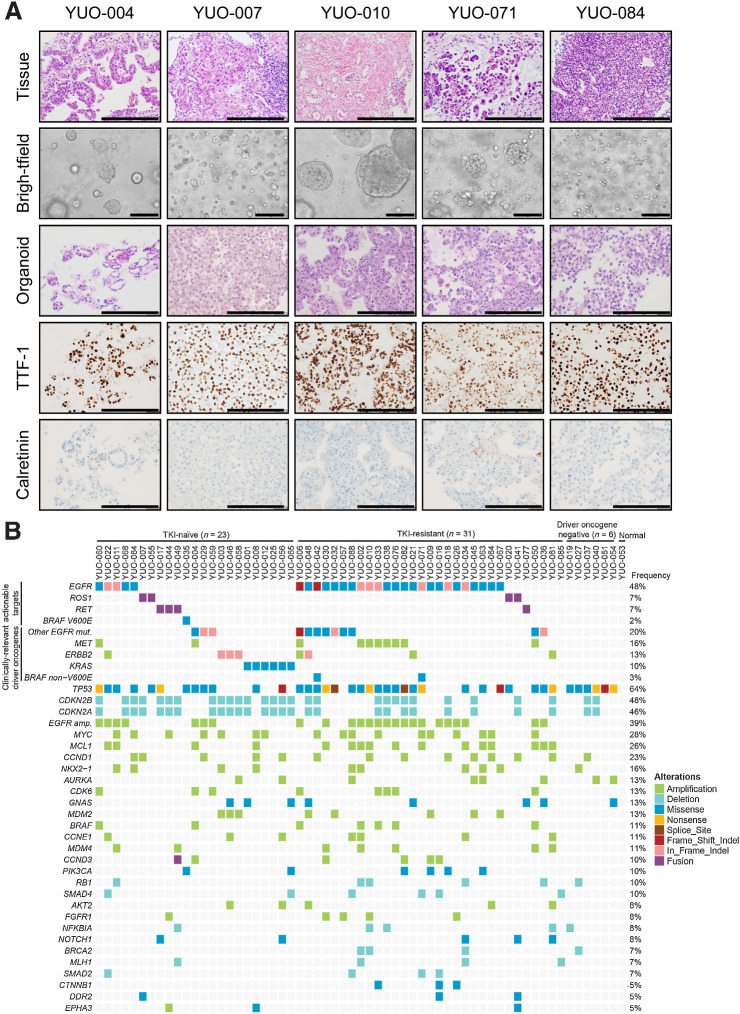
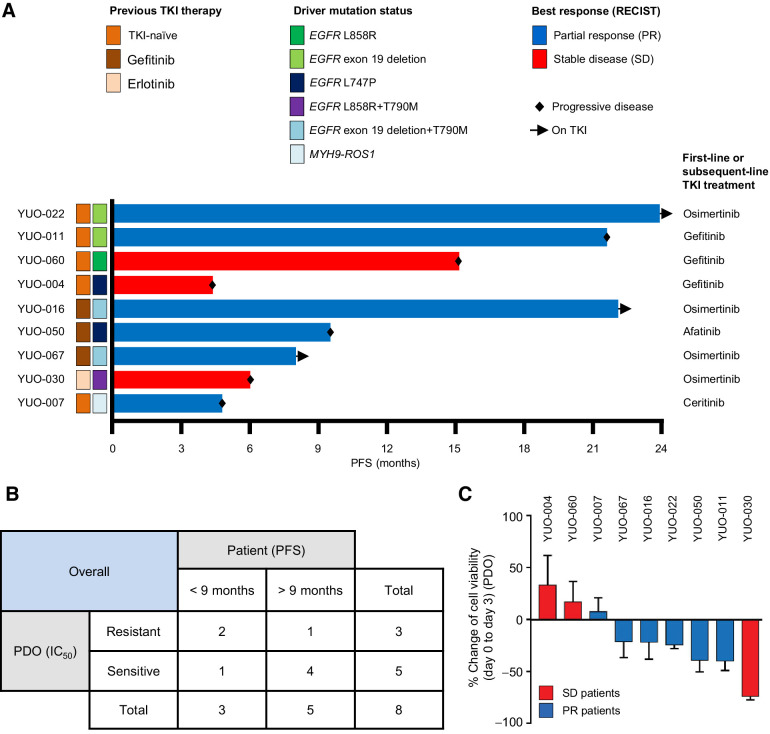
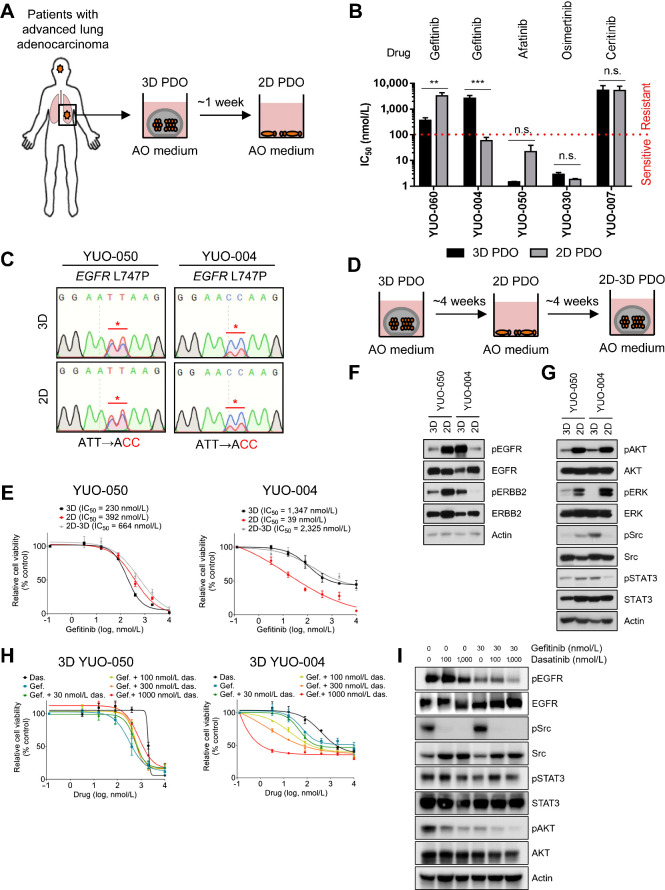
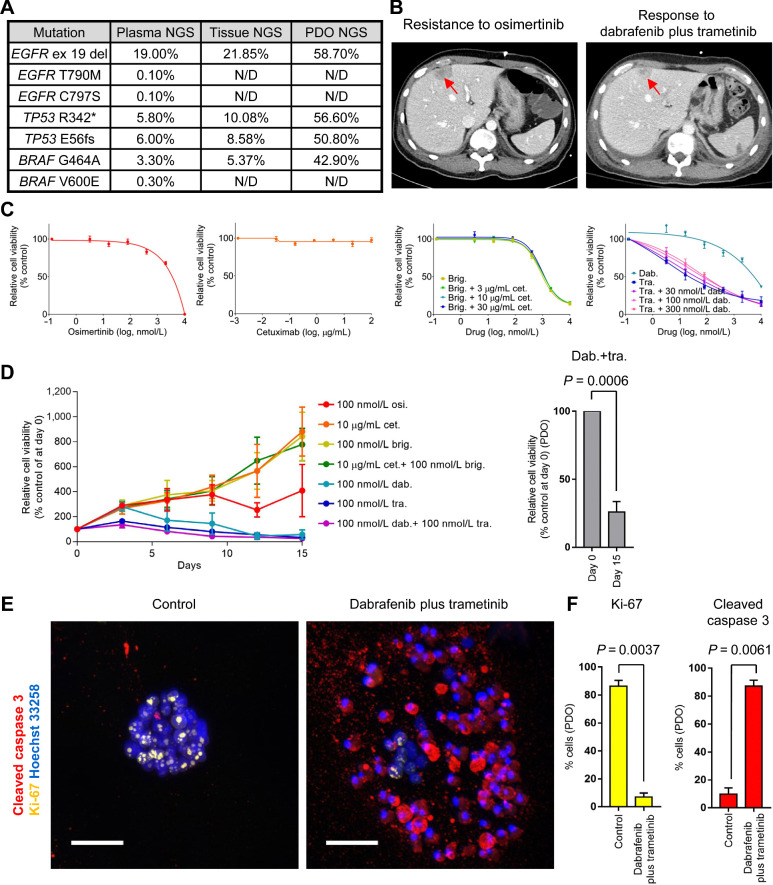
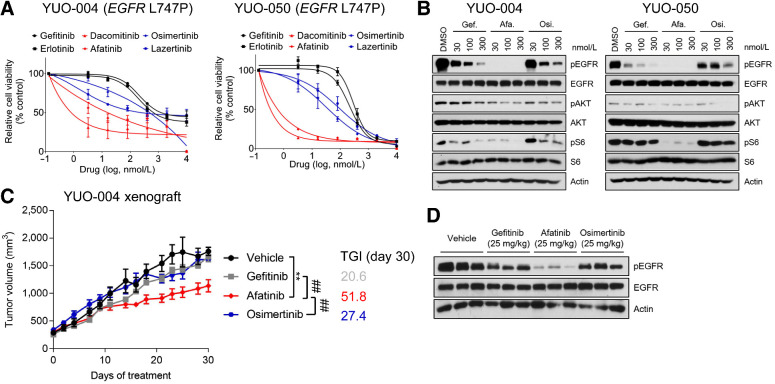
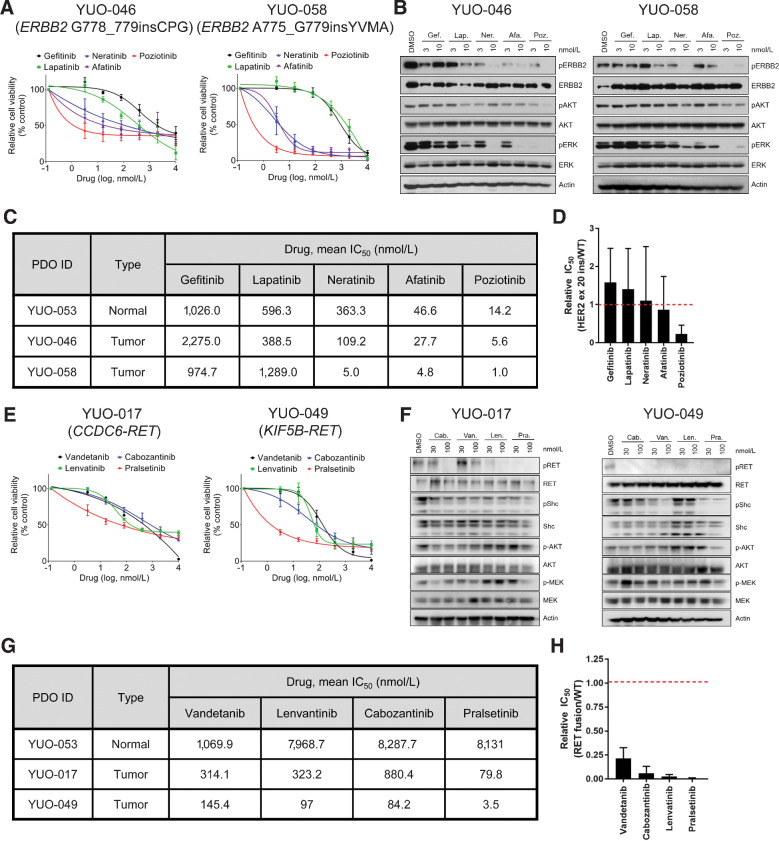
Purpose: Patient-derived organoids (PDO) of lung cancer has been recently introduced, reflecting the genomic landscape of lung cancer. However, clinical relevance of advanced lung adenocarcinoma organoids remains unknown. Here, we examined the ability of PDOs to predict clinical responses to targeted therapies in individual patients and to identify effective anticancer therapies for novel molecular targets. Experimental Design: Eighty-four organoids were established from patients with advanced lung adenocarcinoma. Formalin-fixed, paraffin-embedded tumor specimens from corresponding patients were analyzed by whole-exome sequencing (n = 12). Organoids were analyzed by whole-exome sequencing (n = 61) and RNA sequencing (n = 55). Responses to mono or combination targeted therapies were examined in organoids and organoid-derived xenografts. Results: PDOs largely retained somatic alterations including driver mutations of matching patient tumors. PDOs were able to recapitulate progression-free survival and objective responses of patients with non–small cell lung cancer receiving clinically approved tyrosine kinase inhibitors. PDOs recapitulated activity of therapeutic strategies under clinical investigation. YUO-071 harboring an EGFR exon 19 deletion and a BRAF G464A mutation and the matching patient responded to dabrafenib/trametinib combination therapy. YUO-004 and YUO-050 harboring an EGFR L747P mutation was sensitive to afatinib, consistent with the response in the matching patient of YUO-050. Furthermore, we utilized organoids to identify effective therapies for novel molecular targets by demonstrating the efficacy of poziotinib against ERBB2 exon 20 insertions and pralsetinib against RET fusions. Conclusions: We demonstrated translational relevance of PDOs in advanced lung adenocarcinoma. PDOs are an important diagnostic tool, which can assist clinical decision making and accelerate development of therapeutic strategies.
Overview
The claims and statistics of this paper haven’t been checked yet.
Run the check — free, no account needed. It reads the open-access text and checks the sources it cites.
Integrity signals
Registry
Cites
Statistics
Figures
Verification
Claims the paper makes
The claims and statistics of this paper haven’t been checked yet.
Run the check — free, no account needed. It reads the open-access text and checks the sources it cites.
Claims other papers make about this one
Each is checked against this paper’s own text: does it say what the citing paper says it does?
The cited source says what the claim attributes to it.
In the citing paper
“PDO have become an effective clinical-related model for predicting the drug responses, and they retain the morphological and characteristics of human primary tumors (38–40).”
From Small-molecule PROTAC mediates targeted protein degradation to treat STAT3-dependent epithelial cancer (2022) · cites this paper as [40]
Self-check
Percentages, sums and reported differences re-computed from the paper’s own numbers.
The self-check needs the paper’s full text.
Citations
Cites
Fast and accurate short read alignment with Burrows-Wheeler transform
Li, H., & Durbin, R. (2009) · Bioinformatics · doi:10.1093/bioinformatics/btp324 · Cited by 58,607
Fast and accurate long-read alignment with Burrows-Wheeler transform.
Li, H., & Durbin, R. (2010) · Bioinformatics · doi:10.1093/bioinformatics/btp698 · Cited by 12,063
Gefitinib or Carboplatin–Paclitaxel in Pulmonary Adenocarcinoma
Mok, T. S., Wu, Y.-L., Thongprasert, S., Yang, C.-H., Chu, D.-T., Saijo, N., Sunpaweravong, P., Han, B., Margono, B., Ichinose, Y., et al. (2009) · New England Journal of Medicine · doi:10.1056/nejmoa0810699 · Cited by 8,261
In situ click chemistry generation of cyclooxygenase-2 inhibitors
Bhardwaj, A., Kaur, J., Wuest, M., & Wuest, F. (2017) · Nature Communications · doi:10.1038/s41467-016-0009-6 · Cited by 7,448
Modeling Development and Disease with Organoids
Clevers, H. (2016) · Cell · doi:10.1016/j.cell.2016.05.082 · Cited by 3,196
A Chromatin-Mediated Reversible Drug-Tolerant State in Cancer Cell Subpopulations
Sharma, S. V., Lee, D. Y., Li, B., Quinlan, M. P., Takahashi, F., Maheswaran, S., McDermott, U., Azizian, N., Zou, L., Fischbach, M. A., et al. (2010) · Cell · doi:10.1016/j.cell.2010.02.027 · Cited by 2,770
AZD9291 in EGFR Inhibitor–Resistant Non–Small-Cell Lung Cancer
Jänne, P. A., Yang, J. C.-H., Kim, D.-W., Planchard, D., Ohe, Y., Ramalingam, S. S., Ahn, M.-J., Kim, S.-W., Su, W.-C., Horn, L., et al. (2015) · New England Journal of Medicine · doi:10.1056/nejmoa1411817 · Cited by 2,116
Self-citationCNVkit: Genome-Wide Copy Number Detection and Visualization from Targeted DNA Sequencing
Talevich, E., Shain, A. H., Botton, T., & Bastian, B. C. (2016) · PLoS Computational Biology · doi:10.1371/journal.pcbi.1004873 · Cited by 2,098
Patient-derived organoids model treatment response of metastatic gastrointestinal cancers
Vlachogiannis, G., Hedayat, S., Vatsiou, A., Jamin, Y., Fernández-Mateos, J., Khan, K., Lampis, A., Eason, K., Huntingford, I., Burke, R., et al. (2018) · Science · doi:10.1126/science.aao2774 · Cited by 2,096
Feiner, N., Motone, F., Meyer, A., & Kuraku, S. (2019) · Scientific Reports · doi:10.1038/s41598-019-40055-1 · Cited by 1,988
Resistance mechanisms to osimertinib in EGFR-mutated non-small cell lung cancer
Leonetti, A., Sharma, S., Minari, R., Perego, P., Giovannetti, E., & Tiseo, M. (2019) · British Journal of Cancer · doi:10.1038/s41416-019-0573-8 · Cited by 1,448
Planchard, D., Smit, E. F., Groen, H. J. M., Mazières, J., Besse, B., Helland, Å., Giannone, V., D'amelio, A. M., Zhang, P., Mookerjee, B., et al. (2017) · The Lancet Oncology · doi:10.1016/s1470-2045(17)30679-4 · Cited by 1,373
Organoid Profiling Identifies Common Responders to Chemotherapy in Pancreatic Cancer
Tiriac, H., Belleau, P., Engle, D. D., Plenker, D., Deschênes, A., Somerville, T. D. D., Froeling, F. E. M., Burkhart, R. A., Denroche, R. E., Jang, G.-H., et al. (2018) · Cancer Discovery · doi:10.1158/2159-8290.cd-18-0349 · Cited by 1,092
Long‐term expanding human airway organoids for disease modeling
Sachs, N., Papaspyropoulos, A., Zomer‐van Ommen, D. D., Heo, I., Böttinger, L., Klay, D., Weeber, F., Huelsz‐Prince, G., Iakobachvili, N., Amatngalim, G. D., et al. (2019) · The EMBO Journal · doi:10.15252/embj.2018100300 · Cited by 1,082
Planchard, D., Besse, B., Groen, H. J. M., Souquet, P.-J., Quoix, E., Baik, C. S., Barlesi, F., Kim, T. M., Mazieres, J., Novello, S., et al. (2016) · The Lancet Oncology · doi:10.1016/s1470-2045(16)30146-2 · Cited by 888
Ooft, S. N., Weeber, F., Dijkstra, K. K., McLean, C. M., Kaing, S., van Werkhoven, E., Schipper, L., Hoes, L., Vis, D. J., van de Haar, J., et al. (2019) · Science Translational Medicine · doi:10.1126/scitranslmed.aay2574 · Cited by 813
Patient-derived lung cancer organoids as in vitro cancer models for therapeutic screening
Kim, M., Mun, H., Sung, C. O., Cho, E. J., Jeon, H.-J., Chun, S.-M., Jung, D. J., Shin, T. H., Jeong, G. S., Kim, D. K., et al. (2019) · Nature Communications · doi:10.1038/s41467-019-11867-6 · Cited by 812
HER kinase inhibition in patients with HER2- and HER3-mutant cancers
Hyman, D. M., Piha-Paul, S. A., Won, H., Rodon, J., Saura, C., Shapiro, G. I., Juric, D., Quinn, D. I., Moreno, V., Doger, B., et al. (2018) · Nature · doi:10.1038/nature25475 · Cited by 780
Patient-Derived Organoids Predict Chemoradiation Responses of Locally Advanced Rectal Cancer
Yao, Y., Xu, X., Yang, L., Zhu, J., Wan, J., Shen, L., Xia, F., Fu, G., Deng, Y., Pan, M., et al. (2020) · Cell Stem Cell · doi:10.1016/j.stem.2019.10.010 · Cited by 755
Patient-derived models of acquired resistance can identify effective drug combinations for cancer
Crystal, A. S., Shaw, A. T., Sequist, L. V., Friboulet, L., Niederst, M. J., Lockerman, E. L., Frias, R. L., Gainor, J. F., Amzallag, A., Greninger, P., et al. (2014) · Science · doi:10.1126/science.1254721 · Cited by 708
Patient-Derived Tumor Xenografts: Transforming Clinical Samples into Mouse Models
Siolas, D., & Hannon, G. J. (2013) · Cancer Research · doi:10.1158/0008-5472.can-13-1069 · Cited by 672
Mazières, J., Peters, S., Lepage, B., Cortot, A. B., Barlesi, F., Beau-Faller, M., Besse, B., Blons, H., Mansuet-Lupo, A., Urban, T., et al. (2013) · Journal of Clinical Oncology · doi:10.1200/jco.2012.45.6095 · Cited by 668
Clinical Features and Outcome of Patients With Non–Small-Cell Lung Cancer Harboring BRAF Mutations
Marchetti, A., Felicioni, L., Malatesta, S., Sciarrotta, M., Guetti, L., Chella, A., Viola, P., Pullara, C., Mucilli, F., & Buttitta, F. (2011) · Journal of Clinical Oncology · doi:10.1200/jco.2011.35.9638 · Cited by 567
Tumours with class 3 BRAF mutants are sensitive to the inhibition of activated RAS
Yao, Z., Yaeger, R., Rodrik-Outmezguine, V. S., Tao, A., Torres, N. M., Chang, M. T., Drosten, M., Zhao, H., Cecchi, F., Hembrough, T., et al. (2017) · Nature · doi:10.1038/nature23291 · Cited by 562
Intra-tumour diversification in colorectal cancer at the single-cell level
Roerink, S. F., Sasaki, N., Lee-Six, H., Young, M. D., Alexandrov, L. B., Behjati, S., Mitchell, T. J., Großmann, S., Lightfoot, H. W., Egan, D. A., et al. (2018) · Nature · doi:10.1038/s41586-018-0024-3 · Cited by 558
Allen, E. M. V., Wagle, N., Stojanov, P., Perrin, D., Cibulskis, K., Marlow, S., Jané‐Valbuena, J., Friedrich, D. C., Kryukov, G. V., Carter, S. L., et al. (2014) · Nature Medicine · doi:10.1038/nm.3559 · Cited by 533
Oncotator: Cancer Variant Annotation Tool
Ramos, A. H., Lichtenstein, L., Gupta, M., Lawrence, M. S., Pugh, T. J., Saksena, G., Meyerson, M. M., & Getz, G. A. (2015) · Human Mutation · doi:10.1002/humu.22771 · Cited by 495
Drilon, A. E. D. C., Rekhtman, N., Arcila, M. E., Wang, L., Ni, A., Albano, M., van Voorthuysen, M., Somwar, R., Smith, R. S., Montecalvo, J., et al. (2016) · The Lancet Oncology · doi:10.1016/s1470-2045(16)30562-9 · Cited by 494
A network-based approach to identify substrate classes of bacterial glycosyltransferases
Sánchez‐Rodríguez, A., Tytgat, H. L. P., Winderickx, J., Vanderleyden, J., Lebeer, S., & Kathleen Marchal, D. (2014) · BMC Genomics · doi:10.1186/1471-2164-15-349 · Cited by 450
Uchibori, K., Inase, N., Araki, M., Kamada, M., Sato, S., Okuno, Y., Fujita, N., & Katayama, R. (2017) · Nature Communications · doi:10.1038/ncomms14768 · Cited by 432
Precision Targeted Therapy with BLU-667 for RET-Driven Cancers
Subbiah, V., Gainor, J. F., Rahal, R., Brubaker, J. D., Kim, J. L., Maynard, M., Hu, W., Cao, Q., Sheets, M. P., Wilson, D. P., et al. (2018) · Cancer Discovery · doi:10.1158/2159-8290.cd-18-0338 · Cited by 415
Pickl, M., & Ries, C. H. (2008) · Oncogene · doi:10.1038/onc.2008.394 · Cited by 410
Moro, L., Dolce, L., Cabodi, S., Bergatto, E., Erba, E. B., Smeriglio, M., Turco, E., Retta, S. F., Giuffrida, M. G., Venturino, M., et al. (2002) · Journal of Biological Chemistry · doi:10.1074/jbc.m109101200 · Cited by 378
Breslin, S., & O’Driscoll, L. (2016) · Oncotarget · doi:10.18632/oncotarget.9935 · Cited by 331
Organoid Cultures as Preclinical Models of Non–Small Cell Lung Cancer
Shi, R., Radulovich, N., Ng, C., Liu, N., Notsuda, H., Cabanero, M., Martins-Filho, S. N., Raghavan, V., Li, Q., Mer, A. S., et al. (2020) · Clinical Cancer Research · doi:10.1158/1078-0432.ccr-19-1376 · Cited by 316
Lim, S. M., Kim, H. R., Lee, J.-S., Lee, K. H., Lee, Y., Min, Y. J., Cho, E. K., Lee, S. S., Kim, B.-S., Choi, M. Y., et al. (2017) · Journal of Clinical Oncology · doi:10.1200/jco.2016.71.3701 · Cited by 315
Self-citationYun, J., Lee, S.-H., Kim, S.-Y., Jeong, S.-Y., Kim, J.-H., Pyo, K.-H., Park, C.-W., Heo, S. G., Yun, M. R., Lim, S., et al. (2020) · Cancer Discovery · doi:10.1158/2159-8290.cd-20-0116 · Cited by 297
Self-citationChallenges in Establishing Pure Lung Cancer Organoids Limit Their Utility for Personalized Medicine
Dijkstra, K. K., Monkhorst, K., Schipper, L. J., Hartemink, K. J., Smit, E. F., Kaing, S., de Groot, R., Wolkers, M. C., Clevers, H., Cuppen, E., et al. (2020) · Cell Reports · doi:10.1016/j.celrep.2020.107588 · Cited by 254
Robichaux, J. P., Elamin, Y. Y., Vijayan, R. S. K., Nilsson, M. B., Hu, L., He, J., Zhang, F., Pisegna, M., Poteete, A., Sun, H., et al. (2019) · Cancer Cell · doi:10.1016/j.ccell.2019.09.001 · Cited by 242
Acquired BRAF V600E Mutation as Resistant Mechanism after Treatment with Osimertinib
Ho, C., Liao, W., Lin, C.-A., Shih, J., Yu, C., & Yang, J. C. (2016) · Journal of Thoracic Oncology · doi:10.1016/j.jtho.2016.11.2231 · Cited by 219
Song, L.-X., Morris, M., Bagui, T., Lee, F., Jove, R., & Haura, E. (2006) · Cancer Research · doi:10.1158/0008-5472.can-05-4620 · Cited by 215
Non–Small Cell Lung Cancer, Version 1.2015
Ettinger, D. S., Wood, D. E., Akerley, W., Bazhenova, L. A., Borghaei, H., Camidge, D. R., Cheney, R. T., Chirieac, L. R., D’Amico, T. A., Demmy, T. L., et al. (2014) · Journal of the National Comprehensive Cancer Network · doi:10.6004/jnccn.2014.0176 · Cited by 215
Self-citationPrecision Management of Advanced Non–Small Cell Lung Cancer
Yang, C., Yang, J. C., & Yang, P. (2020) · Annual Review of Medicine · doi:10.1146/annurev-med-051718-013524 · Cited by 212
Yun, M. R., Kim, D. H., Kim, S., Joo, H.-S., Lee, Y. W., Choi, H. M., Park, C. W., Heo, S. G., Kang, H. N., Lee, S. S., et al. (2020) · Clinical Cancer Research · doi:10.1158/1078-0432.ccr-19-2777 · Cited by 122
Self-citationFridman, R., Benton, G., Aranoutova, I., Kleinman, H. K., & Bonfil, R. D. (2012) · Nature Protocols · doi:10.1038/nprot.2012.053 · Cited by 105
Fujita-Sato, S., Galeas, J., Truitt, M., Pitt, C., Urisman, A., Bandyopadhyay, S., Ruggero, D., & McCormick, F. P. (2015) · Cancer Research · doi:10.1158/0008-5472.can-14-1623 · Cited by 56
funRNA: a fungi-centered genomics platform for genes encoding key components of RNAi
Choi, J., Kim, K., Jeon, J., Wu, J., Song, H., Asiegbu, F. O., & Lee, Y. (2014) · BMC Genomics · doi:10.1186/1471-2164-15-s9-s14 · Cited by 56
Marconcini, R., Galli, L., Antonuzzo, A., Bursi, S., Roncella, C., Fontanini, G., Sensi, E., & Falcone, A. (2017) · Experimental Hematology and Oncology · doi:10.1186/s40164-017-0067-4 · Cited by 56
Src mediates ERK reactivation in gefitinib resistance in non-small cell lung cancer
Ochi, N., Takigawa, N., Harada, D., Yasugi, M., Ichihara, E., Hotta, K., Tabata, M., Tanimoto, M., & Kiura, K. (2014) · Experimental Cell Research · doi:10.1016/j.yexcr.2014.01.007 · Cited by 47
Liang, S., Ko, J., Yang, J. C., & Shih, J. (2019) · Lung Cancer · doi:10.1016/j.lungcan.2019.05.019 · Cited by 46
Huang, J., Wang, Y., Zhai, Y., & Wang, J. (2018) · Thoracic Cancer · doi:10.1111/1759-7714.12637 · Cited by 44
Establishment and characterization of primary lung cancer cell lines from Chinese population
Zheng, C., Sun, Y.-H., Ye, X.-L., Chen, H., & Ji, H.-B. (2011) · Acta Pharmacologica Sinica · doi:10.1038/aps.2010.214 · Cited by 41
Patient-Derived Cells to Guide Targeted Therapy for Advanced Lung Adenocarcinoma
Kim, S., Lee, J. Y., Kim, D., Joo, H. S., Yun, M. R., Jung, D., Yun, J., Heo, S. G., Ahn, B., Park, C. W., et al. (2019) · Scientific Reports · doi:10.1038/s41598-019-56356-4 · Cited by 40
Self-citationGalli, G., Corrao, G., Imbimbo, M., Proto, C., Signorelli, D., Ganzinelli, M., Zilembo, N., Vitali, M., de Braud, F., Garassino, M. C., et al. (2018) · Lung Cancer · doi:10.1016/j.lungcan.2017.12.002 · Cited by 29
Tso, K.-Y., Lee, S. D., Lo, K. W., & Yip, K. Y.-L. (2014) · BMC Genomics · doi:10.1186/1471-2164-15-1172 · Cited by 26
A cautionary lesson on the use of targeted methods for EGFR mutation analysis: a case report
Walsh, K., Wallace, W. A., Butler, R., Mackean, M., Harrison, D. J., Stirling, D., & Oniscu, A. (2014) · Journal of Clinical Pathology · doi:10.1136/jclinpath-2014-202313 · Cited by 12
Cited by
Sorted by citations
Tumor organoids: applications in cancer modeling and potentials in precision medicine
Xu, H., Jiao, D., Liu, A., & Wu, K. (2022) · Journal of Hematology & Oncology · doi:10.1186/s13045-022-01278-4 · Cited by 286
Organoids: The current status and biomedical applications
Yang, S., Hu, H., Kung, H., Zou, R.-Q., Dai, Y.-S., Hu, Y.-F., Wang, T., Lv, T., Yu, J., & Li, F. (2023) · MedComm · doi:10.1002/mco2.274 · Cited by 300
Self-citationWang, H.-M., Zhang, C.-Y., Peng, K., Chen, Z.-X., Su, J., Li, Y., Li, W., Gao, Q.-Y., Zhang, S., Chen, Y., et al. (2023) · Cell Reports Medicine · doi:10.1016/j.xcrm.2022.100911 · Cited by 221
Functional precision oncology using patient-derived assays: bridging genotype and phenotype
van Renterghem, A. W. J., van de Haar, J., & Voest, E. E. (2023) · Nature Reviews Clinical Oncology · doi:10.1038/s41571-023-00745-2 · Cited by 121
Tosca, E. M., Ronchi, D., Facciolo, D., & Magni, P. (2023) · Biomedicines · doi:10.3390/biomedicines11041058 · Cited by 95
Metadata
- Authors
- Kim, S.-Y., Kim, S.-M., Lim, S., Lee, J. Y., Choi, S.-J., Yang, S.-D., Yun, M. R., Kim, C. G., Gu, S. R., Park, C., Park, A.-Y., Lim, S. M., Heo, S. G., Kim, H., & Cho, B. C.
- Affiliations
- Yonsei University (KR)
- 3Interpark Bio Convergence Corp., Seoul, Korea.
- Corresponding author
- Heo, Seong Gu
- Kim, HyunKi
- Cho, Byoung Chul
- ORCID
- Venue
- Clinical Cancer Research
- Published
- 2021-06-03
- Volume
- 27
- Issue
- 15
- Pages
- 4397-4409
- ISSN
- 1078-0432 (ISSN-L)
- 1557-3265
- PMC
- PMC9401503
- OpenAlex
- W3164073476
- Cited by
- 151
- References
- 56
- Citations by year
- 2026: 26 · 2025: 35 · 2024: 39 · 2023: 28 · 2022: 19 · 2021: 4
- FWCI
- 14.55
- Type
- journal article
- Language
- en
- Open access
- hybrid
- doi.org
- Licence
- Locations
- Clinical Cancer Research (publishedVersion, cc-by-nc-nd)
- PubMed Central (publishedVersion, cc-by-nc-nd)
- PubMed (publishedVersion)
- YUHSpace (Yonsei University Medical Library) (submittedVersion, cc-by-nc-nd)
- Funders
- Interpark bio Convergence
- Ministry of Science and ICT, South Korea (2016R1A2B3016282)
- Topics
- Health Sciences › Medicine › Pulmonary and Respiratory Medicine › Lung Cancer Treatments and Mutations
- Life Sciences › Biochemistry, Genetics and Molecular Biology › Cancer Research › Cancer Genomics and Diagnostics
- Health Sciences › Medicine › Oncology › Lung Cancer Research Studies
- Keywords
- patient-derived organoids, advanced lung adenocarcinoma, non-small cell lung cancer, targeted therapy response prediction, tyrosine kinase inhibitors, dabrafenib/trametinib, EGFR exon 19 deletion, afatinib, poziotinib, pralsetinib, RET fusion, translational oncology
- MeSH terms
- Adenocarcinoma of Lung, Antineoplastic Agents, Humans, Lung Neoplasms, Models, Biological, Neoplasm Staging, Organoids
About these checks
Registry, retraction, Cites and statistics results are computed, not judged, with one exception: a printed reference that no index lists is read once by a model before it counts as a citation error. Claims are extracted by a model and kept only when their quote appears verbatim in the text; each cited source is then checked, with a model’s help, for whether it says what the claim relies on. Those verdicts can be wrong — read the claim’s quote and the cited source before relying on one.
Statistics and arithmetic are recomputed, not judged.
Confidence bands are shown only for fields calibrated on our annotated test set. None is calibrated yet, so no band is shown.
What counts as a claim ›How we measure confidence ›How we check this ›
Are you an author, or do you see a problem with this page? Request a review
