

The DOI matches its Crossref record; 59 of the 59 references it cites were found in a registry or an index.
Mesenchymal lineage heterogeneity underlies nonredundant functions of pancreatic cancer-associated fibroblasts
Open accessPublished version of a preprint
Abstract
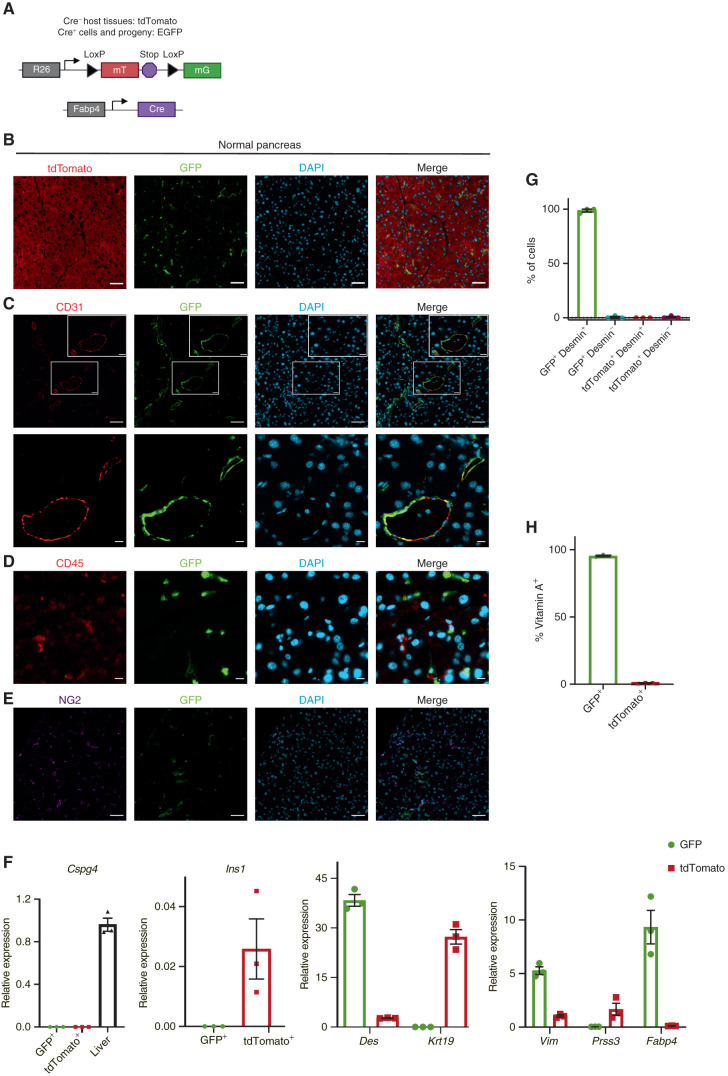
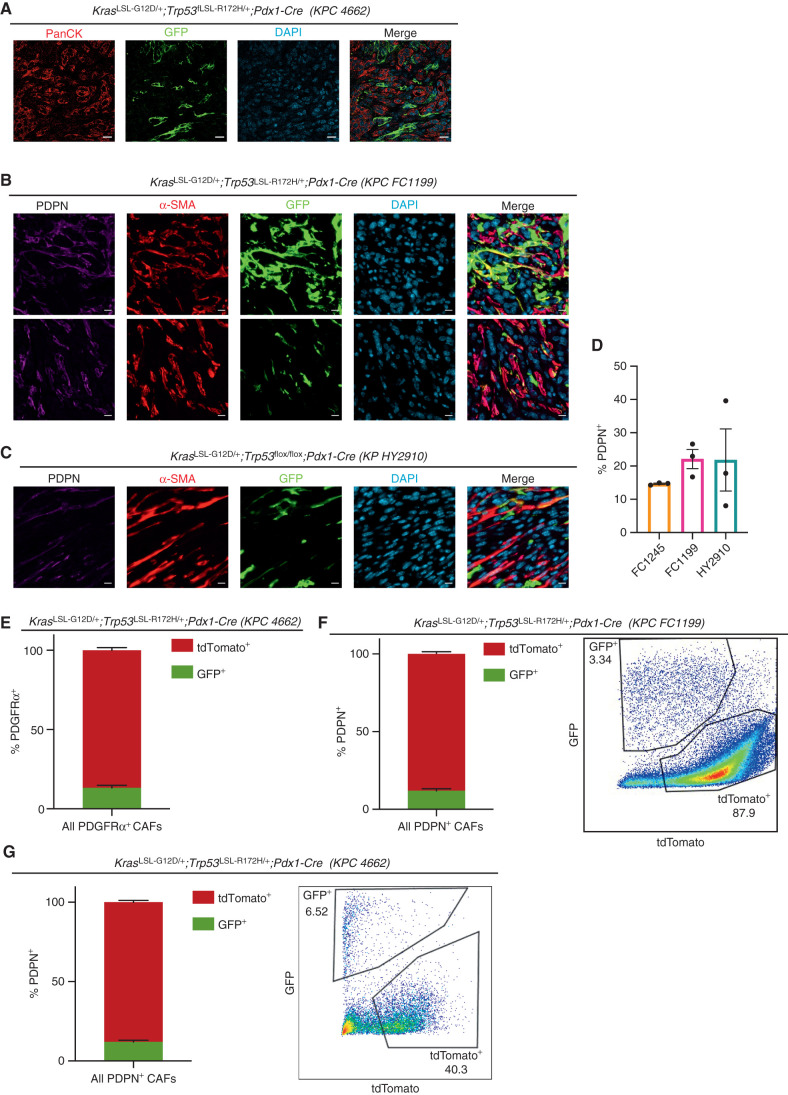
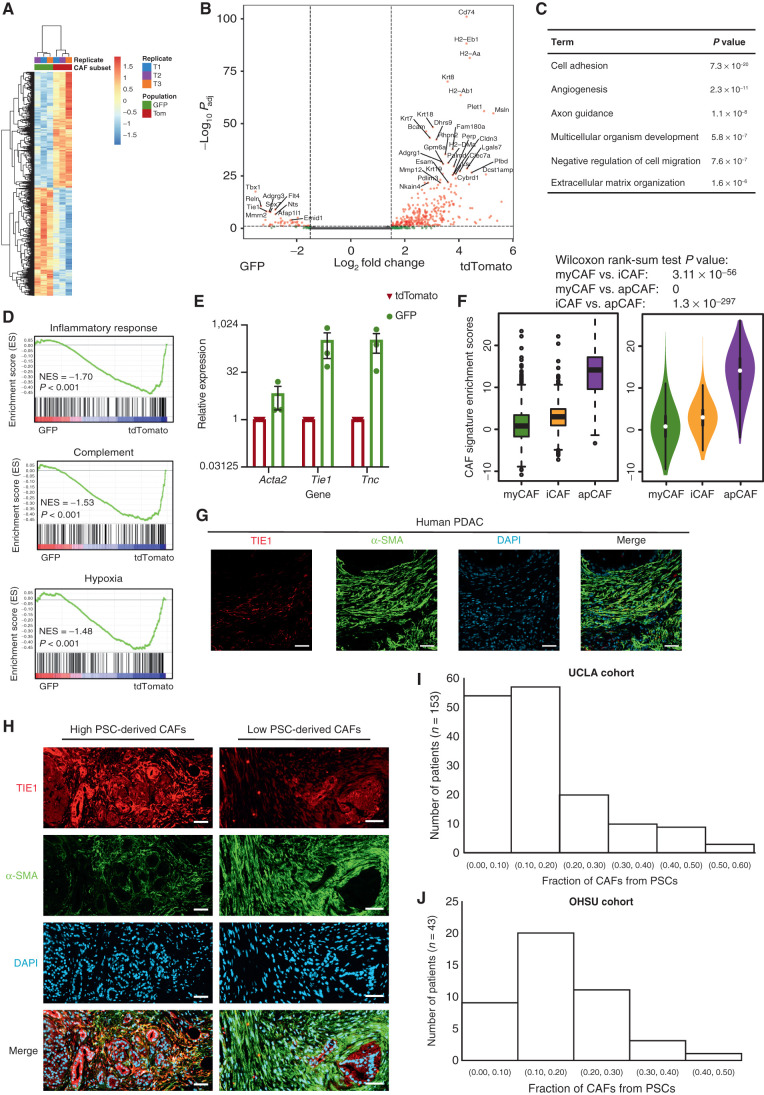
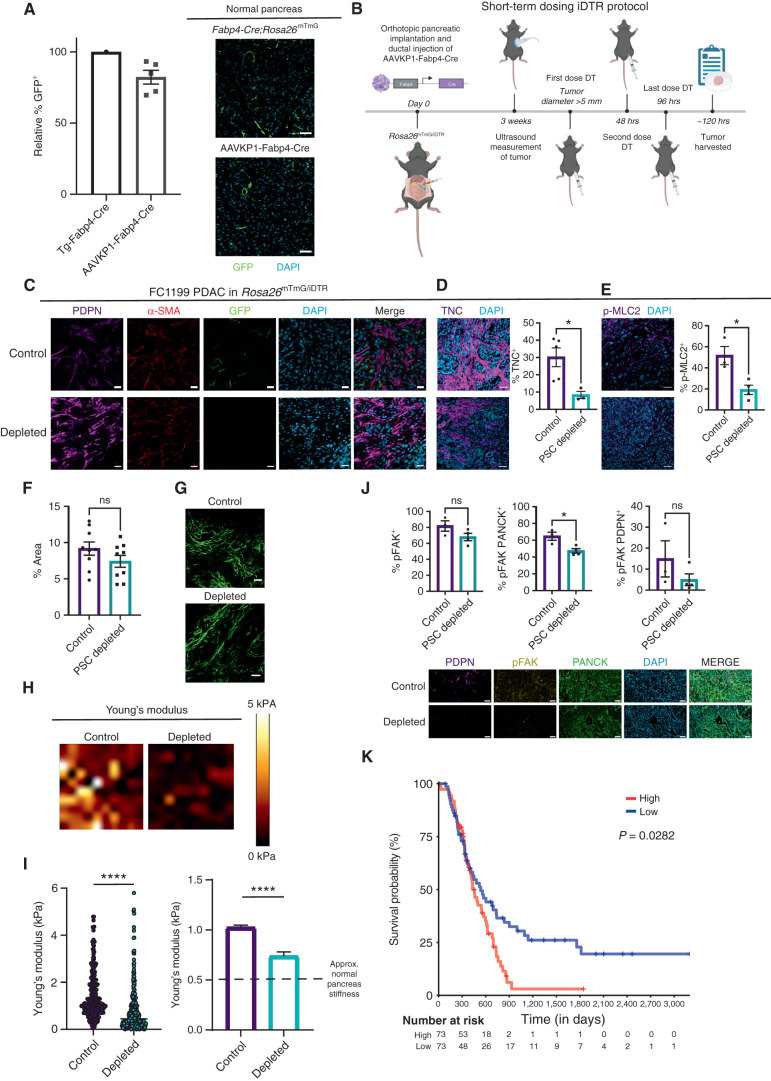
Cancer-associated fibroblast (CAF) heterogeneity is increasingly appreciated, but the origins and functions of distinct CAF subtypes remain poorly understood. The abundant and transcriptionally diverse CAF population in pancreatic ductal adenocarcinoma (PDAC) is thought to arise from a common cell of origin, pancreatic stellate cells (PSC), with diversification resulting from cytokine and growth factor gradients within the tumor microenvironment. Here we analyzed the differentiation and function of PSCs during tumor progression in vivo. Contrary to expectations, we found that PSCs give rise to a numerically minor subset of PDAC CAFs. Targeted ablation of PSC-derived CAFs within their host tissue revealed nonredundant functions for this defined CAF population in shaping the PDAC microenvironment, including production of specific extracellular matrix components and tissue stiffness regulation. Together, these findings link stromal evolution from distinct cells of origin to transcriptional heterogeneity among PDAC CAFs and demonstrate unique functions for CAFs of a defined cellular origin. Significance: By tracking and ablating a specific CAF population, we find that a numerically minor CAF subtype from a defined cell of origin plays unique roles in establishing the pancreatic tumor microenvironment. Together with prior studies, this work suggests that mesenchymal lineage heterogeneity and signaling gradients diversify PDAC CAFs. See related commentary by Cukierman, p. 296. This article is highlighted in the In This Issue feature, p. 275
Overview
The claims and statistics of this paper haven’t been checked yet.
Run the check — free, no account needed. It reads the open-access text and checks the sources it cites.
Integrity signals
Registry
Cites
Statistics
Figures
Verification
Claims the paper makes
The claims and statistics of this paper haven’t been checked yet.
Run the check — free, no account needed. It reads the open-access text and checks the sources it cites.
Claims other papers make about this one
Each is checked against this paper’s own text: does it say what the citing paper says it does?
In the citing paper
“recent lineage tracing studies targeting Fabp4+ stellate cells revealed that they give rise to a minority of CAFs142,143”
From Pancreatic cancer: Advances and challenges (2023) · cites this paper as [142]
Self-check
Percentages, sums and reported differences re-computed from the paper’s own numbers.
The self-check needs the paper’s full text.
Citations
Cites
A framework for advancing our understanding of cancer-associated fibroblasts
Sahai, E., Astsaturov, I., Cukierman, E., DeNardo, D. G., Egeblad, M., Evans, R. M., Fearon, D., Greten, F. R., Hingorani, S. R., Hunter, T., et al. (2020) · Nature Reviews Cancer · doi:10.1038/s41568-019-0238-1 · Cited by 3,863
Self-citationA global double-fluorescent Cre reporter mouse
Muzumdar, M. D., Tasic, B., Miyamichi, K., Li, L., & Luo, L. (2007) · genesis · doi:10.1002/dvg.20335 · Cited by 3,491
Olive, K. P., Jacobetz, M. A., Davidson, C. J., Gopinathan, A., McIntyre, D., Honess, D., Madhu, B., Goldgraben, M. A., Caldwell, M. E., Allard, D., et al. (2009) · Science · doi:10.1126/science.1171362 · Cited by 3,170
Self-citationÖzdemir, B. C., Pentcheva-Hoang, T., Carstens, J. L., Zheng, X., Wu, C.-C., Simpson, T. R., Laklai, H., Sugimoto, H., Kahlert, C., Novitskiy, S. V., et al. (2014) · Cancer Cell · doi:10.1016/j.ccr.2014.04.005 · Cited by 2,681
Hingorani, S. R., Wang, L., Multani, A. S., Combs, C., Deramaudt, T. B., Hruban, R. H., Rustgi, A. K., Chang, S., & Tuveson, D. A. (2005) · Cancer Cell · doi:10.1016/j.ccr.2005.04.023 · Cited by 2,609
Self-citationDistinct populations of inflammatory fibroblasts and myofibroblasts in pancreatic cancer
Öhlund, D., Handly-Santana, A., Biffi, G., Elyada, E., Almeida, A. S., Ponz-Sarvise, M., Corbo, V., Oni, T. E., Hearn, S. A., Lee, E. J., et al. (2017) · Journal of Experimental Medicine · doi:10.1084/jem.20162024 · Cited by 2,590
Elyada, E., Bolisetty, M., Laise, P., Flynn, W. F., Courtois, E. T., Burkhart, R. A., Teinor, J. A., Belleau, P., Biffi, G., Lucito, M. S., et al. (2019) · Cancer Discovery · doi:10.1158/2159-8290.cd-19-0094 · Cited by 2,241
Provenzano, P. P., Cuevas, C., Chang, A. E., Goel, V. K., Von Hoff, D. D., & Hingorani, S. R. (2012) · Cancer Cell · doi:10.1016/j.ccr.2012.01.007 · Cited by 2,195
Self-citationFeig, C., Jones, J. O., Kraman, M., Wells, R. J. B., Deonarine, A., Chan, D. S., Connell, C. M., Roberts, E. W., Zhao, Q., Caballero, O. L., et al. (2013) · Proceedings of the National Academy of Sciences · doi:10.1073/pnas.1320318110 · Cited by 2,100
Stromal Elements Act to Restrain, Rather Than Support, Pancreatic Ductal Adenocarcinoma
Rhim, A. D., Oberstein, P. E., Thomas, D. H., Mirek, E. T., Palermo, C. F., Sastra, S. A., Dekleva, E. N., Saunders, T., Becerra, C. P., Tattersall, I. W., et al. (2014) · Cancer Cell · doi:10.1016/j.ccr.2014.04.021 · Cited by 2,085
Mederacke, I., Hsu, C. C., Troeger, J. S., Huebener, P., Mu, X., Dapito, D. H., Pradere, J.-P., & Schwabe, R. F. (2013) · Nature Communications · doi:10.1038/ncomms3823 · Cited by 1,443
Biffi, G., Oni, T. E., Spielman, B., Hao, Y., Elyada, E., Park, Y., Preall, J., & Tuveson, D. A. (2019) · Cancer Discovery · doi:10.1158/2159-8290.cd-18-0710 · Cited by 1,360
Diversity and biology of cancer-associated fibroblasts
Biffi, G., & Tuveson, D. A. (2021) · Physiological Reviews · doi:10.1152/physrev.00048.2019 · Cited by 1,265
Sherman, M. H., Yu, R. T., Engle, D. D., Ding, N., Atkins, A. R., Tiriac, H., Collisson, E. A., Connor, F., Van Dyke, T., Kozlov, S., et al. (2014) · Cell · doi:10.1016/j.cell.2014.08.007 · Cited by 1,158
Self-citationPancreatic stellate cells support tumour metabolism through autophagic alanine secretion
Sousa, C. M., Biancur, D. E., Wang, X., Halbrook, C. J., Sherman, M. H., Zhang, L., Kremer, D., Hwang, R. F., Witkiewicz, A. K., Ying, H., et al. (2016) · Nature · doi:10.1038/nature19084 · Cited by 1,122
Self-citationHyaluronan impairs vascular function and drug delivery in a mouse model of pancreatic cancer
Jacobetz, M. A., Chan, D. S., Neesse, A., Bapiro, T. E., Cook, N., Frese, K. K., Feig, C., Nakagawa, T., Caldwell, M. E., Zecchini, H. I., et al. (2013) · Gut · doi:10.1136/gutjnl-2012-302529 · Cited by 1,120
Targeting focal adhesion kinase renders pancreatic cancers responsive to checkpoint immunotherapy
Jiang, H., Hegde, S., Knolhoff, B. L., Zhu, Y., Herndon, J. M., Meyer, M. A., Nywening, T. M., Hawkins, W. G., Shapiro, I. M., Weaver, D. T., et al. (2016) · Nature Medicine · doi:10.1038/nm.4123 · Cited by 1,060
Identification, culture, and characterization of pancreatic stellate cells in rats and humans
Bachem, M. G., Schneider, E., Groß, H., Weidenbach, H., Schmid, R. M., Menke, A., Siech, M., Beger, H. G., Grünert, A., & Adler, G. (1998) · Gastroenterology · doi:10.1016/s0016-5085(98)70209-4 · Cited by 1,017
He, W., Barak, Y., Hevener, A. L., Olson, P., Liao, D., Le, J., Nelson, M. C., Ong, E. S., Olefsky, J. M., & Evans, R. M. (2003) · Proceedings of the National Academy of Sciences · doi:10.1073/pnas.2536828100 · Cited by 978
Tumor microenvironment derived exosomes pleiotropically modulate cancer cell metabolism
Zhao, H., Yang, L., Baddour, J., Achreja, A., Bernard, V., Moss, T., Marini, J. C., Tudawe, T., Seviour, E. G., San Lucas, F. A., et al. (2016) · eLife · doi:10.7554/elife.10250 · Cited by 927
A Cre-inducible diphtheria toxin receptor mediates cell lineage ablation after toxin administration
Buch, T., Heppner, F. L., Tertilt, C., Heinen, T. J. A. J., Kremer, M., Wunderlich, F. T., Jung, S., & Waisman, A. (2005) · Nature Methods · doi:10.1038/nmeth762 · Cited by 922
Periacinar stellate shaped cells in rat pancreas: identification, isolation, and culture
Apte, M. V., Haber, P., Applegate, T. L., Norton, I. D., McCaughan, G. W., Korsten, M. A., Pirola, R. C., & Wilson, J. S. (1998) · Gut · doi:10.1136/gut.43.1.128 · Cited by 920
Lesina, M., Kurkowski, M. U., Ludes, K., Rose-John, S., Treiber, M., Klöppel, G., Yoshimura, A., Reindl, W., Sipos, B., Akira, S., et al. (2011) · Cancer Cell · doi:10.1016/j.ccr.2011.03.009 · Cited by 862
Dominguez, C. X., Müller, S., Keerthivasan, S., Koeppen, H., Hung, J., Gierke, S., Breart, B., Foreman, O., Bainbridge, T. W., Castiglioni, A., et al. (2020) · Cancer Discovery · doi:10.1158/2159-8290.cd-19-0644 · Cited by 857
Maitra, A., & Hruban, R. H. (2008) · Annual Review of Pathology: Mechanisms of Disease · doi:10.1146/annurev.pathmechdis.3.121806.154305 · Cited by 707
Laklai, H., Miroshnikova, Y. A., Pickup, M. W., Collisson, E. A., Kim, G., Barrett, A., Hill, R. C., Lakins, J. N., Schlaepfer, D. D., Mouw, J. K., et al. (2016) · Nature Medicine · doi:10.1038/nm.4082 · Cited by 614
Desmoplastic Reaction in Pancreatic Cancer: Role of Pancreatic Stellate Cells
Apte, M. V., Park, S., Phillips, P. A., Santucci, N., Goldstein, D., Kumar, R. K., Ramm, G. A., Buchler, M., Friess, H., McCarroll, J. A., et al. (2004) · Pancreas · doi:10.1097/00006676-200410000-00002 · Cited by 591
Chen, Y., Kim, J., Yang, S., Wang, H., Wu, C.-J., Sugimoto, H., LeBleu, V. S., & Kalluri, R. (2021) · Cancer Cell · doi:10.1016/j.ccell.2021.02.007 · Cited by 566
Origin of myofibroblasts in the fibrotic liver in mice
Iwaisako, K., Jiang, C., Zhang, M., Cong, M., Moore-Morris, T. J., Park, T. J., Liu, X., Xu, J., Wang, P., Paik, Y.-H., et al. (2014) · Proceedings of the National Academy of Sciences · doi:10.1073/pnas.1400062111 · Cited by 535
Stat3 and MMP7 Contribute to Pancreatic Ductal Adenocarcinoma Initiation and Progression
Fukuda, A., Wang, S. C., Morris, J. P., Folias, A. E., Liou, A., Kim, G., Akira, S., Boucher, K. M., Firpo, M. A., Mulvihill, S. J., et al. (2011) · Cancer Cell · doi:10.1016/j.ccr.2011.03.002 · Cited by 528
Rice, A. J., Cortes, E., Lachowski, D., Cheung, B. C. H., Karim, S. A., Morton, J. P., & Hernández, A. E. D. R. (2017) · Oncogenesis · doi:10.1038/oncsis.2017.54 · Cited by 526
Stromal response to Hedgehog signaling restrains pancreatic cancer progression
Lee, J. J., Perera, R. M., Wang, H., Wu, D.-C., Liu, X. S., Han, S., Fitamant, J., Jones, P. D., Ghanta, K. S., Kawano, S., et al. (2014) · Proceedings of the National Academy of Sciences · doi:10.1073/pnas.1411679111 · Cited by 502
Van Cutsem, E., Tempero, M. A., Sigal, D., Oh, D.-Y., Fazio, N., Macarulla, T., Hitre, E., Hammel, P., Hendifar, A. E., Bates, S. E., et al. (2020) · Journal of Clinical Oncology · doi:10.1200/jco.20.00590 · Cited by 499
Self-citationMutant p53 Drives Pancreatic Cancer Metastasis through Cell-Autonomous PDGF Receptor β Signaling
Weissmueller, S., Manchado, E., Saborowski, M., Morris, J. P., Wagenblast, E., Davis, C. A., Moon, S.-H., Pfister, N. T., Tschaharganeh, D. F., Kitzing, T., et al. (2014) · Cell · doi:10.1016/j.cell.2014.01.066 · Cited by 466
StellaTUM: current consensus and discussion on pancreatic stellate cell research
Erkan, M., Adler, G., Apte, M. V., Bachem, M. G., Buchholz, M., Detlefsen, S., Esposito, I., Frieß, H., Gress, T. M., Habisch, H., et al. (2011) · Gut · doi:10.1136/gutjnl-2011-301220 · Cited by 411
Zhang, Y., Lazarus, J., Steele, N. G., Yan, W., Lee, H.-J., Nwosu, Z. C., Halbrook, C. J., Menjivar, R. E., Kemp, S. B., Sirihorachai, V. R., et al. (2020) · Cancer Discovery · doi:10.1158/2159-8290.cd-19-0958 · Cited by 385
A Stromal Lysolipid–Autotaxin Signaling Axis Promotes Pancreatic Tumor Progression
Auciello, F. R., Bulusu, V., Oon, C., Tait-Mulder, J., Berry, M., Bhattacharyya, S., Tumanov, S., Allen-Petersen, B. L., Link, J., Kendsersky, N. D., et al. (2019) · Cancer Discovery · doi:10.1158/2159-8290.cd-18-1212 · Cited by 332
Self-citationNeuzillet, C., Tijeras‐Raballand, A., Ragulan, C., Cros, J. F., Patil, Y., Martinet, M., Erkan, M., Kleeff, J. H., Wilson, J. S., Apte, M. V., et al. (2018) · The Journal of Pathology · doi:10.1002/path.5224 · Cited by 310
Hosein, A. N., Huang, H., Wang, Z., Parmar, K., Du, W., Huang, J., Maitra, A., Olson, E., Verma, U., & Brekken, R. A. (2019) · JCI Insight · doi:10.1172/jci.insight.129212 · Cited by 302
Inhibition of Hedgehog Signaling Alters Fibroblast Composition in Pancreatic Cancer
Steele, N. G., Biffi, G., Kemp, S. B., Zhang, Y., Drouillard, D., Syu, L.-J., Yuan, H., Oni, T. E., Brosnan, E., Elyada, E., et al. (2021) · Clinical Cancer Research · doi:10.1158/1078-0432.ccr-20-3715 · Cited by 289
Fibroblast Heterogeneity in the Pancreatic Tumor Microenvironment
Helms, E. J., Oñate, M. K., & Sherman, M. H. (2020) · Cancer Discovery · doi:10.1158/2159-8290.cd-19-1353 · Cited by 288
Self-citationBone marrow–derived fibroblasts are a functionally distinct stromal cell population in breast cancer
Raz, Y., Cohen, N., Shani, O., Bell, R. E., Novitskiy, S. V., Abramovitz, L., Levy, C., Milyavsky, M., Leider–Trejo, L., Moses, H. L., et al. (2018) · The Journal of Experimental Medicine · doi:10.1084/jem.20180818 · Cited by 272
CXCR4 inhibition in human pancreatic and colorectal cancers induces an integrated immune response
Biasci, D., Smoragiewicz, M., Connell, C. M., Wang, Z., Gao, Y., Thaventhiran, J. E. D., Basu, B., Magiera, Ł., Johnson, T. I., Bax, L., et al. (2020) · Proceedings of the National Academy of Sciences · doi:10.1073/pnas.2013644117 · Cited by 271
Vennin, C., Mélénec, P., Rouet, R., Nobis, M., Cazet, A. S., Murphy, K. J., Herrmann, D., Reed, D. A., Lucas, M. C., Warren, S. C., et al. (2019) · Nature Communications · doi:10.1038/s41467-019-10968-6 · Cited by 268
Chiou, S., Winters, I. P., Wang, J., Naranjo, S., Dudgeon, C., Tamburini, F. B., Brady Jennifer, J., Yang, D., Grüner, B. M., Chuang, C.-H., et al. (2015) · Genes & Development · doi:10.1101/gad.264861.115 · Cited by 267
Francescone, R., Costa, D. B. V., Franco‐Barraza, J., Wagner, J., Muir, A., Lau, A. N., Gabitova, L., Pazina, T., Gupta, S., Luong, T., et al. (2020) · Cancer Discovery · doi:10.1158/2159-8290.cd-20-0775 · Cited by 227
Manuyakorn, A., Paulus, R., Farrell, J. J., Dawson, N. A., Tze, S., Cheung-Lau, G. C., Hines, O. J., Reber, H. A., Seligson, D. B., Horvath, S., et al. (2010) · Journal of Clinical Oncology · doi:10.1200/jco.2009.24.5639 · Cited by 216
Self-citationExtracellular matrix directs phenotypic heterogeneity of activated fibroblasts
Avery, D., Govindaraju, P., Jacob, M., Todd, L., Monslow, J., & Puré, E. (2018) · Matrix Biology · doi:10.1016/j.matbio.2017.12.003 · Cited by 206
Fate-Mapping Evidence That Hepatic Stellate Cells Are Epithelial Progenitors in Adult Mouse Livers
Yang, L., Jung, Y., Omenetti, A., Witek, R. P., Choi, S. S., VanDongen, H. M. A., Huang, J., Alpini, G. D., & Diehl, A. M. (2008) · Stem Cells · doi:10.1634/stemcells.2008-0115 · Cited by 205
Zhu, Z., Achreja, A., Meurs, N., Animasahun, O., Owen, S., Mittal, A., Parikh, P., Lo, T.-W., Franco-Barraza, J., Shi, J., et al. (2020) · Nature Metabolism · doi:10.1038/s42255-020-0226-5 · Cited by 204
Self-citationStromal cues regulate the pancreatic cancer epigenome and metabolome
Sherman, M. H., Yu, R. T., Tseng, T. W., Sousa, C. M., Liu, S., Truitt, M. L., He, N., Ding, N., Liddle, C., Atkins, A. R., et al. (2017) · Proceedings of the National Academy of Sciences · doi:10.1073/pnas.1620164114 · Cited by 147
Self-citationPancreatic ductal adenocarcinoma progression is restrained by stromal matrix
Jiang, H., Torphy, R. J., Steiger, K., Hongo, H., Ritchie, A. J., Kriegsmann, M., Horst, D., Umetsu, S. E., Joseph, N. M., McGregor, K., et al. (2020) · Journal of Clinical Investigation · doi:10.1172/jci136760 · Cited by 127
Zhang, Y., Recouvreux, M. V., Jung, M., Galenkamp, K. M. O., Li, Y., Zagnitko, O., Scott, D. A., Lowy, A. M., & Commisso, C. (2021) · Cancer Discovery · doi:10.1158/2159-8290.cd-20-0119 · Cited by 116
Differential contribution of pancreatic fibroblast subsets to the pancreatic cancer stroma
Garcia, P. E., Adoumie, M., Kim, E. C., Zhang, Y., Scales, M. K., El-Tawil, Y. S., Shaikh, A. Z., Wen, H.-J., Bednar, F., Allen, B. L., et al. (2020) · Cellular and Molecular Gastroenterology and Hepatology · doi:10.1016/j.jcmgh.2020.05.004 · Cited by 110
Stellate Cells in Tissue Repair, Inflammation, and Cancer
Sherman, M. H. (2018) · Annual Review of Cell and Developmental Biology · doi:10.1146/annurev-cellbio-100617-062855 · Cited by 104
Self-citationTorphy, R. J., Wang, Z., True‐Yasaki, A., Volmar, K. E., Rashid, N. U., Yeh, B. M., Johansen, J. S., Hollingsworth, M. A., Yeh, J. J., & Collisson, E. A. (2018) · JCO Precision Oncology · doi:10.1200/po.17.00121 · Cited by 90
Riopel, M., Li, J., Liu, S., Leask, A., & Wang, R. (2012) · Laboratory Investigation · doi:10.1038/labinvest.2012.147 · Cited by 66
Hepatic stellate cell nomenclature.
Ahern, M., Hall, P. D. L. Μ., Halliday, J., Liddle, C., Olynyk, J. K., Ramm, G. A., Denk, H., Desmet, V., Geerts, A. E., Borojević, R., et al. (1996) · PubMed · Cited by 37
Long-Term Correction of Diabetes in Mice by In Vivo Reprogramming of Pancreatic Ducts
Wang, Y., Dorrell, C., Naugler, W. E., Heskett, M. B., Spellman, P. T., Li, B., Galivo, F., Haft, A., Wakefield, L., & Grompe, M. (2018) · Molecular Therapy · doi:10.1016/j.ymthe.2018.02.014 · Cited by 29
Cited by
Sorted by citations
The evolving tumor microenvironment: From cancer initiation to metastatic outgrowth
de Visser, K. E., & Joyce, J. A. (2023) · Cancer Cell · doi:10.1016/j.ccell.2023.02.016 · Cited by 4,059
Pancreatic cancer: Advances and challenges
Halbrook, C. J., Lyssiotis, C. A., Pasca di Magliano, M., & Maitra, A. (2023) · Cell · doi:10.1016/j.cell.2023.02.014 · Cited by 1,321
Yuan, Z., Li, Y., Zhang, S., Wang, X., Dou, H., Yu, X., Zhang, Z., Yang, S., & Xiao, M. (2023) · Molecular Cancer · doi:10.1186/s12943-023-01744-8 · Cited by 977
The cancer-immunity cycle: Indication, genotype, and immunotype
Mellman, I., Chen, D. S., Powles, T. B., & Turley, S. J. (2023) · Immunity · doi:10.1016/j.immuni.2023.09.011 · Cited by 1,018
Cancer-associated fibroblasts in the single-cell era
Lavie, D., Ben‐Shmuel, A., Erez, N., & Scherz‐Shouval, R. (2022) · Nature Cancer · doi:10.1038/s43018-022-00411-z · Cited by 656
Metadata
- Authors
- Helms, E. J., Berry, M. W., Chaw, R. C., DuFort, C. C., Sun, D., Onate, M. K., Oon, C., Bhattacharyya, S., Sanford-Crane, H., Horton, W., Finan, J. M., Sattler, A., Makar, R., Dawson, D. W., Xia, Z., Hingorani, S. R., & Sherman, M. H.
- Affiliations
- Oregon Health & Science University (US)
- Fred Hutch Cancer Center (US)
- 1Department of Cell, Developmental & Cancer Biology, Oregon Health & Science University, Portland, Oregon.
- University of California, Los Angeles (US)
- University of Washington (US)
- Corresponding author
- Sherman, Mara H.
- ORCID
- Venue
- Cancer Discovery
- Published
- 2021-09-21
- Volume
- 12
- Issue
- 2
- Pages
- 484-501
- ISSN
- 2159-8274 (ISSN-L)
- 2159-8290
- PMC
- PMC8831457
- OpenAlex
- W3199988150
- Cited by
- 238
- References
- 59
- Citations by year
- 2026: 41 · 2025: 49 · 2024: 52 · 2023: 54 · 2022: 34 · 2021: 8
- FWCI
- 13.57
- Type
- journal article
- Language
- en
- Open access
- hybrid
- doi.org
- Licence
- Locations
- Cancer Discovery (publishedVersion, cc-by-nc-nd)
- bioRxiv (Cold Spring Harbor Laboratory) (acceptedVersion, cc-by-nc-nd)
- PubMed Central (publishedVersion, cc-by-nc-nd)
- PubMed (publishedVersion)
- Funders
- National Institute of General Medical Sciences (T32 GM071338)
- National Cancer Institute (R01 CA161112, U01 CA224193, R01 CA250917)
- U.S. Department of Defense (W81XWH-18-1-0437)
- Pew Charitable Trusts
- Topics
- Health Sciences › Medicine › Oncology › Pancreatic and Hepatic Oncology Research
- Health Sciences › Medicine › Oncology › Cancer Cells and Metastasis
- Life Sciences › Biochemistry, Genetics and Molecular Biology › Cell Biology › Cellular Mechanics and Interactions
- Keywords
- cancer-associated fibroblasts, pancreatic ductal adenocarcinoma, pancreatic stellate cells, CAF heterogeneity, mesenchymal lineage, tumor microenvironment, extracellular matrix, tissue stiffness, cell of origin
- MeSH terms
- Cancer-Associated Fibroblasts, Animals, Female, Humans, Male, Pancreatic Neoplasms, Gene Expression Regulation, Neoplastic, Mice, Mesenchymal Stem Cells
About these checks
Registry, retraction, Cites and statistics results are computed, not judged, with one exception: a printed reference that no index lists is read once by a model before it counts as a citation error. Claims are extracted by a model and kept only when their quote appears verbatim in the text; each cited source is then checked, with a model’s help, for whether it says what the claim relies on. Those verdicts can be wrong — read the claim’s quote and the cited source before relying on one.
Statistics and arithmetic are recomputed, not judged.
Confidence bands are shown only for fields calibrated on our annotated test set. None is calibrated yet, so no band is shown.
What counts as a claim ›How we measure confidence ›How we check this ›
Are you an author, or do you see a problem with this page? Request a review
