Cited by 119Cardiovascular Function and Risk FactorsMitochondrial Function and PathologyCardiac Ischemia and Reperfusion

The DOI matches its Crossref record; 35 of the 36 references it cites were found in a registry or an index.

Role of Mitochondrial Oxidative Stress in Glucose Tolerance, Insulin Resistance, and Cardiac Diastolic Dysfunction

Open access

Abstract

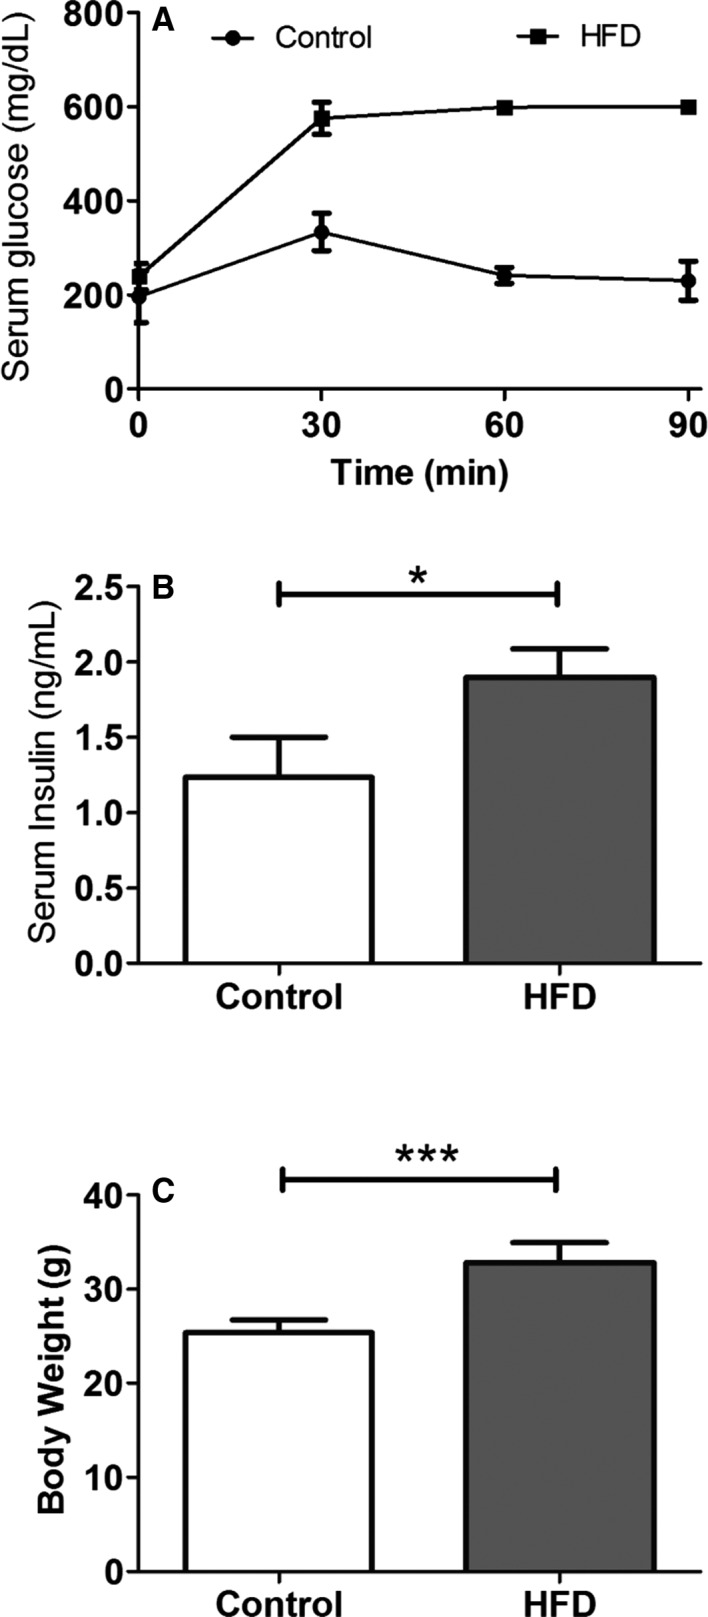
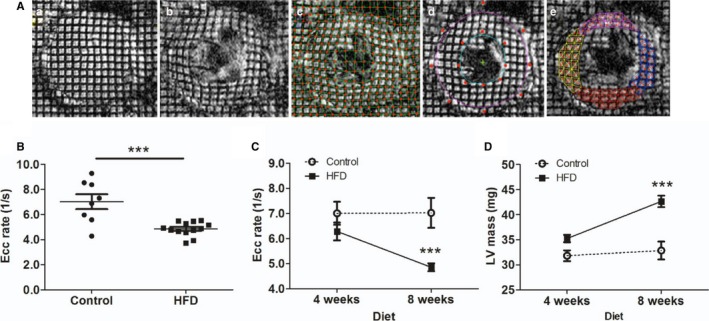
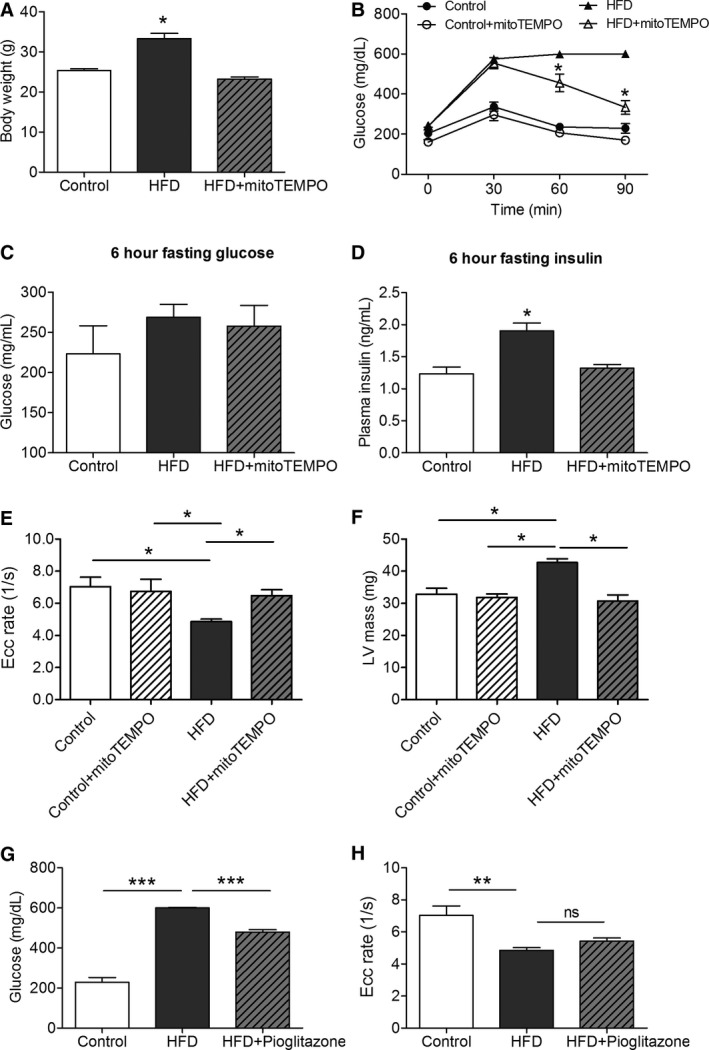
Background: Diabetes mellitus (DM) is associated with mitochondrial oxidative stress. We have shown that myocardial oxidative stress leads to diastolic dysfunction in a hypertensive mouse model. Therefore, we hypothesized that diabetes mellitus could cause diastolic dysfunction through mitochondrial oxidative stress and that a mitochondria‐targeted antioxidant (Mito TEMPO ) could prevent diastolic dysfunction in a diabetic mouse model. Methods and Results: C57 BL /6J mice were fed either 60 kcal % fat diet (high‐fat diet [ HFD ]) or normal chow (control) for 8 weeks with or without concurrent Mito TEMPO administration, followed by in vivo assessment of diastolic function and ex vivo studies. HFD mice developed impaired glucose tolerance compared with the control (serum glucose=495±45 mg/dL versus 236±30 mg/dL at 60 minutes after intraperitoneal glucose injection, P <0.05). Myocardial tagged cardiac magnetic resonance imaging showed significantly reduced diastolic circumferential strain (Ecc) rate in the HFD mice compared with controls (5.0±0.3 1/s versus 7.4±0.5 1/s, P <0.05), indicating diastolic dysfunction in the HFD mice. Systolic function was comparable in both groups (left ventricular ejection fraction=66.4±1.4% versus 66.7±1.2%, P >0.05). Mito TEMPO ‐treated HFD mice showed significant reduction in mitochondria reactive oxygen species, S ‐glutathionylation of cardiac myosin binding protein C, and diastolic dysfunction, comparable to the control. The fasting insulin levels of Mito TEMPO ‐treated HFD mice were also comparable to the controls ( P >0.05). Conclusions: Mito TEMPO treatment prevented insulin resistance and diastolic dysfunction, suggesting that mitochondrial oxidative stress may be involved in the pathophysiology of both conditions.

Overview

The claims and statistics of this paper haven’t been checked yet.

Run the check — free, no account needed. It reads the open-access text and checks the sources it cites.

A few free checks a day · papers already verified open instantly · results are public

Integrity signals

Registry

Crossref · 10.1161/jaha.115.003046

Cites

35 of 35 references verified0 citation errors · 0 not checkable

Statistics

Figures

Figure 1 Intraperitoneal glucose tolerance test and insulin level in HFD mice. A, Serial measurements of serum glucose level following intraperitoneal challenge of glucose at 2 g/kg of body weight. B, Random serum insulin level at 8 weeks of HFD (N=5 in control, N=7 in the HFD group). C, Body weight. (N=9 in each group; Data are mean±SD). *P<0.05, and ***P<0.001 using the Mann–Whitney test. HFD indicates high‐fat diet.
Figure 1 Intraperitoneal glucose tolerance test and insulin level in HFD mice. A, Serial measurements of serum glucose level following intraperitoneal challenge of glucose at 2 g/kg of body weight. B, Random serum insulin level at 8 weeks of HFD (N=5 in control, N=7 in the HFD group). C, Body weight. (N=9 in each group; Data are mean±SD). *P<0.05, and ***P<0.001 using the Mann–Whitney test. HFD indicates high‐fat diet.CC BY-NC · PubMed Central
Figure 2 Measurement of diastolic function in HFD mice by CMR imaging. A, Myocardial tagging CMR imaging. Tagged images were obtained from end‐systole (a) to end‐diastole (b) at 5‐ms intervals. Intersections of tagging‐grid lines were traced manually (c). Endocardium and epicardium were contoured by the B‐spline method (d). Triangulation of grid lines enabled harmonic phase analyses for circumferential and radial strain calculations (e). B, Circumferential strain (Ecc) rate during the rapid filling phase in control and HFD mice (8 weeks; N=8 in control, N=13 in the HFD group). C, Longitudinal assessment of Ecc rate at 4 and 8 weeks (N=10 in control, N=13 in the HFD group). D, Longitudinal assessment of LV mass. N=10 to 13 in each group. ***P<0.001. CMR indicates cardiac magnetic resonance; Ecc, circumferential strain rate; HFD, high‐fat diet; LV, left ventricular.
Figure 2 Measurement of diastolic function in HFD mice by CMR imaging. A, Myocardial tagging CMR imaging. Tagged images were obtained from end‐systole (a) to end‐diastole (b) at 5‐ms intervals. Intersections of tagging‐grid lines were traced manually (c). Endocardium and epicardium were contoured by the B‐spline method (d). Triangulation of grid lines enabled harmonic phase analyses for circumferential and radial strain calculations (e). B, Circumferential strain (Ecc) rate during the rapid filling phase in control and HFD mice (8 weeks; N=8 in control, N=13 in the HFD group). C, Longitudinal assessment of Ecc rate at 4 and 8 weeks (N=10 in control, N=13 in the HFD group). D, Longitudinal assessment of LV mass. N=10 to 13 in each group. ***P<0.001. CMR indicates cardiac magnetic resonance; Ecc, circumferential strain rate; HFD, high‐fat diet; LV, left ventricular.CC BY-NC · PubMed Central
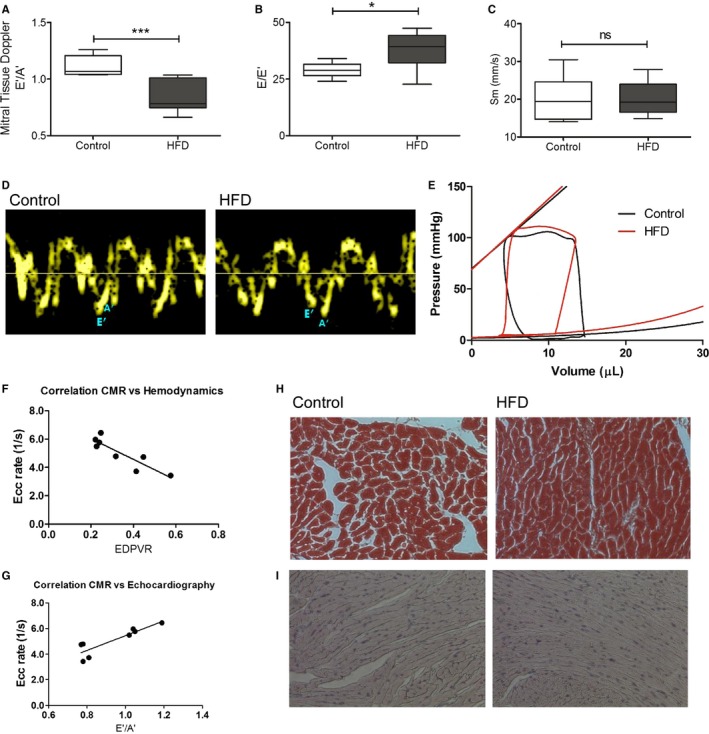
Figure 3 Echocardiography and hemodynamics in the HFD mice. A through D, Noninvasive transthoracic echocardiography. Tissue Doppler imaging and pulse‐wave Doppler measured mitral inflow from the apical four‐chamber view. A, E′/A′ ratio. B, E/E′ ratio. C, peak systolic velocity of the myocardial segment, Sm. D, Representative tissue Doppler images in control and HFD mice. *P<0.05. ***P<0.001 using an unpaired Student t test (N=6–10). E, Invasive hemodynamic measurement of multiple loops of EDPVR (N=5 in control, N=6 in the HFD group). F, Spearman correlation of CMR imaging strain rate, Ecc rate, and hemodynamics, EDPVR (N=8). G, Spearman correlation of CMR imaging strain rate, Ecc rate, and echocardiography, E′/A′ ratio (N=8). H, Trichrome staining (N=4 each). I, Advanced glycosylation end products immunohistochemistry staining. (N=4 each). CMR indicates cardiac magnetic resonance; Ecc, circumferential strain rate; EDPVR, end‐diastolic pressure‐volume relationship; HFD, high‐fat diet; Sm, peak systolic motion of the myocardial segment; ns,not significant.
Figure 3 Echocardiography and hemodynamics in the HFD mice. A through D, Noninvasive transthoracic echocardiography. Tissue Doppler imaging and pulse‐wave Doppler measured mitral inflow from the apical four‐chamber view. A, E′/A′ ratio. B, E/E′ ratio. C, peak systolic velocity of the myocardial segment, Sm. D, Representative tissue Doppler images in control and HFD mice. *P<0.05. ***P<0.001 using an unpaired Student t test (N=6–10). E, Invasive hemodynamic measurement of multiple loops of EDPVR (N=5 in control, N=6 in the HFD group). F, Spearman correlation of CMR imaging strain rate, Ecc rate, and hemodynamics, EDPVR (N=8). G, Spearman correlation of CMR imaging strain rate, Ecc rate, and echocardiography, E′/A′ ratio (N=8). H, Trichrome staining (N=4 each). I, Advanced glycosylation end products immunohistochemistry staining. (N=4 each). CMR indicates cardiac magnetic resonance; Ecc, circumferential strain rate; EDPVR, end‐diastolic pressure‐volume relationship; HFD, high‐fat diet; Sm, peak systolic motion of the myocardial segment; ns,not significant.CC BY-NC · PubMed Central
Figure 4 MitoTEMPO effect on insulin resistance and diastolic function. A, Body weight. B, Glucose tolerance test. C, Serum glucose after 6 hours fasting. D, Serum insulin after 6 hours fasting. E, CMR strain rate. F, LV mass measured by CMR. G, Effect of pioglitazone on serum glucose 90 min after challenge. H, Pioglitazone effect on Ecc strain rate. (N=4 in control, N=9 in the HFD and mitoTEMPO groups). *P<0.05, **P<0.01, ***P<0.001. CMR indicates cardiac magnetic resonance; Ecc, circumferential strain rate; HFD, high‐fat diet; LV, left ventricular; MitoTEMPO, 2‐(2,2,6,6‐tetramethyl‐piperidin‐1‐oxyl‐4‐ylamino)‐2‐oxoethyl‐triphenylphosphonium chloride); ns, not significant.
Figure 4 MitoTEMPO effect on insulin resistance and diastolic function. A, Body weight. B, Glucose tolerance test. C, Serum glucose after 6 hours fasting. D, Serum insulin after 6 hours fasting. E, CMR strain rate. F, LV mass measured by CMR. G, Effect of pioglitazone on serum glucose 90 min after challenge. H, Pioglitazone effect on Ecc strain rate. (N=4 in control, N=9 in the HFD and mitoTEMPO groups). *P<0.05, **P<0.01, ***P<0.001. CMR indicates cardiac magnetic resonance; Ecc, circumferential strain rate; HFD, high‐fat diet; LV, left ventricular; MitoTEMPO, 2‐(2,2,6,6‐tetramethyl‐piperidin‐1‐oxyl‐4‐ylamino)‐2‐oxoethyl‐triphenylphosphonium chloride); ns, not significant.CC BY-NC · PubMed Central
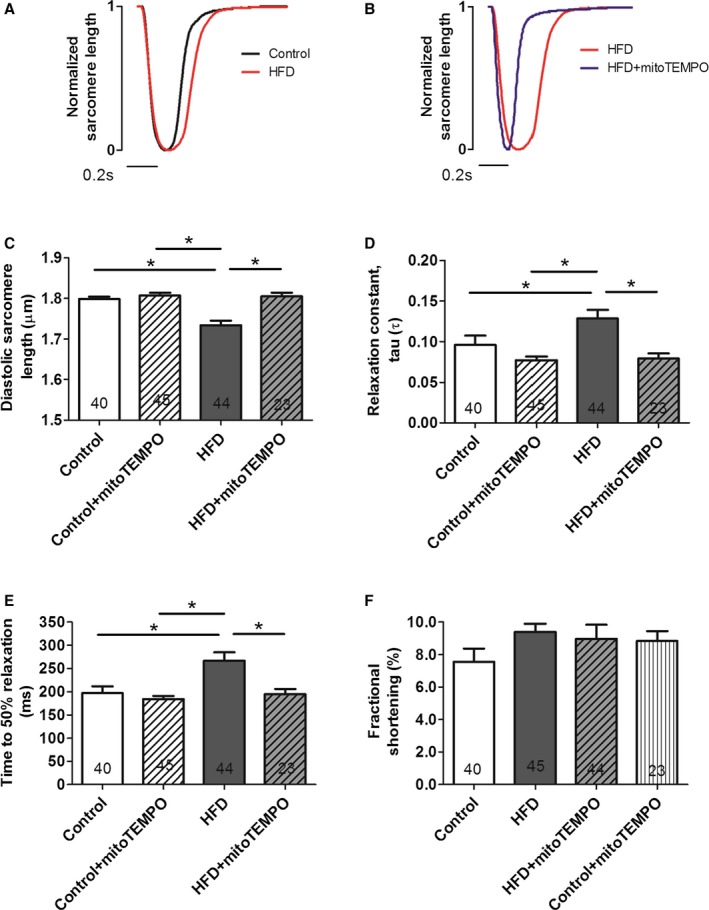
Figure 5 MitoTEMPO effects on relaxation in isolated cardiomyocytes. A and B, Representative normalized sarcomere contraction and relaxation traces in control (black) vs HFD mice (red) (A); HFD mice vs mitoTEMPO‐treated mice (blue) (B). Bar represents 0.2 seconds. C, Basal diastolic sarcomere length. D, Relaxation constant, τ. E, time to 50% relaxation. F, Fractional shortening. N=4 mice in control, N=6 mice in the HFD and mitoTEMPO groups. Five to 10 myocytes were studied from each mouse. Total cardiomyocytes are indicated in each bar graph. *P<0.05. HFD indicates high‐fat diet; MitoTEMPO, 2‐(2,2,6,6‐tetramethyl‐piperidin‐1‐oxyl‐4‐ylamino)‐2‐oxoethyl‐triphenylphosphonium chloride).
Figure 5 MitoTEMPO effects on relaxation in isolated cardiomyocytes. A and B, Representative normalized sarcomere contraction and relaxation traces in control (black) vs HFD mice (red) (A); HFD mice vs mitoTEMPO‐treated mice (blue) (B). Bar represents 0.2 seconds. C, Basal diastolic sarcomere length. D, Relaxation constant, τ. E, time to 50% relaxation. F, Fractional shortening. N=4 mice in control, N=6 mice in the HFD and mitoTEMPO groups. Five to 10 myocytes were studied from each mouse. Total cardiomyocytes are indicated in each bar graph. *P<0.05. HFD indicates high‐fat diet; MitoTEMPO, 2‐(2,2,6,6‐tetramethyl‐piperidin‐1‐oxyl‐4‐ylamino)‐2‐oxoethyl‐triphenylphosphonium chloride).CC BY-NC · PubMed Central
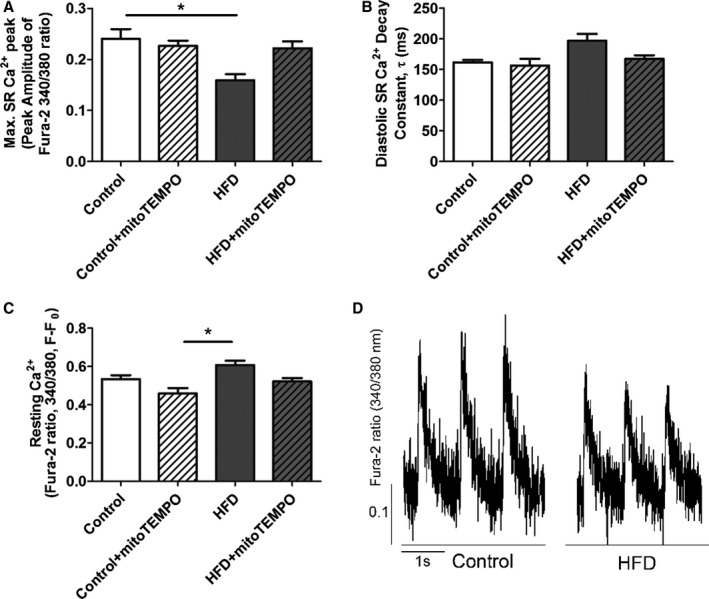
Figure 6 Ca2+ transient data from isolated cardiomyocytes. A, Amplitude of the Ca2+ transient. B, Diastolic Ca2+ decay constant τ (ms). C, Resting Ca2+ (F/F0) in each group. D, Representative Ca2+ transients from HFD and control myocytes. Isolated cardiomyocytes were loaded with Fura‐2AM and paced at 1.0 Hz. *P<0.05. N=18 to 21 cells in each group. N=4 mice in each group. HFD indicates high‐fat diet; SR, sarcoplasmic reticulum.
Figure 6 Ca2+ transient data from isolated cardiomyocytes. A, Amplitude of the Ca2+ transient. B, Diastolic Ca2+ decay constant τ (ms). C, Resting Ca2+ (F/F0) in each group. D, Representative Ca2+ transients from HFD and control myocytes. Isolated cardiomyocytes were loaded with Fura‐2AM and paced at 1.0 Hz. *P<0.05. N=18 to 21 cells in each group. N=4 mice in each group. HFD indicates high‐fat diet; SR, sarcoplasmic reticulum.CC BY-NC · PubMed Central
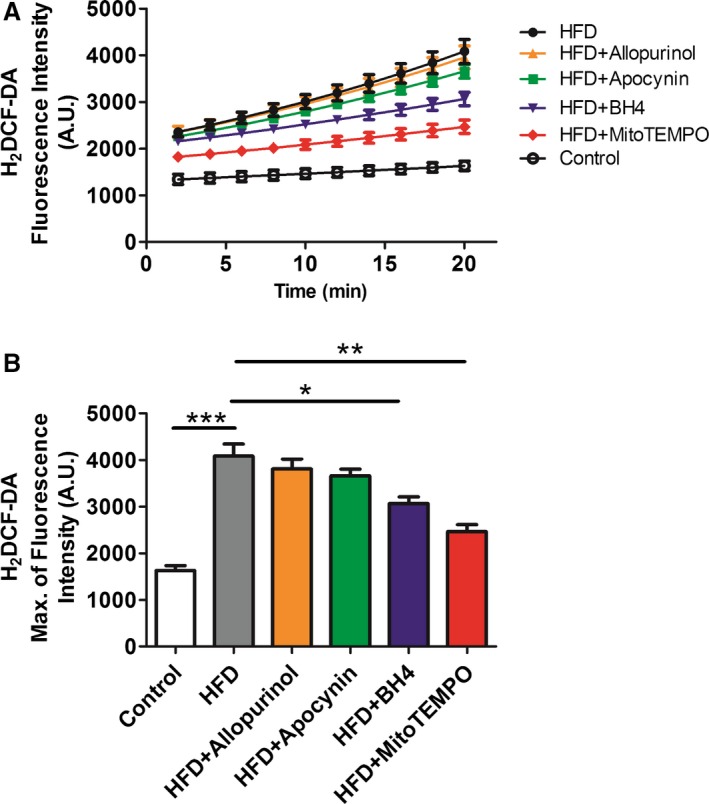
Figure 7 Cytoplasmic ROS measured by H2 DCF‐DA. A and B, Isolated cardiomyocytes from HFD and matched controls with or without in vivo treatment with mitoTEMPO, BH 4, apocynin, or allopurinol to inhibit mitochondrial, uncoupled nitric oxide synthase, NADPH oxidase, or xanthine oxidase‐dependent ROS. Data were represent as mean±SEM. *P<0.05,**P<0.01, ***P<0.001. N=5 for each treatment. DCF‐DA indicates 2',7'‐dichlorofluorescin diacetate; HFD, high‐fat diet; ROS, reactive oxygen species; MitoTEMPO, 2‐(2,2,6,6‐tetramethyl‐piperidin‐1‐oxyl‐4‐ylamino)‐2‐oxoethyl‐triphenylphosphonium chloride).
Figure 7 Cytoplasmic ROS measured by H2 DCF‐DA. A and B, Isolated cardiomyocytes from HFD and matched controls with or without in vivo treatment with mitoTEMPO, BH 4, apocynin, or allopurinol to inhibit mitochondrial, uncoupled nitric oxide synthase, NADPH oxidase, or xanthine oxidase‐dependent ROS. Data were represent as mean±SEM. *P<0.05,**P<0.01, ***P<0.001. N=5 for each treatment. DCF‐DA indicates 2',7'‐dichlorofluorescin diacetate; HFD, high‐fat diet; ROS, reactive oxygen species; MitoTEMPO, 2‐(2,2,6,6‐tetramethyl‐piperidin‐1‐oxyl‐4‐ylamino)‐2‐oxoethyl‐triphenylphosphonium chloride).CC BY-NC · PubMed Central
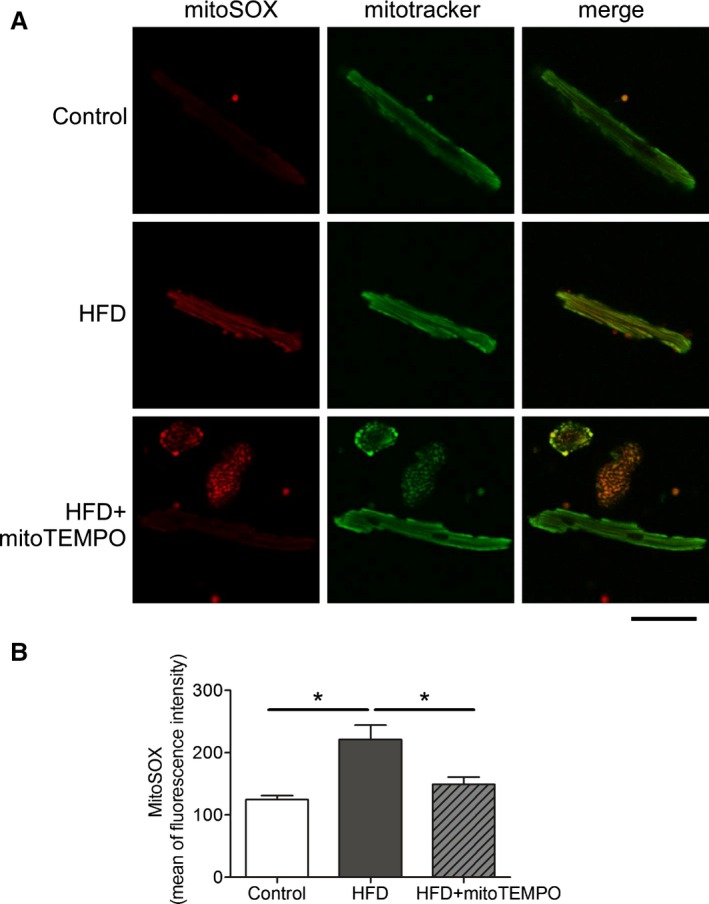
Figure 8 Mitochondrial ROS scavenged by mitoTEMPO. A, Confocal microscopy showing mitochondrial ROS. MitoSOX was used to probe for mitochondrial superoxide, and MitoTracker green was used to identify mitochondria. Bar represents 20 μm. B, Flow cytometry with mitoSOX staining. Mean of fluorescence intensity was recorded on the red channel. N=3 in control, N=4 in HFD and mitoTEMPO groups. *P<0.05. HFD indicates high‐fat diet; MitoTEMPO, 2‐(2,2,6,6‐tetramethyl‐piperidin‐1‐oxyl‐4‐ylamino)‐2‐oxoethyl‐triphenylphosphonium chloride); ROS, reactive oxygen species.
Figure 8 Mitochondrial ROS scavenged by mitoTEMPO. A, Confocal microscopy showing mitochondrial ROS. MitoSOX was used to probe for mitochondrial superoxide, and MitoTracker green was used to identify mitochondria. Bar represents 20 μm. B, Flow cytometry with mitoSOX staining. Mean of fluorescence intensity was recorded on the red channel. N=3 in control, N=4 in HFD and mitoTEMPO groups. *P<0.05. HFD indicates high‐fat diet; MitoTEMPO, 2‐(2,2,6,6‐tetramethyl‐piperidin‐1‐oxyl‐4‐ylamino)‐2‐oxoethyl‐triphenylphosphonium chloride); ROS, reactive oxygen species.CC BY-NC · PubMed Central
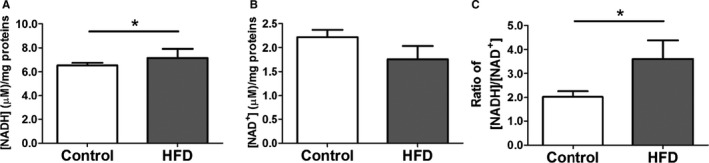
Figure 9 [NADH] and [NAD +] levels in HFD hearts. A, [NADH] level. B, [NAD +] level. C, ratio of [NADH]/[NAD +]. Data represent mean±SEM. *P<0.05. N=8 in each group. HFD indicates high‐fat diet.
Figure 9 [NADH] and [NAD +] levels in HFD hearts. A, [NADH] level. B, [NAD +] level. C, ratio of [NADH]/[NAD +]. Data represent mean±SEM. *P<0.05. N=8 in each group. HFD indicates high‐fat diet.CC BY-NC · PubMed Central
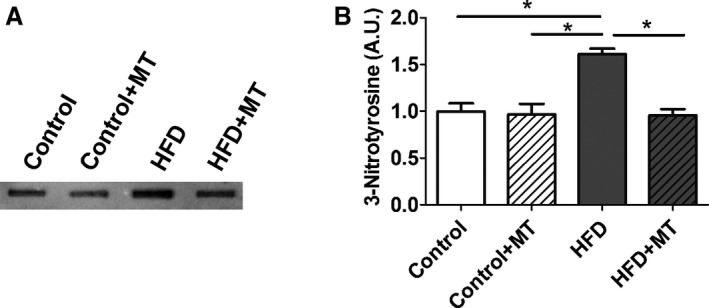
Figure 10 3‐Nitrotyrosine (3‐NT) level in HFD heart. A, Slot blots were performed using a 3‐ NT antibody. B, Representative densitometry analysis. Data represent mean±SEM. *P<0.05. N=6 in each group. HFD indicates high‐fat diet; MT, mitoTEMPO.
Figure 10 3‐Nitrotyrosine (3‐NT) level in HFD heart. A, Slot blots were performed using a 3‐ NT antibody. B, Representative densitometry analysis. Data represent mean±SEM. *P<0.05. N=6 in each group. HFD indicates high‐fat diet; MT, mitoTEMPO.CC BY-NC · PubMed Central
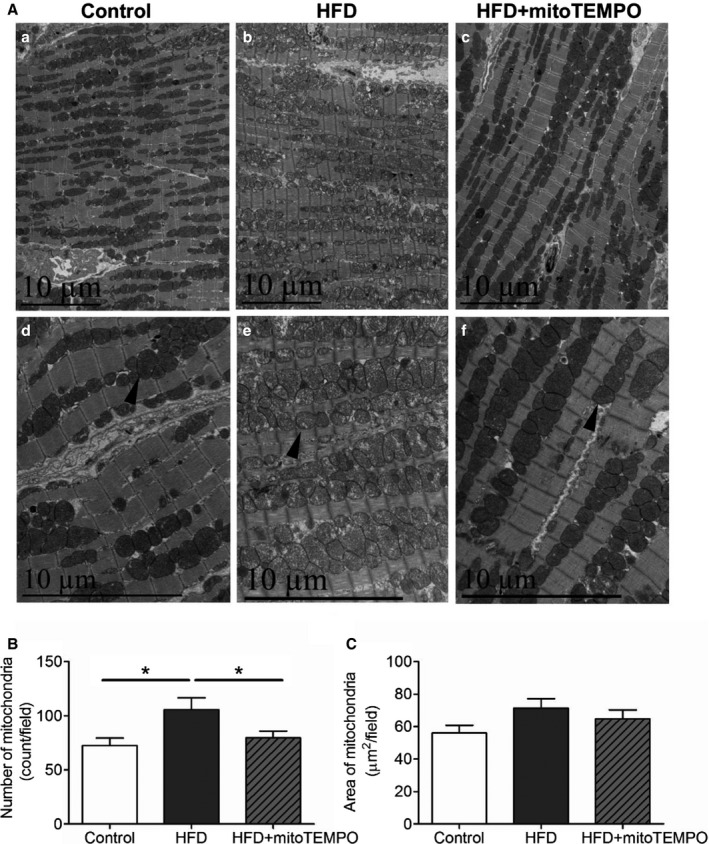
Figure 11 Electron microscopy of mitochondrial morphology with HFD. A, Transmission electron micrographs of hearts from control, HFD mice, and HFD mice treated with mitoTEMPO. a and d, control; b and e, HFD; c and f, mitoTEMPO‐treated HFD mice. a, b, and c, ×5780. d, e, and f, ×11 600 magnification. Arrowhead indicates typical mitochondria in each group. Bar indicates 10 μm. B, Averaged numbers of mitochondria in each field. C, Quantification of total mitochondrial areas in each field. N=3 to 5 in each group. *P<0.05. HFD indicates high‐fat diet; MitoTEMPO, 2‐(2,2,6,6‐tetramethyl‐piperidin‐1‐oxyl‐4‐ylamino)‐2‐oxoethyl‐triphenylphosphonium chloride).
Figure 11 Electron microscopy of mitochondrial morphology with HFD. A, Transmission electron micrographs of hearts from control, HFD mice, and HFD mice treated with mitoTEMPO. a and d, control; b and e, HFD; c and f, mitoTEMPO‐treated HFD mice. a, b, and c, ×5780. d, e, and f, ×11 600 magnification. Arrowhead indicates typical mitochondria in each group. Bar indicates 10 μm. B, Averaged numbers of mitochondria in each field. C, Quantification of total mitochondrial areas in each field. N=3 to 5 in each group. *P<0.05. HFD indicates high‐fat diet; MitoTEMPO, 2‐(2,2,6,6‐tetramethyl‐piperidin‐1‐oxyl‐4‐ylamino)‐2‐oxoethyl‐triphenylphosphonium chloride).CC BY-NC · PubMed Central
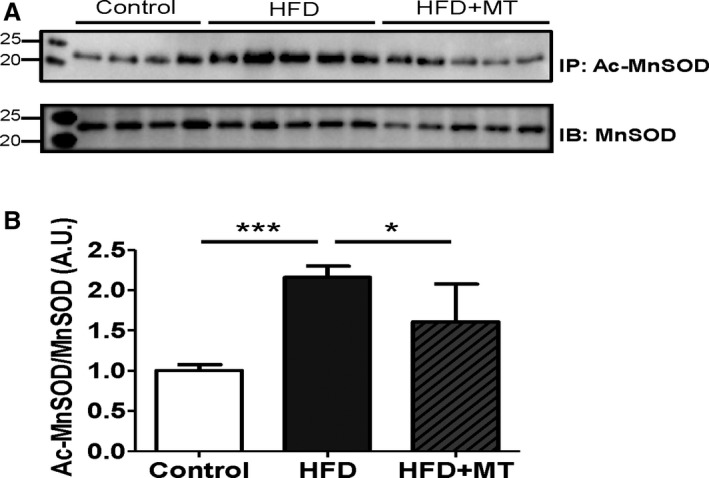
Figure 12 MnSOD and its acetylation in HFD heart. A, Immunoprecipitation (IP) was performed using a MnSOD antibody, and then immunoblotted (IB) with an acetylated‐lysine antibody. Acetylation of MnSOD was normalized by the total expression level of MnSOD. B, Densitometry was normalized by MnSOD. Data represent mean±SEM. *P<0.05, ***P<0.001. N=4 to 5. Ac‐MnSOD indicates acetylated manganese superoxide dismutase; HFD, high‐fat diet; MT, mitoTEMPO.
Figure 12 MnSOD and its acetylation in HFD heart. A, Immunoprecipitation (IP) was performed using a MnSOD antibody, and then immunoblotted (IB) with an acetylated‐lysine antibody. Acetylation of MnSOD was normalized by the total expression level of MnSOD. B, Densitometry was normalized by MnSOD. Data represent mean±SEM. *P<0.05, ***P<0.001. N=4 to 5. Ac‐MnSOD indicates acetylated manganese superoxide dismutase; HFD, high‐fat diet; MT, mitoTEMPO.CC BY-NC · PubMed Central
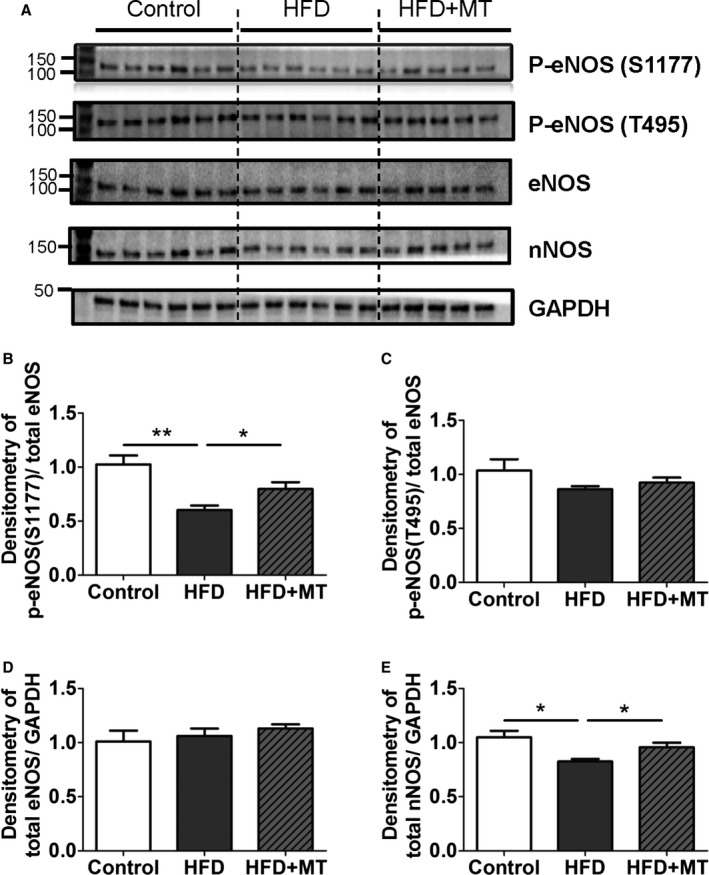
Figure 13 Changes in nitric oxide synthases (NOSs) with HFD. A, Immunoblot images shown as phospho‐eNOS (Ser1177), phospho‐eNOS (Thr495), total eNOS, total nNOS, and GAPDH. B and C, Densitometry data of stimulatory phospho‐eNOS (Ser1177) (B) and inhibitory phospho‐eNOS (Thr495) (C) were normalized by total eNOS, (D and E). Densitometry data of total eNOS (D) and total nNOS were normalized by GAPDH. Data represent mean±SEM. *P<0.05, **P<0.01. N=5 to 6. HFD indicates high‐fat diet; MT, mitoTEMPO.
Figure 13 Changes in nitric oxide synthases (NOSs) with HFD. A, Immunoblot images shown as phospho‐eNOS (Ser1177), phospho‐eNOS (Thr495), total eNOS, total nNOS, and GAPDH. B and C, Densitometry data of stimulatory phospho‐eNOS (Ser1177) (B) and inhibitory phospho‐eNOS (Thr495) (C) were normalized by total eNOS, (D and E). Densitometry data of total eNOS (D) and total nNOS were normalized by GAPDH. Data represent mean±SEM. *P<0.05, **P<0.01. N=5 to 6. HFD indicates high‐fat diet; MT, mitoTEMPO.CC BY-NC · PubMed Central
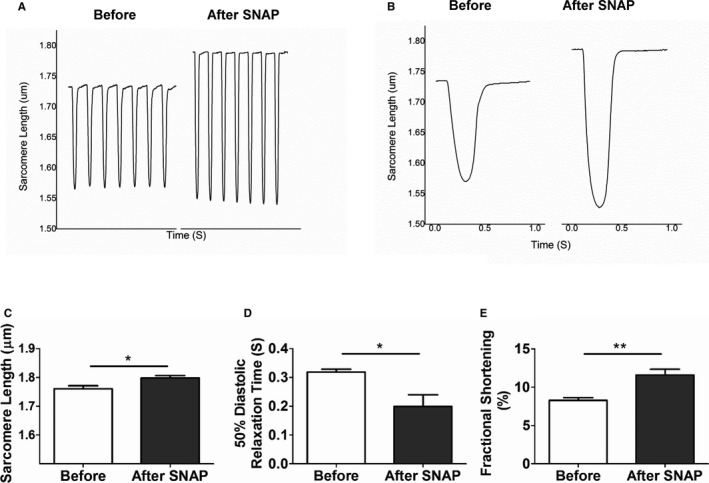
Figure 14 NO donor effect on diastolic impairment in HFD cardiomyocytes. Single isolated cardiomyocytes were treated with SNAP, an NO donor (1 mmol/L). A and B, Sarcomere length before and after treatment with SNAP are shown in (A) and averaged in (B). C, Resting sarcomere length; (D) 50% of diastolic relaxation time; and (E) fractional shortening as a function of SNAP. Data represent mean±SEM. *P<0.05, **P<0.01. N=8. HFD indicates high‐fat diet; SNAP, S‐Nitroso‐N‐Acetyl‐D,L‐Penicillamine.
Figure 14 NO donor effect on diastolic impairment in HFD cardiomyocytes. Single isolated cardiomyocytes were treated with SNAP, an NO donor (1 mmol/L). A and B, Sarcomere length before and after treatment with SNAP are shown in (A) and averaged in (B). C, Resting sarcomere length; (D) 50% of diastolic relaxation time; and (E) fractional shortening as a function of SNAP. Data represent mean±SEM. *P<0.05, **P<0.01. N=8. HFD indicates high‐fat diet; SNAP, S‐Nitroso‐N‐Acetyl‐D,L‐Penicillamine.CC BY-NC · PubMed Central
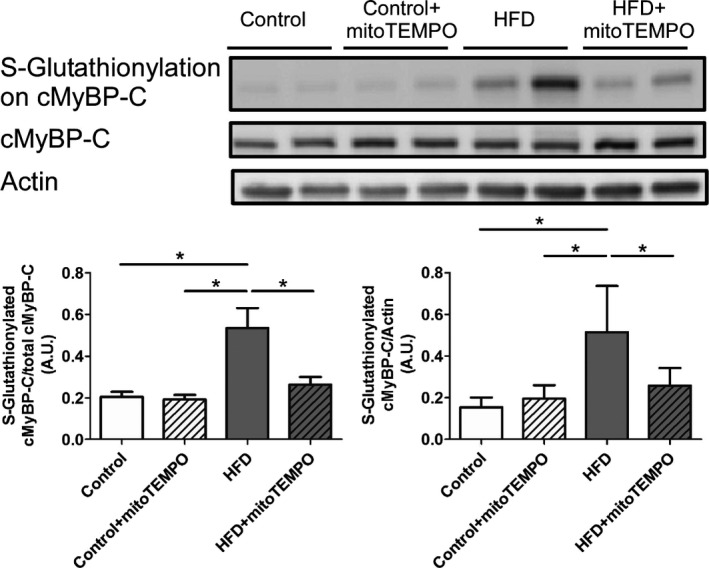
Figure 15 Immunoblotting for S‐glutathionylated cMyBP‐C. S‐Glutathionylation of cMyBP‐C in control, HFD, and HFD mice treated with mitoTEMPO. N=4 to 7 in each group. *P<0.05. cMyBP‐C indicates cardiac myosin binding protein‐C; HFD, high‐fat diet; MitoTEMPO, 2‐(2,2,6,6‐tetramethyl‐piperidin‐1‐oxyl‐4‐ylamino)‐2‐oxoethyl‐triphenylphosphonium chloride).
Figure 15 Immunoblotting for S‐glutathionylated cMyBP‐C. S‐Glutathionylation of cMyBP‐C in control, HFD, and HFD mice treated with mitoTEMPO. N=4 to 7 in each group. *P<0.05. cMyBP‐C indicates cardiac myosin binding protein‐C; HFD, high‐fat diet; MitoTEMPO, 2‐(2,2,6,6‐tetramethyl‐piperidin‐1‐oxyl‐4‐ylamino)‐2‐oxoethyl‐triphenylphosphonium chloride).CC BY-NC · PubMed Central

Verification

Claims the paper makes

The claims and statistics of this paper haven’t been checked yet.

Run the check — free, no account needed. It reads the open-access text and checks the sources it cites.

A few free checks a day · papers already verified open instantly · results are public

Claims other papers make about this one

Each is checked against this paper’s own text: does it say what the citing paper says it does?

Self-check

Percentages, sums and reported differences re-computed from the paper’s own numbers.

The self-check needs the paper’s full text.

Citations

Cites

Show all 36 references

Cited by

Sorted by citations

See all 119

Metadata

Authors
Jeong, E., Chung, J., Liu, H., Go, Y., Gladstein, S., Farzaneh‐Far, A., Lewandowski, E. D., & Dudley, S. C.
Affiliations
  • Brown University (US)
  • University of Illinois Chicago (US)
  • Rhode Island Hospital (US)
Corresponding author
  • Jeong, Euy‐Myoung
  • Chung, Jaehoon
  • Dudley, Samuel C.
Venue
Journal of the American Heart Association
Published
2016-05-06
Volume
5
Issue
5
ISSN
2047-9980 (ISSN-L)
OpenAlex
W2346053177
Cited by
119
References
36
Citations by year
2026: 8 · 2025: 9 · 2024: 11 · 2023: 17 · 2022: 11 · 2021: 12 · 2020: 11 · 2019: 11 · 2018: 12 · 2017: 15 · 2016: 2
FWCI
11.01
Type
journal article
Language
en
Open access
Licence
cc-by-nc
Locations
  • Journal of the American Heart Association (publishedVersion, cc-by-nc)
  • PubMed Central (publishedVersion, cc-by-nc)
  • PubMed (publishedVersion)
  • DOAJ (DOAJ: Directory of Open Access Journals) (submittedVersion)
Funders
National Heart, Lung, and Blood Institute (R01HL049244, R41HL112355, R01HL085520, R01HL106592, R01HL104025, R37HL049244, P01HL058000)
Topics
  • Health Sciences › Medicine › Cardiology and Cardiovascular Medicine › Cardiovascular Function and Risk Factors
  • Life Sciences › Biochemistry, Genetics and Molecular Biology › Molecular Biology › Mitochondrial Function and Pathology
  • Health Sciences › Medicine › Cardiology and Cardiovascular Medicine › Cardiac Ischemia and Reperfusion
Keywords
mitochondrial oxidative stress, glucose tolerance, insulin resistance, diastolic dysfunction, MitoTEMPO, mitochondria-targeted antioxidants, high-fat diet, diabetes mellitus, S-glutathionylation, myosin binding protein C, cardiac magnetic resonance imaging, diabetic cardiomyopathy
MeSH terms
Animals, Biomechanical Phenomena, Diabetes Mellitus, Experimental, Diabetes Mellitus, Type 2, Diastole, Disease Models, Animal, Glucose, Hemodynamics, Insulin Resistance, Magnetic Resonance Imaging, Mice, Inbred C57BL, Mitochondria, Heart, Cardiomyopathies, Myocardium, Reactive Oxygen Species, Glucose Intolerance, Oxidative Stress, Myocytes, Cardiac, Microscopy, Electron, Transmission, Mice, Heart Failure, Diastolic, Diet, High-Fat

About these checks

Registry, retraction, Cites and statistics results are computed, not judged, with one exception: a printed reference that no index lists is read once by a model before it counts as a citation error. Claims are extracted by a model and kept only when their quote appears verbatim in the text; each cited source is then checked, with a model’s help, for whether it says what the claim relies on. Those verdicts can be wrong — read the claim’s quote and the cited source before relying on one.

Statistics and arithmetic are recomputed, not judged.

Confidence bands are shown only for fields calibrated on our annotated test set. None is calibrated yet, so no band is shown.

What counts as a claim ›How we measure confidence ›How we check this ›

Are you an author, or do you see a problem with this page? Request a review