Cited by 44

The DOI matches its Crossref record; 2 of the 2 references it cites were found in a registry or an index.

Tollip Deficiency Alters Atherosclerosis and Steatosis by Disrupting Lipophagy

Chen, Keqiang, Yuan, Ruoxi, Zhang, Yao, Geng, Shuo, Li, Liwu·2017·Journal of the American Heart Association

Abstract

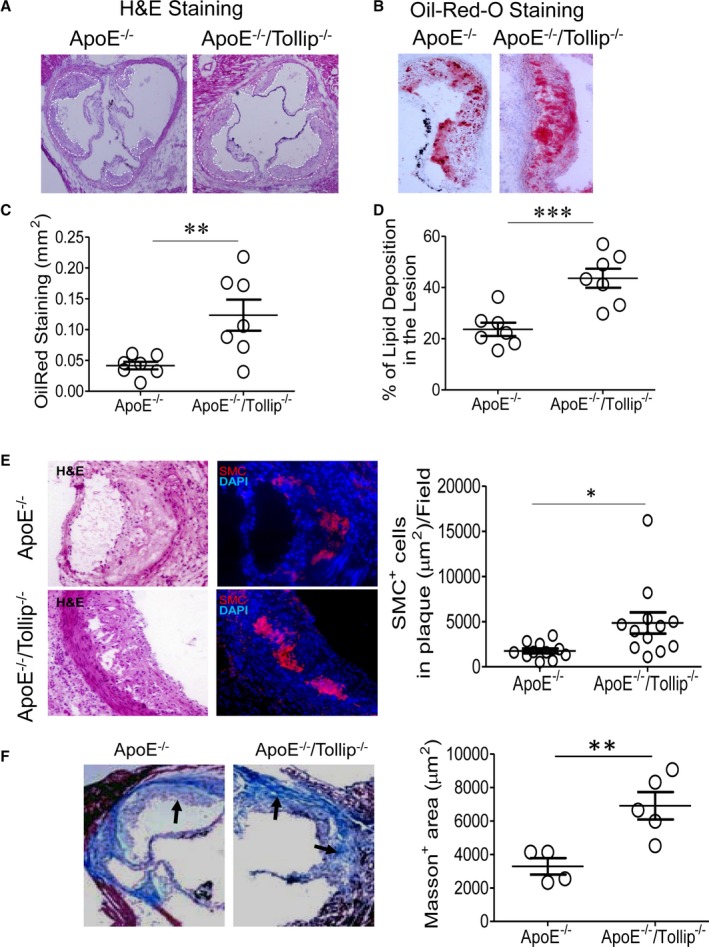
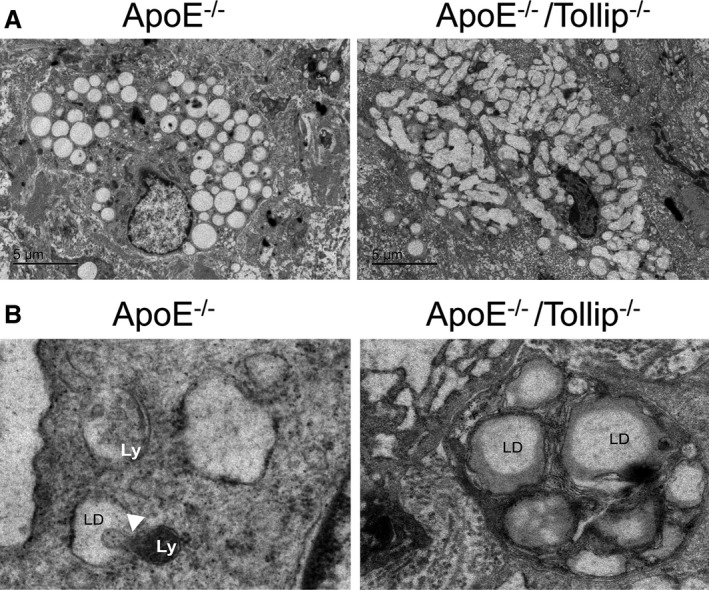
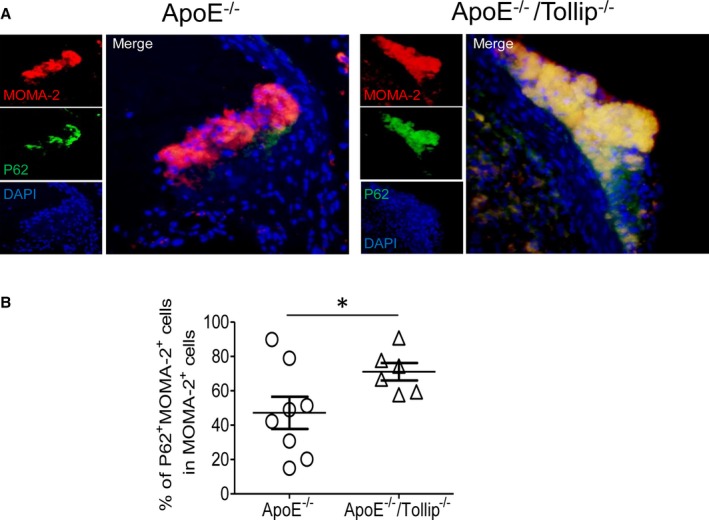
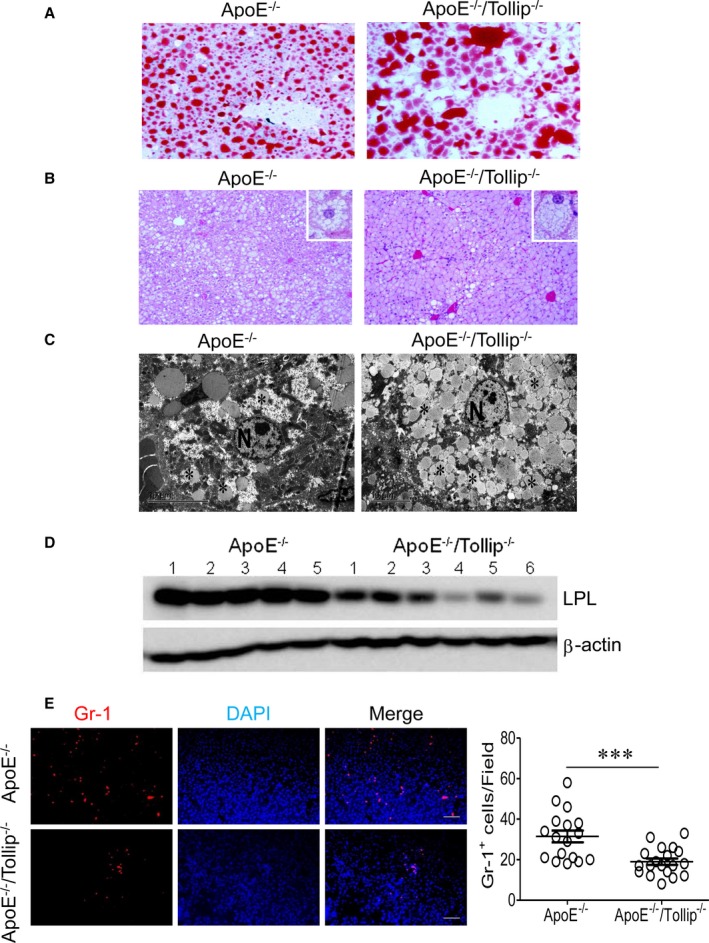
Background: Compromised lipophagy with unknown mechanisms may be critically involved in the intracellular accumulation of lipids, contributing to elevated atherosclerosis and liver steatosis. We hypothesize that toll‐interacting protein (Tollip), a key innate immune molecule involved in the fusion of autolysosome, may play a significant role in lipophagy and modulate lipid accumulation during the pathogenesis of atherosclerosis and liver steatosis. Methods and Results: By comparing mice fed with either a Western high‐fat diet or a regular chow diet, we observed that both atherosclerosis and liver steatosis were aggravated in apolipoprotein E–deficient (ApoE −/− )/Tollip −/− mice as compared with ApoE −/− mice. Through electron microscopy analyses, we observed compromised fusion of lipid droplets with lysosomes within aortic macrophages as well as liver hepatocytes from ApoE −/− /Tollip −/− mice as compared with ApoE −/− mice. As a molecular indicator for disrupted lysosome fusion, the levels of p62 were significantly elevated in aortic and liver tissues from ApoE −/− /Tollip −/− mice. Molecules involved in facilitating lipophagy completion such as Ras‐related protein 7 and gamma‐aminobutyric acid receptor‐associated protein were reduced in ApoE −/− /Tollip −/− mice as compared with ApoE −/− mice. Intriguingly, ApoE −/− /Tollip −/− mice had reduced circulating levels of inflammatory cytokines such as tumor necrosis factor‐α and increased levels of transforming growth factor‐β. The reduced inflammation due to Tollip deficiency is consistent with a stable atherosclerotic plaque phenotype with increased levels of plaque collagen and smooth muscle cells in ApoE −/− /Tollip −/− mice. Conclusions: Tollip deficiency selectively leads to enlarged yet stable atherosclerotic plaques, increased circulating lipids, liver steatosis, and reduced inflammation. Compromised lipophagy and reduced expression of inflammatory mediators due to Tollip deficiency may be the underlying causes. Our data suggest that lipid accumulation and inflammation may be intertwined yet independent processes during the progression of atherosclerosis and steatosis.

Overview

The claims and statistics of this paper haven’t been checked yet.

Run the check — free, no account needed. It reads the open-access text and checks the sources it cites.

A few free checks a day · papers already verified open instantly · results are public

Integrity signals

Registry

Crossref · 10.1161/jaha.116.004078

Cites

2 of 2 references verified0 citation errors · 0 not checkable

Statistics

Figures

Figure 1 Toll‐interacting protein (Tollip) deficiency promotes the development of stable atherosclerotic plaques. A and B, Apolipoprotein E–deficient (ApoE−/−) and ApoE−/−/Tollip−/− mice (male, 8 weeks old) were fed with a high‐fat diet for an additional 8 weeks. A, Representative hematoxylin and eosin (H&E) staining images within the aortic roots of ApoE−/− and ApoE−/−/Tollip−/− mice. B, Representative Oil‐Red‐O staining images within the aortic roots. C, Quantification of Oil‐Red‐O staining–positive area (mm2) of aortic roots. D, Relative ratios of Oil‐Red‐O–positive areas over total plaque areas. E, Representative smooth muscle cell (SMC) staining of aorta areas from ApoE−/− and ApoE−/−/Tollip−/− mice. F, Representative Masson staining of aorta areas from ApoE−/− and ApoE−/−/Tollip−/− mice. Error bars represent SEM. *P<0.05; **P<0.01; ***P<0.001. Mann–Whitney U test.
Figure 1 Toll‐interacting protein (Tollip) deficiency promotes the development of stable atherosclerotic plaques. A and B, Apolipoprotein E–deficient (ApoE−/−) and ApoE−/−/Tollip−/− mice (male, 8 weeks old) were fed with a high‐fat diet for an additional 8 weeks. A, Representative hematoxylin and eosin (H&E) staining images within the aortic roots of ApoE−/− and ApoE−/−/Tollip−/− mice. B, Representative Oil‐Red‐O staining images within the aortic roots. C, Quantification of Oil‐Red‐O staining–positive area (mm2) of aortic roots. D, Relative ratios of Oil‐Red‐O–positive areas over total plaque areas. E, Representative smooth muscle cell (SMC) staining of aorta areas from ApoE−/− and ApoE−/−/Tollip−/− mice. F, Representative Masson staining of aorta areas from ApoE−/− and ApoE−/−/Tollip−/− mice. Error bars represent SEM. *P<0.05; **P<0.01; ***P<0.001. Mann–Whitney U test.CC BY-NC-ND · PubMed Central
Figure 2 Toll‐interacting protein (Tollip) deficiency results in the disruption of lipophagy in aorta. Apolipoprotein E–deficient (ApoE−/−) and ApoE−/−/Tollip−/− mice (male, 8 weeks old) were fed with a high‐fat diet for an additional 8 weeks. A, Representative transmission electron microscopy (TEM) images of aortic sections from Apo−/− mice and ApoE−/−/Tollip−/− mice. B, Representative TEM images that demonstrate the lack of lysosome fusion with lipid droplets within aortic sections from ApoE−/−/Tollip−/− mice. LD indicates lipid droplet; Ly, lysosome.
Figure 2 Toll‐interacting protein (Tollip) deficiency results in the disruption of lipophagy in aorta. Apolipoprotein E–deficient (ApoE−/−) and ApoE−/−/Tollip−/− mice (male, 8 weeks old) were fed with a high‐fat diet for an additional 8 weeks. A, Representative transmission electron microscopy (TEM) images of aortic sections from Apo−/− mice and ApoE−/−/Tollip−/− mice. B, Representative TEM images that demonstrate the lack of lysosome fusion with lipid droplets within aortic sections from ApoE−/−/Tollip−/− mice. LD indicates lipid droplet; Ly, lysosome.CC BY-NC-ND · PubMed Central
Figure 3 Toll‐interacting protein (Tollip) deficiency results in compromised lysosome fusion within aorta. Apolipoprotein E–deficient (ApoE−/−) and ApoE−/−/Tollip−/− mice (male, 8 weeks old) were fed with a high‐fat diet for an additional 8 weeks. A, Representative images of p62 staining within plaque macrophages. B, Quantification of p62‐positive macrophages within aorta sections. Error bars represent SEM. *P<0.05. Mann–Whitney U test.
Figure 3 Toll‐interacting protein (Tollip) deficiency results in compromised lysosome fusion within aorta. Apolipoprotein E–deficient (ApoE−/−) and ApoE−/−/Tollip−/− mice (male, 8 weeks old) were fed with a high‐fat diet for an additional 8 weeks. A, Representative images of p62 staining within plaque macrophages. B, Quantification of p62‐positive macrophages within aorta sections. Error bars represent SEM. *P<0.05. Mann–Whitney U test.CC BY-NC-ND · PubMed Central
Figure 4 Toll‐interacting protein (Tollip) deficiency promotes liver steatosis. Apolipoprotein E–deficient (ApoE−/−) and ApoE−/−/Tollip−/− mice (male, 8 weeks old) were fed with a high‐fat diet for an additional 8 weeks. A, Representative Oil‐Red‐O staining images of liver sections. B, Representative hematoxylin and eosin staining images of liver sections. C, Representative transmission electron microscopy (TEM) images. D, Western blot analyses of liver lipoprotein lipase (LPL) protein levels. E, Immunohistochemical staining of neutrophils. Error bars represent SEM. ***P<0.001. Mann–Whitney U test.
Figure 4 Toll‐interacting protein (Tollip) deficiency promotes liver steatosis. Apolipoprotein E–deficient (ApoE−/−) and ApoE−/−/Tollip−/− mice (male, 8 weeks old) were fed with a high‐fat diet for an additional 8 weeks. A, Representative Oil‐Red‐O staining images of liver sections. B, Representative hematoxylin and eosin staining images of liver sections. C, Representative transmission electron microscopy (TEM) images. D, Western blot analyses of liver lipoprotein lipase (LPL) protein levels. E, Immunohistochemical staining of neutrophils. Error bars represent SEM. ***P<0.001. Mann–Whitney U test.CC BY-NC-ND · PubMed Central
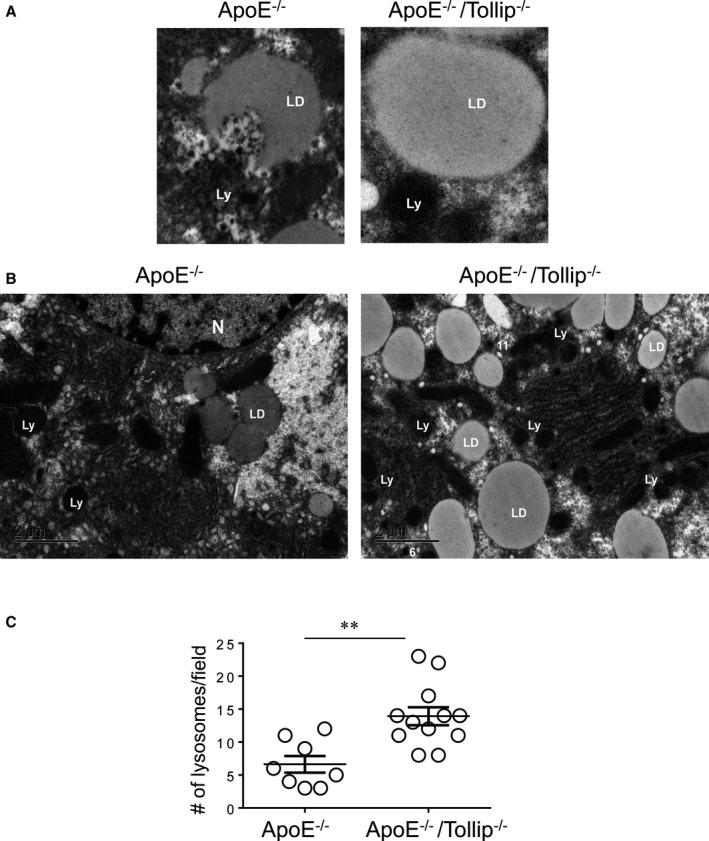
Figure 5 Toll‐interacting protein (Tollip) deficiency compromises liver lipophagy. Apolipoprotein E–deficient (ApoE−/−) and ApoE−/−/Tollip−/− mice (male, 8 weeks old) were fed with a high‐fat diet for an additional 8 weeks. A, Representative transmission electron microscopy (TEM) images of lipid droplets within liver hepatocytes. B, Representative TEM images of liver hepatocytes. C, The numbers of lysosomes within liver hepatocytes are quantified and shown in the graph. Error bars represent SEM. **P<0.01. Student t test. LD indicates lipid droplet; Ly, lysosome.
Figure 5 Toll‐interacting protein (Tollip) deficiency compromises liver lipophagy. Apolipoprotein E–deficient (ApoE−/−) and ApoE−/−/Tollip−/− mice (male, 8 weeks old) were fed with a high‐fat diet for an additional 8 weeks. A, Representative transmission electron microscopy (TEM) images of lipid droplets within liver hepatocytes. B, Representative TEM images of liver hepatocytes. C, The numbers of lysosomes within liver hepatocytes are quantified and shown in the graph. Error bars represent SEM. **P<0.01. Student t test. LD indicates lipid droplet; Ly, lysosome.CC BY-NC-ND · PubMed Central
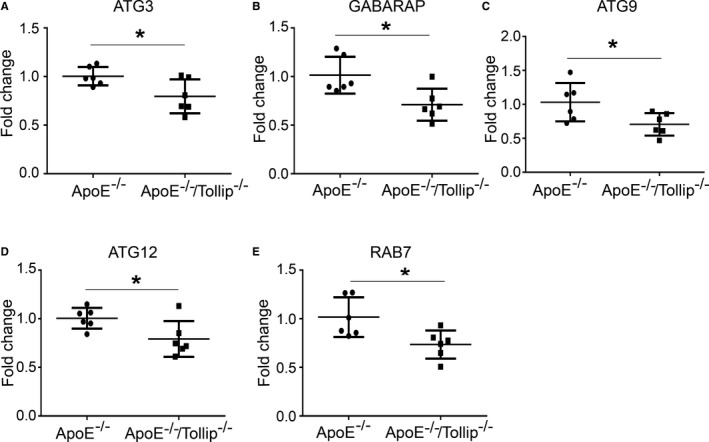
Figure 6 Toll‐interacting protein (Tollip) deficiency reduces the expression of key genes involved in lysosome fusion. Apolipoprotein E–deficient (ApoE−/−)and ApoE−/−/Tollip−/− mice (male, 8 weeks old) were fed with a high‐fat diet for additional 8 weeks. A through E, Real‐time reverse transcription polymerase chain reaction data are shown for liver tissue expression of (A) autophagocytosis‐associated protein 3 (ATG3), (B) gamma‐aminobutyric acid receptor‐associated protein (GABARAP), (C) autophagy‐related 9a (ATG9a), (D) autophagy‐related protein 12 (ATG12), and (E) Ras‐related protein 7 (RAB7). Error bars represent SEM. *P<0.05. Student t test.
Figure 6 Toll‐interacting protein (Tollip) deficiency reduces the expression of key genes involved in lysosome fusion. Apolipoprotein E–deficient (ApoE−/−)and ApoE−/−/Tollip−/− mice (male, 8 weeks old) were fed with a high‐fat diet for additional 8 weeks. A through E, Real‐time reverse transcription polymerase chain reaction data are shown for liver tissue expression of (A) autophagocytosis‐associated protein 3 (ATG3), (B) gamma‐aminobutyric acid receptor‐associated protein (GABARAP), (C) autophagy‐related 9a (ATG9a), (D) autophagy‐related protein 12 (ATG12), and (E) Ras‐related protein 7 (RAB7). Error bars represent SEM. *P<0.05. Student t test.CC BY-NC-ND · PubMed Central
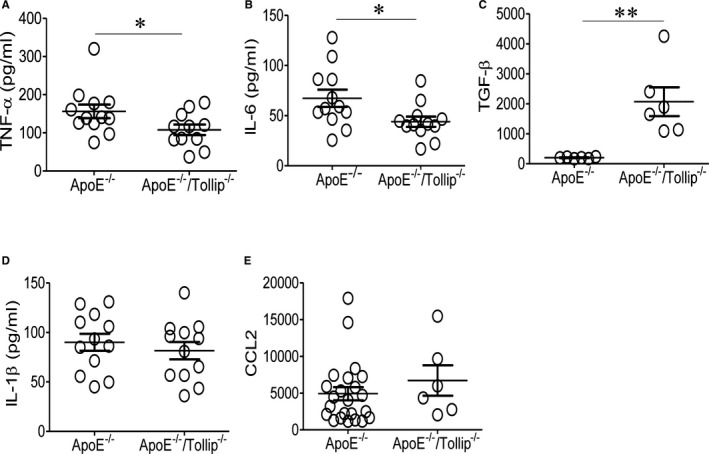
Figure 7 Toll‐interacting protein (Tollip) deficiency reduces the plasma levels of selected inflammatory cytokines. A through E, Apolipoprotein E–deficient (ApoE−/−) and ApoE−/−/Tollip−/− mice (male, 8 weeks old) were fed with a high‐fat diet for an additional 8 weeks. Plasma levels of (A) tumor necrosis factor‐α (TNF‐α), (B) interleukin (IL)–6, (C) transforming growth factor‐β (TGF‐β), (D) IL‐1β, and (E) C‐C motif chemokine ligand 2 (CCL2) were measured. Error bars represent SEM. *P<0.05; **P<0.01. Mann–Whitney U test.
Figure 7 Toll‐interacting protein (Tollip) deficiency reduces the plasma levels of selected inflammatory cytokines. A through E, Apolipoprotein E–deficient (ApoE−/−) and ApoE−/−/Tollip−/− mice (male, 8 weeks old) were fed with a high‐fat diet for an additional 8 weeks. Plasma levels of (A) tumor necrosis factor‐α (TNF‐α), (B) interleukin (IL)–6, (C) transforming growth factor‐β (TGF‐β), (D) IL‐1β, and (E) C‐C motif chemokine ligand 2 (CCL2) were measured. Error bars represent SEM. *P<0.05; **P<0.01. Mann–Whitney U test.CC BY-NC-ND · PubMed Central
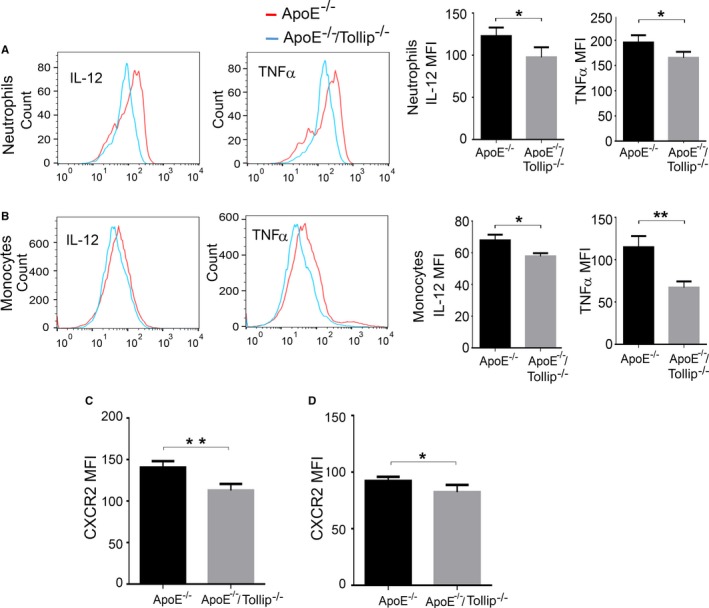
Figure 8 Toll‐interacting protein (Tollip) deficiency reduces the expression of inflammatory mediators from monocytes and neutrophils. Apolipoprotein E–deficient (ApoE−/−) and ApoE−/−/Tollip−/− mice (male, 8 weeks old) were fed with a high‐fat diet for an additional 8 weeks. Flow cytometry analyses of intracellular tumor necrosis factor‐α (TNF‐α) and interleukin (IL)–12 in splenic neutrophils (A) and monocytes (B). Flow analyses of C‐X‐C motif chemokine receptor 2 (CXCR2) levels on splenic (C) and bone marrow (D) neutrophils. Error bars represent SEM. N=4, *P<0.05, **P<0.01. Student t test.
Figure 8 Toll‐interacting protein (Tollip) deficiency reduces the expression of inflammatory mediators from monocytes and neutrophils. Apolipoprotein E–deficient (ApoE−/−) and ApoE−/−/Tollip−/− mice (male, 8 weeks old) were fed with a high‐fat diet for an additional 8 weeks. Flow cytometry analyses of intracellular tumor necrosis factor‐α (TNF‐α) and interleukin (IL)–12 in splenic neutrophils (A) and monocytes (B). Flow analyses of C‐X‐C motif chemokine receptor 2 (CXCR2) levels on splenic (C) and bone marrow (D) neutrophils. Error bars represent SEM. N=4, *P<0.05, **P<0.01. Student t test.CC BY-NC-ND · PubMed Central

Verification

Claims the paper makes

The claims and statistics of this paper haven’t been checked yet.

Run the check — free, no account needed. It reads the open-access text and checks the sources it cites.

A few free checks a day · papers already verified open instantly · results are public

Claims other papers make about this one

Each is checked against this paper’s own text: does it say what the citing paper says it does?

Self-check

Percentages, sums and reported differences re-computed from the paper’s own numbers.

The self-check needs the paper’s full text.

Citations

Cites

Show all 2 references

Research works printed but not linked: 22

  1. 10.1056/NEJM199711063371906 · DOI
  2. 10.1038/cdd.2012.63 · DOI · Paper page
  3. 10.1146/annurev-nutr-071813-105336 · DOI
  4. 10.1038/35014038 · DOI
  5. 10.1074/jbc.M400059200 · DOI
  6. 10.1074/jbc.M114.611442 · DOI · Paper page
  7. 10.1093/emboj/cdg140 · DOI
  8. 10.1074/jbc.M306740200 · DOI
  9. 10.1016/j.cell.2014.05.048 · DOI · Paper page
  10. 10.1074/jbc.M112.388009 · DOI
  11. 10.1189/jlb.0309189 · DOI
  12. 10.4049/jimmunol.1200857 · DOI
  13. 10.4049/jimmunol.0900124 · DOI
  14. 10.1093/hmg/ddr452 · DOI
  15. 10.2169/internalmedicine.55.5239 · DOI
  16. 10.1128/MCB.26.3.735-742.2006 · DOI
  17. 10.1016/j.molimm.2004.03.009 · DOI · Paper page
  18. 10.1038/ncomms13436 · DOI
  19. 10.2337/db09-0367 · DOI
  20. 10.1371/journal.pone.0097841 · DOI
  21. 10.1001/jama.2015.5370 · DOI
  22. 10.1111/j.1365-2559.2006.02416.x · DOI

Cited by

Sorted by citations

Metadata

Authors
Chen, K., Yuan, R., Zhang, Y., Geng, S., & Li, L.
Venue
Journal of the American Heart Association
Published
2017-04-05
Volume
6
Issue
4
ISSN
2047-9980
Cited by
44
References
2
Language
en

About these checks

Registry, retraction, Cites and statistics results are computed, not judged, with one exception: a printed reference that no index lists is read once by a model before it counts as a citation error. Claims are extracted by a model and kept only when their quote appears verbatim in the text; each cited source is then checked, with a model’s help, for whether it says what the claim relies on. Those verdicts can be wrong — read the claim’s quote and the cited source before relying on one.

Statistics and arithmetic are recomputed, not judged.

Confidence bands are shown only for fields calibrated on our annotated test set. None is calibrated yet, so no band is shown.

What counts as a claim ›How we measure confidence ›How we check this ›

Are you an author, or do you see a problem with this page? Request a review