

The DOI matches its Crossref record; 54 of the 54 references it cites were found in a registry or an index.
Conducting Meta-Analyses Based on p Values: Reservations and Recommendations for Applying p -Uniform and p -Curve
Open accessAbstract
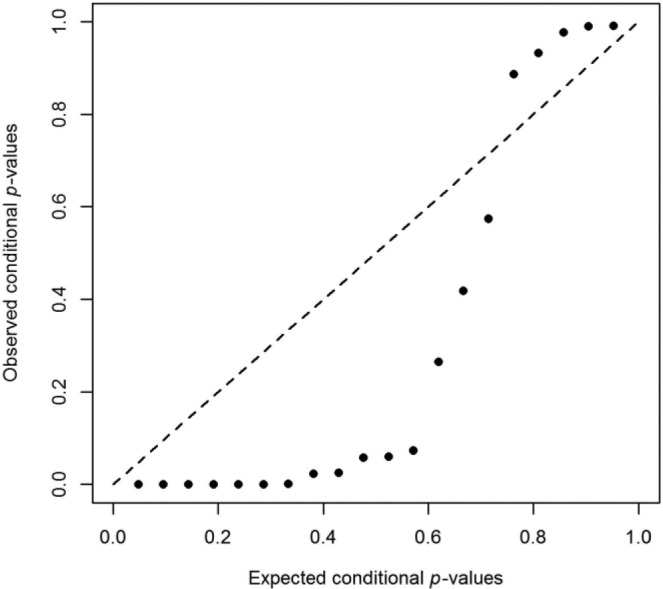
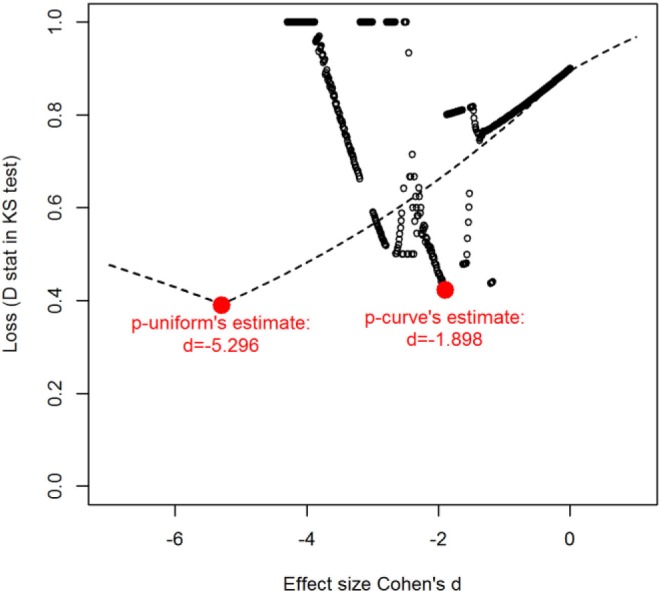
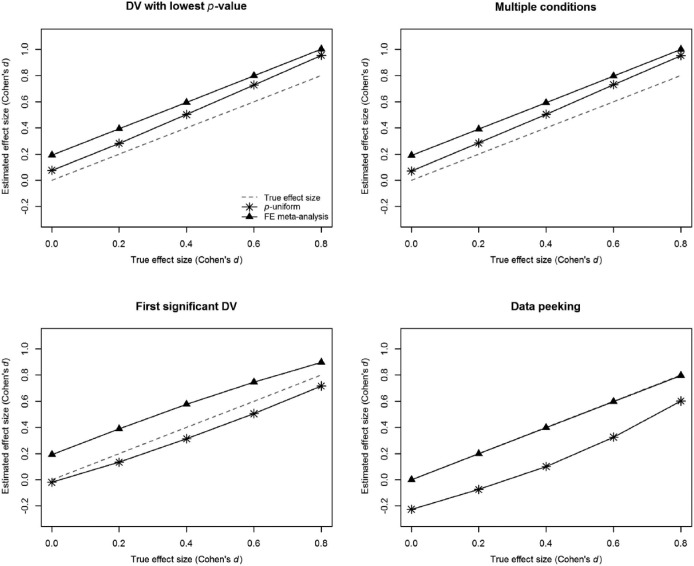
Because of overwhelming evidence of publication bias in psychology, techniques to correct meta-analytic estimates for such bias are greatly needed. The methodology on which the p-uniform and p-curve methods are based has great promise for providing accurate meta-analytic estimates in the presence of publication bias. However, in this article, we show that in some situations, p-curve behaves erratically, whereas p-uniform may yield implausible estimates of negative effect size. Moreover, we show that (and explain why) p-curve and p-uniform result in overestimation of effect size under moderate-to-large heterogeneity and may yield unpredictable bias when researchers employ p-hacking. We offer hands-on recommendations on applying and interpreting results of meta-analyses in general and p-uniform and p-curve in particular. Both methods as well as traditional methods are applied to a meta-analysis on the effect of weight on judgments of importance. We offer guidance for applying p-uniform or p-curve using R and a user-friendly web application for applying p-uniform.
Overview
The claims and statistics of this paper haven’t been checked yet.
Run the check — free, no account needed. It reads the open-access text and checks the sources it cites.
Integrity signals
Registry
Cites
Statistics
Figures
Verification
Claims the paper makes
The claims and statistics of this paper haven’t been checked yet.
Run the check — free, no account needed. It reads the open-access text and checks the sources it cites.
Claims other papers make about this one
Each is checked against this paper’s own text: does it say what the citing paper says it does?
The cited source doesn’t support the claim as written.
In the citing paper
“With a moderate ( < 50%) level of heterogeneity in included comparisons ( I 2 = 42.01%), we expect these estimates to be robust (van Aert etal., 2016).”
From When Problem Solving Followed by Instruction Works: Evidence for Productive Failure (2021) · cites this paper as van Aert et al., 2016
Checked by a reasoning model — may be wrong.
Experimental — accuracy not yet measured
Self-check
Percentages, sums and reported differences re-computed from the paper’s own numbers.
The self-check needs the paper’s full text.
Citations
Cites
R: A Language and Environment for Statistical Computing
R Core Team (2000) · doi:10.32614/r.manuals · Cited by 355,893
Quantifying heterogeneity in a meta‐analysis
Higgins, J. P. T., & Thompson, S. G. (2002) · Statistics in Medicine · doi:10.1002/sim.1186 · Cited by 36,763
Borenstein, M., Hedges, L. V., Higgins, J. P. T., & Rothstein, H. R. (2009) · doi:10.1002/9780470743386 · Cited by 14,225
Statistical Methods for Research Workers
Fisher, R. A. (1945) · American Journal of Clinical Pathology · doi:10.1093/ajcp/15.11.552b · Cited by 10,883
Simmons, J. P., Nelson, L. D., & Simonsohn, U. (2011) · Psychological Science · doi:10.1177/0956797611417632 · Cited by 6,567
The Handbook of Research Synthesis and Meta-Analysis
(2019) · doi:10.7758/9781610448864 · Cited by 4,553
Measuring the Prevalence of Questionable Research Practices With Incentives for Truth Telling
John, L. K., Loewenstein, G., & Prelec, D. (2012) · Psychological Science · doi:10.1177/0956797611430953 · Cited by 2,239
Statistical Methods for Research Workers.
I., L., & Fisher, R. A. (1926) · Journal Of The Royal Statistical Society · doi:10.2307/2341488 · Cited by 2,171
P-curve: A key to the file-drawer.
Simonsohn, U., Nelson, L. D., & Simmons, J. P. (2014) · Journal of Experimental Psychology: General · doi:10.1037/a0033242 · Cited by 1,500
Why Most Discovered True Associations Are Inflated
Ioannidis, J. P. A. (2008) · Epidemiology · doi:10.1097/ede.0b013e31818131e7 · Cited by 1,495
Research works printed but not linked: 4
- American Psychological Association, 2010, Publication manual
- Augusteijn H. E. M. (2015). The effect of publication bias on the Q test and assessment of heterogeneity (Unpublished master’s thesis). Tilburg University, Tilburg, the Netherlands.
- Raudenbush S. W., 2009, The handbook of research synthesis and meta-analysis, 295
- van Aert R. C. M., 2016, Estimating effect size in meta-analysis in the presence of publication bias and questionable research practices
Cited by
Sorted by citations
Sisk, V. F., Burgoyne, A. P., Sun, J., Butler, J. L., & Macnamara, B. N. (2018) · Psychological Science · doi:10.1177/0956797617739704 · Cited by 1,159
Effect Size Guidelines, Sample Size Calculations, and Statistical Power in Gerontology
Brydges, C. R. (2019) · Innovation in Aging · doi:10.1093/geroni/igz036 · Cited by 826
O’Dea, R. E., Lagisz, M., Jennions, M. D., Koricheva, J., Noble, D. W. A., Parker, T. H., Gurevitch, J., Page, M. J., Stewart, G. B., Moher, D., et al. (2021) · Biological reviews/Biological reviews of the Cambridge Philosophical Society · doi:10.1111/brv.12721 · Cited by 825
Wicherts, J. M., Veldkamp, C. L. S., Augusteijn, H. E. M., Bakker, M., van Aert, R. C. M., & van Assen, M. A. L. M. (2016) · Frontiers in Psychology · doi:10.3389/fpsyg.2016.01832 · Cited by 754
Self-citationCorrecting for Bias in Psychology: A Comparison of Meta-Analytic Methods
Carter, E. C., Schönbrodt, F. D., Gervais, W. M., & Hilgard, J. (2019) · Advances in Methods and Practices in Psychological Science · doi:10.1177/2515245919847196 · Cited by 588
Metadata
- Authors
- van Aert, R. C. M., Wicherts, J. M., & van Assen, M. A. L. M.
- Affiliations
- Tilburg University (NL)
- Utrecht University (NL)
- Corresponding author
- van Aert, Robbie C. M.
- Venue
- Perspectives on Psychological Science
- Publisher
- SAGE Publications
- Published
- 2016-09
- Volume
- 11
- Issue
- 5
- Pages
- 713-729
- ISSN
- 1745-6916 (ISSN-L)
- 1745-6924
- PMC
- PMC5117126
- OpenAlex
- W2526603989
- Cited by
- 219
- References
- 54
- Citations by year
- 2026: 12 · 2025: 13 · 2024: 24 · 2023: 22 · 2022: 28 · 2021: 22 · 2020: 25 · 2019: 23 · 2018: 20 · 2017: 27 · 2016: 3
- FWCI
- 22.73
- Type
- journal article
- Language
- en
- Open access
- hybrid
- doi.org
- Locations
- Perspectives on Psychological Science (publishedVersion, cc-by)
- PubMed Central (publishedVersion, cc-by)
- Research portal (Tilburg University) (publishedVersion, cc-by)
- PubMed (publishedVersion)
- Data Archiving and Networked Services (DANS) (submittedVersion, other-oa)
- Utrecht University Repository (Utrecht University) (submittedVersion, other-oa)
- OSF Preprints (OSF Preprints) (submittedVersion)
- Topics
- Social Sciences › Decision Sciences › Statistics, Probability and Uncertainty › Meta-analysis and systematic reviews
- Social Sciences › Psychology › Experimental and Cognitive Psychology › Psychology Research and Bibliometrics
- Social Sciences › Library and Information Sciences › scientometrics and bibliometrics research
- Keywords
- p-curve, publication bias, meta-analysis, effect size estimation, p-hacking, heterogeneity, effect size overestimation, R package, web application
- MeSH terms
- Data Interpretation, Statistical, Humans, Psychology, Software, Meta-Analysis as Topic, Models, Statistical, Publication Bias, Internet
About these checks
Registry, retraction, Cites and statistics results are computed, not judged, with one exception: a printed reference that no index lists is read once by a model before it counts as a citation error. Claims are extracted by a model and kept only when their quote appears verbatim in the text; each cited source is then checked, with a model’s help, for whether it says what the claim relies on. Those verdicts can be wrong — read the claim’s quote and the cited source before relying on one.
Statistics and arithmetic are recomputed, not judged.
Confidence bands are shown only for fields calibrated on our annotated test set. None is calibrated yet, so no band is shown.
What counts as a claim ›How we measure confidence ›How we check this ›
Are you an author, or do you see a problem with this page? Request a review
