

When Problem Solving Followed by Instruction Works: Evidence for Productive Failure
Open accessThe DOI matches its Crossref record; 80 of the 80 references it cites were found in a registry or an index; 8 of the 35 sources its claims cite were checked for support.
Abstract
When learning a new concept, should students engage in problem solving followed by instruction (PS-I) or instruction followed by problem solving (I-PS)? Noting that there is a passionate debate about the design of initial learning, we report evidence from a meta-analysis of 53 studies with 166 comparisons that compared PS-I with I-PS design. Our results showed a significant, moderate effect in favor of PS-I (Hedge’s g 0.36 [95% confidence interval 0.20; 0.51]). The effects were even stronger (Hedge’s g ranging between 0.37 and 0.58) when PS-I was implemented with high fidelity to the principles of Productive Failure (PF), a subset variant of PS-I design. Students’ grade level, intervention time span, and its (quasi-)experimental nature contributed to the efficacy of PS-I over I-PS designs. Contrasting trends were, however, observed for younger age learners (second to fifth graders) and for the learning of domain-general skills, for which effect sizes favored I-PS. Overall, an estimation of true effect sizes after accounting for publication bias suggested a strong effect size favoring PS-I (Hedge’s g 0.87).
Overview
CoChat Summary
TL;DR
This meta-analysis of 53 studies with 166 comparisons found that problem solving followed by instruction (PS-I) produced a significant, moderate advantage over instruction followed by problem solving (I-PS) for conceptual knowledge and transfer (Hedge’s g = 0.36). Effects were stronger when PS-I was implemented with high fidelity to Productive Failure principles, and after accounting for publication bias the estimated true effect was Hedge’s g = 0.87.
Key findings
- Overall, PS-I outperformed I-PS for conceptual knowledge and transfer: Hedge’s g = 0.36, 95% CI [0.20, 0.51], p < .0001. For procedural knowledge, the effect was nonsignificant: Hedge’s g = −0.03, 95% CI [−0.20, 0.15].
- Higher fidelity to Productive Failure (PF) design criteria was associated with larger effects favoring PS-I; the overall PF fidelity score significantly predicted effect size (β = 0.0065, p < .001, 95% CI [0.0044, 0.0087]). Effects ranged between Hedge’s g = 0.37 and 0.58 when PS-I was implemented with high PF fidelity.
- Subgroup differences: younger learners (2nd–5th graders) showed an effect favoring I-PS (Hedge’s g = −0.09, 95% CI [−0.92, −0.16]), and domain-general skills also favored I-PS (Hedge’s g = −0.17, 95% CI [−1.11, −0.02]). Quasi-experimental comparisons (g = 0.46) and interventions spanning a few days (g = 0.41) descriptively favored PS-I more than experimental comparisons and shorter interventions, though these subgroup differences were not significant.
- Publication-bias checks: funnel plot and Egger’s test were not significant (intercept = 0.63, p = .219), but p-curve analysis indicated evidential value and estimated a true effect size of Hedge’s g = 0.87 favoring PS-I; heterogeneity was moderate (I² = 42.01%).
Methods
- Meta-analysis of 53 studies comprising 166 experimental comparisons that compared PS-I with I-PS; inclusion required experimental or quasi-experimental comparison and assessment of conceptual knowledge or transfer, with procedural knowledge optional.
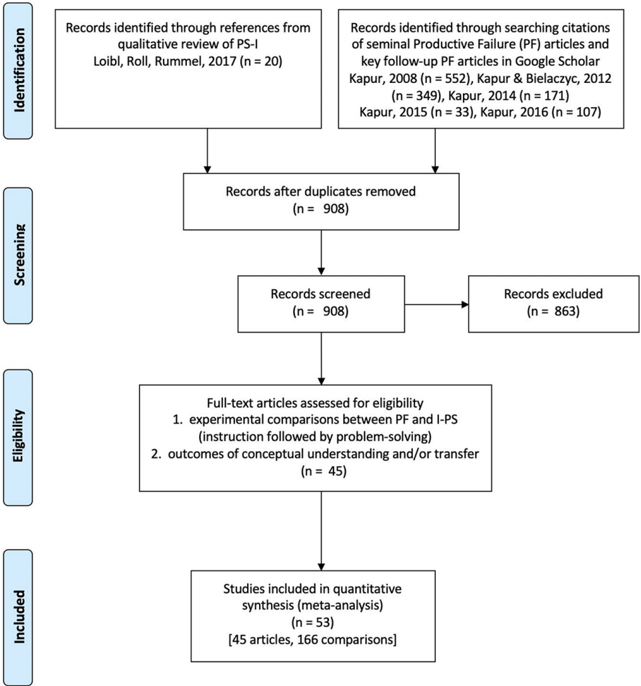
- Searches used Google Scholar citations to seminal PF articles and key follow-up PF articles; 45 articles met criteria after screening and duplicate removal.
- Pooled effect sizes used a three-level multilevel meta-analysis model (participants nested within studies, studies nested within articles), Hedge’s g with 95% CIs, Cochran’s Q, and I². Subgroup and meta-regression analyses examined seven PF fidelity criteria, student characteristics, and intervention characteristics; publication bias was assessed with funnel plots, Egger’s test, trim-and-fill, and p-curve analysis.
Limitations
- The paper states that nearly 75% of included comparisons targeted math and physics, with skewed subtopics; more studies are needed in other STEM and non-STEM domains and with postgraduates/professionals before generalizing.
- The paper states that individual differences were not available, few studies reported actual failure rates, multiple RSM generation is a weak proxy for failure, and only one study explicitly assessed negative knowledge. It also notes that PF fidelity criteria and other characteristics were dichotomized, and that experimental versus quasi-experimental designs may not be directly comparable because learning objectives can differ.
- The paper states that the identified list of influencing factors is important but not exhaustive, and that the current meta-analysis lacks studies involving students with learning disabilities or difficulties.
Model-written summary. Check it against the paper before relying on it.
Integrity signals
Registry
Cites
Statistics
Figures




Verification
Claims the paper makes
7 Valid · 4 Not valid · 21 Not checked · 106 Own results and interpretations
At least one cited source doesn’t support this claim or points to a different paper, and none confirmed it — see the verdicts below.
In the paper
“With a moderate ( < 50%) level of heterogeneity in included comparisons ( I 2 = 42.01%), we expect these estimates to be robust (van Aert etal., 2016).”
What the sources say
- Disputedcites van Aert et al., 2016 sourceExperimental — accuracy not yet measured
In the section “If Heterogeneity Is Moderate to Large, p-Curve and p-Uniform Overestimate Effect Size” (page unavailable), the paper reports that effect-size estimates are biased at its moderate-heterogeneity condition (I² ≈ 0.5). It does not assess I² = 42.01%, so that exact threshold is not tested; its finding does not support the cited expectation that moderate heterogeneity makes the estimates robust. (LLM, conf=0.84)
Checked by a reasoning model — may be wrong.
hedgedstates an association- Asserted: passes — The authors put it forward as true.
- Checkable: passes — It can be checked against evidence.
- Load-bearing: passes — The paper’s conclusions depend on it.
- Based: passes — The paper gives a reason why it holds.
- Disputed
The cited sources support only part of this claim — read each source’s verdict below.
In the paper
“Research on goal specificity (e.g., Miller etal., 1999; Vollmeyer etal., 1996), mechanisms of errorful generation (Cyr & Anderson, 2015), as well as prior PS-I work (e.g., Kapur, 2015; Schwartz etal., 2011) has suggested that the benefits of prior knowledge activation such as noticing inconsistencies across multiple problem instances, encoding critical features from instruction, and so on, are”
- Also stated in: § Students' Incoming Characteristics We found that effects favoring PS-I over I-PS were higher if students belonged to a higher grade level. Younger age students (2nd to 5th graders), however, seemed to benefit from I-PS interventions, although the average effect size favoring I-PS was low (Hedge's g of -0.09 [95% CI -0.92, -0.16]. This is despite 72% ( n = 18/25) of the comparisons involving 2nd to 5th graders providing evidence for high prior knowledge activation (reflected in the PF fidelity criteria of evidence for multiple RSM generation ). However, the extent to which the activated prior knowledge is relevant for learning the targeted concepts can substantially affect students' performance. Research on goal specificity (e.g., Miller etal., 1999; Vollmeyer etal., 1996), mechanisms of errorful generation (Cyr & Anderson, 2015), as well as prior PS-I work (e.g., Kapur, 2015; Schwartz etal., 2011) has suggested that the benefits of prior knowledge activation such as noticing inconsistencies across multiple problem instances, encoding critical features from instruction, and so on, are contingent on the relevance of the activation. One explanation for the negative effect sizes disfavoring PS-I for young learners might therefore be the low relevance (albeit, high activation ) of prior knowledge. Factors stemming from students' unawareness of productive metacognitive learning strategies (e.g., planning and monitoring solution generation efficacy, self-explaining, debugging, and error-evaluation) might alternatively contribute to this contrasting trend. Finally, across the comparisons involving 2nd to 5th graders, the low overall PF fidelity score ( M = 56.86%, SD = 27.84%) might also be responsible for negative effects for PS-I. For these younger students then, scaffolding the initial problem-solving phase of PS-I to compensate for their insufficient prior knowledge about cognitive and metacognitive learning strategies might be critical. Richland and Simms (2015), more generally, have documented the importance of scaffolding exploratory problem solving through a series of studies on induction within (non-) STEM domains. They emphasize explicit support in noticing the relevance of relational thinking, providing adequate processing resources to mentally hold and manipulate relations, and facilitating recognition of both similarities and differences when drawing analogies. We further found that comparisons where students were pretested on concepts targeted in the intervention showed a higher effect size favoring PS-I (Hedge's g 0.39 [95% CI -0.26, 0.42]), relative to interventions where no pretest was held (Hedge's g 0.31 [95% CI -0.44, 0.30]), or the pretest targeted only prerequisite concepts (Hedge's g 0.30 [95% CI -0.63, 0.50]). Therefore, including a pretest targeting similar learning materials as the PS-I intervention itself may serve to enhance the differential advantages over I-PS (see Yang etal., 2018, for the facilitatory effects of forward testing), instead of diminishing PS-I's effectiveness due to potential overlap with the triggered learning mechanisms (Newman & DeCaro, 2019). · plain
“contingent on the relevance of the activation.”
What the sources say
- Partly supportedcites Miller et al., 1999 sourceExperimental — accuracy not yet measured
In “Implications for Learning Theory: Knowledge Dependencies” (page unavailable), the paper says that learning transfers when goal-dependent relationships coincide with pedagogically relevant relationships. This supports the importance of relevance, but the passage concerns knowledge acquired through microworld interaction, not the benefits of activating prior knowledge or the stated examples of noticing inconsistencies and encoding features from instruction. (LLM, conf=0.82)
- Not checked — no full text of the sourcecites Vollmeyer et al., 1996 source
- Not matchedcites Cyr & Anderson, 2015
Couldn’t be matched to a paper in Crossref, so it can’t be checked.
plainstates a possible cause- Asserted: passes — The authors put it forward as true.
- Checkable: passes — It can be checked against evidence.
- Load-bearing: passes — The paper’s conclusions depend on it.
- Based: passes — The paper gives a reason why it holds.
- Also stated in: § Students' Incoming Characteristics We found that effects favoring PS-I over I-PS were higher if students belonged to a higher grade level. Younger age students (2nd to 5th graders), however, seemed to benefit from I-PS interventions, although the average effect size favoring I-PS was low (Hedge's g of -0.09 [95% CI -0.92, -0.16]. This is despite 72% ( n = 18/25) of the comparisons involving 2nd to 5th graders providing evidence for high prior knowledge activation (reflected in the PF fidelity criteria of evidence for multiple RSM generation ). However, the extent to which the activated prior knowledge is relevant for learning the targeted concepts can substantially affect students' performance. Research on goal specificity (e.g., Miller etal., 1999; Vollmeyer etal., 1996), mechanisms of errorful generation (Cyr & Anderson, 2015), as well as prior PS-I work (e.g., Kapur, 2015; Schwartz etal., 2011) has suggested that the benefits of prior knowledge activation such as noticing inconsistencies across multiple problem instances, encoding critical features from instruction, and so on, are contingent on the relevance of the activation. One explanation for the negative effect sizes disfavoring PS-I for young learners might therefore be the low relevance (albeit, high activation ) of prior knowledge. Factors stemming from students' unawareness of productive metacognitive learning strategies (e.g., planning and monitoring solution generation efficacy, self-explaining, debugging, and error-evaluation) might alternatively contribute to this contrasting trend. Finally, across the comparisons involving 2nd to 5th graders, the low overall PF fidelity score ( M = 56.86%, SD = 27.84%) might also be responsible for negative effects for PS-I. For these younger students then, scaffolding the initial problem-solving phase of PS-I to compensate for their insufficient prior knowledge about cognitive and metacognitive learning strategies might be critical. Richland and Simms (2015), more generally, have documented the importance of scaffolding exploratory problem solving through a series of studies on induction within (non-) STEM domains. They emphasize explicit support in noticing the relevance of relational thinking, providing adequate processing resources to mentally hold and manipulate relations, and facilitating recognition of both similarities and differences when drawing analogies. We further found that comparisons where students were pretested on concepts targeted in the intervention showed a higher effect size favoring PS-I (Hedge's g 0.39 [95% CI -0.26, 0.42]), relative to interventions where no pretest was held (Hedge's g 0.31 [95% CI -0.44, 0.30]), or the pretest targeted only prerequisite concepts (Hedge's g 0.30 [95% CI -0.63, 0.50]). Therefore, including a pretest targeting similar learning materials as the PS-I intervention itself may serve to enhance the differential advantages over I-PS (see Yang etal., 2018, for the facilitatory effects of forward testing), instead of diminishing PS-I's effectiveness due to potential overlap with the triggered learning mechanisms (Newman & DeCaro, 2019). · plain
Every source the paper cites for this claim was checked and supports it.
In the paper
“To the best of our knowledge, this is the first integrative empirical counterevidence against the claim that problem solving as a sensemaking activity for novices is not an effective instructional approach (cf. Kirschner etal., 2006, and follow-up work).”
What the sources say
- Supportedcites Kirschner et al., 2006 source
The cited paper’s Current Research Supporting Direct Guidance section says that problem solving becomes relatively effective only when learners have sufficient experience and that novices need extensive guidance to avoid unproductive problem-solving search. Its Conclusions likewise favor strong guidance over minimally guided instruction for novice to intermediate learners. The citing authors’ assertion that their meta-analysis is the first counterevidence is their own claim, not one attributed to Kirschner et al. (LLM, conf=0.87)
hedged- Asserted: passes — The authors put it forward as true.
- Checkable: passes — It can be checked against evidence.
- Load-bearing: passes — The paper’s conclusions depend on it.
- Based: passes — The paper gives a reason why it holds.
- Rests on an assumption not shown here.
- Supported
The sources with a verdict support this claim; the rest weren’t checked yet, have no full text we could read, or their verdicts aren’t rated yet.
In the paper
“12 Results from a complementary Bayesian multilevel meta-analysis model (Harrer etal., 2019; Williams etal., 2018) with weakly informative priors for true pooled effect size (µ ~ N (0, 1)) and between-study heterogeneity ( τ ~ HC (0, 0.5)) aligned with these pooled effect size estimates: Hedge's g = 0.36, 95% CI [0.19, 0.52].”
What the sources say
- Not checked — no full text of the sourcecites Harrer et al., 2019 source
- Supportedcites Williams et al., 2018 source
The Introduction and Random-Effects Model section describe Bayesian random-effects meta-analysis using weakly informative priors, supporting the citation as a reference for the method. The Hedges’ g estimate and interval are presented as the citing authors’ results, not as findings attributed to Williams et al. (LLM, conf=0.84)
plain- Asserted: passes — The authors put it forward as true.
- Checkable: passes — It can be checked against evidence.
- Load-bearing: passes — The paper’s conclusions depend on it.
- Based: passes — The paper gives a reason why it holds.
Every source the paper cites for this claim was checked and supports it.
In the paper
“13 Previous reviews regarding the forward testing effect (Yang et al., 2018) suggest inconclusive evidence for the extent to which it might generalize to younger children (and older adults).”
What the sources say
- Supportedcites Yang et al., 2018 source
The Individual differences section reports no forward testing effect in younger children learning single items, but says this does not rule out an effect with complex materials. The Future research directions section explicitly asks whether the effect generalizes to older adults. Page numbers are not supplied in our copy. (LLM, conf=0.92)
hedged- Asserted: passes — The authors put it forward as true.
- Checkable: passes — It can be checked against evidence.
- Load-bearing: passes — The paper’s conclusions depend on it.
- Based: passes — The paper gives a reason why it holds.
- Supported
75 more claims
Create a free account to see all 138 claims and every source verdict.
- Probably not a substantial claim. 36
- It may state two separate claims as one. 33
- The quote only partly states this claim. 1
Claims other papers make about this one
Each is checked against this paper’s own text: does it say what the citing paper says it does?
The source backs part of the claim, not all of it — or backs it for a different population, condition or comparison.
In the citing paper
“While PF works across learning subjects, this work focuses on high school math, as it has been most explored in PF research (Sinha and Kapur, 2021).”
From Towards the Pedagogical Steering of Large Language Models for Tutoring: A Case Study with Modeling Productive Failure (2025) · cites this paper as Sinha and Kapur, 2021
Experimental — accuracy not yet measuredThe source backs part of the claim, not all of it — or backs it for a different population, condition or comparison.
In the citing paper
“which is more effective for human learning than other classical teaching methods (Sinha and Kapur, 2021).”
From Towards the Pedagogical Steering of Large Language Models for Tutoring: A Case Study with Modeling Productive Failure (2025) · cites this paper as Sinha and Kapur, 2021
Experimental — accuracy not yet measuredThe source backs part of the claim, not all of it — or backs it for a different population, condition or comparison.
In the citing paper
“While PF works across learning subjects, this work focuses on high school math, as it has been most explored in PF research (Sinha and Kapur, 2021).”
From Towards the Pedagogical Steering of Large Language Models for Tutoring: A Case Study with Modeling Productive Failure (2025) · cites this paper as Sinha and Kapur, 2021
Experimental — accuracy not yet measuredThe cited source says what the claim attributes to it.
In the citing paper
“As a case study, we create a prototype tutor for high school math following Productive Failure (PF), an advanced and effective learning design.”
From Towards the Pedagogical Steering of Large Language Models for Tutoring: A Case Study with Modeling Productive Failure (2025) · cites this paper as Sinha and Kapur, 2021
Statistics recomputed
Every reported test result, recomputed from its test statistic and degrees of freedom. A result shows as not adding up only once an independent check has confirmed it.
- ConsistentF(3, 162) = 6.485reported p = .0004 · recomputed p < .001
“F (3, 162) = 6.485, p = .0004”
- Consistentχ²(1) = 33.15reported p < .001 · recomputed p < .001
“χ 2 (1) = 33.15, p < .001”
Self-check
Percentages, sums and reported differences re-computed from the paper’s own numbers.
Each contradiction between two passages listed here was confirmed by an independent check.
Rated major: it would touch a result — a value a result rests on, reported and recomputed p-values on opposite sides of the significance level, two passages that conflict with no sign which is right, or a cited work retracted before this paper was published.
In the paper
§ Intervention Characteristics
“conceptual knowledge (Hedge's g = 0.33”
§ Intervention Characteristics
“95% CI [-0.30, 0.22]”
Rated major: it would touch a result — a value a result rests on, reported and recomputed p-values on opposite sides of the significance level, two passages that conflict with no sign which is right, or a cited work retracted before this paper was published.
In the paper
§ Productive Failure Fidelity for the PS-I Design
“Undergraduates (0.28”
§ Productive Failure Fidelity for the PS-I Design
“[-0.46, 0.24])”
Rated major: it would touch a result — a value a result rests on, reported and recomputed p-values on opposite sides of the significance level, two passages that conflict with no sign which is right, or a cited work retracted before this paper was published.
In the paper
§ Students' Incoming Characteristics
“Hedge's g of -0.09”
§ Students' Incoming Characteristics
“[95% CI -0.92, -0.16]”
Rated major: it would touch a result — a value a result rests on, reported and recomputed p-values on opposite sides of the significance level, two passages that conflict with no sign which is right, or a cited work retracted before this paper was published.
In the paper
§ Intervention Characteristics
“transfer (Hedge's g = 0.40”
§ Intervention Characteristics
“95% CI [-0.19, 0.32]”
Rated minor: it would not touch a result — a value no result rests on, a p-value that stays on the same side of the significance level, or a conflict that is clerical, resolved elsewhere in the paper, or outside its own findings.
In the paper
§ Students' Incoming Characteristics
“these estimates increased (or became more positive) with the age range.”
§ Productive Failure Fidelity for the PS-I Design
“6th to 10th graders (0.50 [-0.04, 0.58]) Undergraduates (0.28 [-0.46, 0.24])”
2 more findings
Create a free account to see every finding of this check.
Citations
Cites
Preferred reporting items for systematic reviews and meta-analyses: The PRISMA statement
Moher, D., Liberati, A., Tetzlaff, J., Altman, D. G., & the PRISMA Group* (2009) · Annals of Internal Medicine · doi:10.7326/0003-4819-151-4-200908180-00135 · Cited by 37,554
Data Mining: Practical Machine Learning Tools and Techniques
(2011) · Elsevier eBooks · doi:10.1016/c2009-0-19715-5 · Cited by 25,437
Cochrane Handbook for Systematic Reviews of Interventions: Cochrane Book Series
(2008) · doi:10.1002/9780470712184 · Cited by 25,048 · cited 1×
“Higgins and Green (2011) was used as a reference text to guide all analyses.”
Duval, S., & Tweedie, R. (2000) · Biometrics · doi:10.1111/j.0006-341x.2000.00455.x · Cited by 14,099 · cited 1×
“Additionally, we also used inferential statistics (Egger’s test) for evaluating presence of asymmetry in the funnel plot and trim-and-fill procedures (Duval & Tweedie, 2000) if applicable.”
Active learning increases student performance in science, engineering, and mathematics
Freeman, S., Eddy, S. L., McDonough, M., Smith, M. K., Okoroafor, N., Jordt, H., & Wenderoth, M. P. (2014) · Proceedings of the National Academy of Sciences · doi:10.1073/pnas.1319030111 · Cited by 9,787 · cited 1×
“Meta-analysis has been shown to be an effective technique in evaluating broadscale pedagogical changes (Freeman et al., 2014).”
Kirschner, P. A., Sweller, J., & Clark, R. E. (2006) · Educational Psychologist · doi:10.1207/s15326985ep4102_1 · Cited by 7,776 · cited 4×
“…explicitly via cognitive scaffolds, worked examples, and so on, our view is that the first stage of PF does not resemble (direct) instruction, a learning experience where students are introduced to formal concepts of a domain in the most unambiguous (eloquent) way possible (Kirschner et al., 2006).”
InfluentialCochrane Handbook for Systematic Reviews of Interventions
Tarsilla, M. (2010) · Journal of MultiDisciplinary Evaluation · doi:10.56645/jmde.v6i14.284 · Cited by 5,178
Colman (2022) · doi:10.1073/pnas · Cited by 4,370
Advances in Instructional Psychology
(2019) · Routledge eBooks · doi:10.4324/9781315864341 · Cited by 2,532
Proceedings for the Annual Meeting of the Cognitive Science Society
Dziemianko, M., Clarke, A. D. F., & Keller, F. (2013) · Cited by 1,726
Research works printed but not linked: 4
- Fukaya T., Uesaka Y., Ichikawa S. (2019). Investigating the effects of thinking after instruction approach. Educational Technology Research, 41(1), 1–11. https://doi.org/10.15077/etr.42105 · doi:10.15077/etr.42105
- Hall M. A. (1999). Correlation-based feature selection for machine learning [Doctoral dissertation, The University of Waikato Hamilton]. https://www.cs.waikato.ac.nz/~mhall/thesis.pdf
- Mazziotti C., 2015, Exploring the material conditions of learning: The Computer Supported Collaborative Learning (CSCL) Conference 2015, 2, 570
- Sears D. A. (2006). Effects of innovation versus efficiency tasks on collaboration and learning [Doctoral dissertation, Stanford University]. https://iase-web.org/documents/dissertations/06.Sears.pdf
Cited by
Making Sense of Generative Learning
Fiorella, L. (2023) · Educational Psychology Review · doi:10.1007/s10648-023-09769-7 · Cited by 135
“The benefits of problem-solving-first approaches appear strongest when learners attempt to solve rich problems that afford generating multiple potential solutions (Kapur, 2016; Sinha & Kapur, 2021).”
BackgroundCognitive Load Theory in Computing Education Research: A Review
Duran, R., Zavgorodniaia, A., & Sorva, J. (2022) · ACM Transactions on Computing Education · doi:10.1145/3483843 · Cited by 92
“Lately, such discussions have frequently featured the pedagogical pattern of productive failure [39, 92], in which a problem-solving activity that fails by design precedes other activities that teach a solution.”
BackgroundLichtenfeld, S., Pekrun, R. H., Marsh, H. W., Nett, U. E., & Reiss, K. M. (2022) · Journal of Educational Psychology · doi:10.1037/edu0000748 · Cited by 121
“However, a recent meta-analysis (Sinha & Kapur, 2021) has suggested that failures in complex learning prior to a memory consolidation phase can be detrimental rather than beneficial for young students’ learning (2nd to 5th graders).”
BackgroundMastery experiences in immersive virtual reality promote pro-environmental waste-sorting behavior
Stenberdt, V. A., & Makransky, G. (2023) · Computers & Education · doi:10.1016/j.compedu.2023.104760 · Cited by 97
Kapur, M., Hattie, J., Grossman, I., & Sinha, T. (2022) · Frontiers in Education · doi:10.3389/feduc.2022.956416 · Cited by 100
“However, to the extent they can generate and explore multiple solutions to the problem, even if they are suboptimal or incorrect, this failure prepares them to learn from subsequent instruction (Sinha and Kapur, 2021a).”
Self-citation
Metadata
- Authors
- Sinha, T., & Kapur, M.
- Affiliations
- ETH Zurich (CH)
- Venue
- Review of Educational Research
- Published
- 2021-06-18
- Volume
- 91
- Issue
- 5
- Pages
- 761-798
- ISSN
- 0034-6543 (ISSN-L)
- 1935-1046
- OpenAlex
- W3174759423
- Cited by
- 212
- References
- 77
- Citations by year
- 2026: 49 · 2025: 57 · 2024: 30 · 2023: 44 · 2022: 29 · 2021: 3
- FWCI
- 25.61
- Type
- journal article
- Language
- en
- Open access
- hybrid
- doi.org
- Locations
- Review of Educational Research (publishedVersion, cc-by)
- Repository for Publications and Research Data (ETH Zurich) (submittedVersion, cc-by)
- ETH Zürich Research Collection (cc-by)
- Topics
- Social Sciences › Psychology › Experimental and Cognitive Psychology › Visual and Cognitive Learning Processes
- Social Sciences › Psychology › Developmental and Educational Psychology › Innovative Teaching and Learning Methods
- Social Sciences › Education › Science Education and Pedagogy
- Keywords
- productive failure, conceptual learning, publication bias, grade level effects, domain-general skills
About these checks
Registry, retraction, Cites and statistics results are computed, not judged, with one exception: a printed reference that no index lists is read once by a model before it counts as a citation error. Claims are extracted by a model and kept only when their quote appears verbatim in the text; each cited source is then checked, with a model’s help, for whether it says what the claim relies on. Those verdicts can be wrong — read the claim’s quote and the cited source before relying on one.
The claim verdicts this report counts are experimental: their accuracy is not yet measured.
A language model drew the claims from the paper on 2026-10-05, under version 3 of the claim definition (model deepseek-v4.1-flash, prompt extract-v3).
A second model labelled each claim on 2026-10-05 (model jev-1.13-20260917, definition revision gold-guideline-v0.2).
Cited sources are checked with a language model’s help (gpt-6-sol).
Statistics and arithmetic are recomputed, not judged.
Confidence bands are shown only for fields calibrated on our annotated test set. None is calibrated yet, so no band is shown.
What counts as a claim ›How we measure confidence ›How we check this ›
Are you an author, or do you see a problem with this page? Request a review
How to cite
Cite CoChat for the checks on this page, and the paper for its own findings.
- This page
- CoChat. (2026). Citation check: When Problem Solving Followed by Instruction Works: Evidence for Productive Failure. https://app.cochat.ai/papers/10.3102/00346543211019105
- The paper
- Sinha, T., & Kapur, M. (2021). When Problem Solving Followed by Instruction Works: Evidence for Productive Failure. Review of Educational Research. https://doi.org/10.3102/00346543211019105
Data sources
Bibliographic data: Semantic Scholar, OpenAlex, Crossref.
Contains information from the Semantic Scholar Academic Graph Datasets, made available under the ODC Attribution License (ODC-BY 1.0).
Semantic Scholar’s data is described in: Kinney, R., et al. (2023). The Semantic Scholar Open Data Platform. arXiv:2301.10140.
