

The DOI matches its Crossref record; 24 of the 24 references it cites were found in a registry or an index.
Systematic survey reveals general applicability of "guilt-by-association" within gene coexpression networks
Open accessAbstract
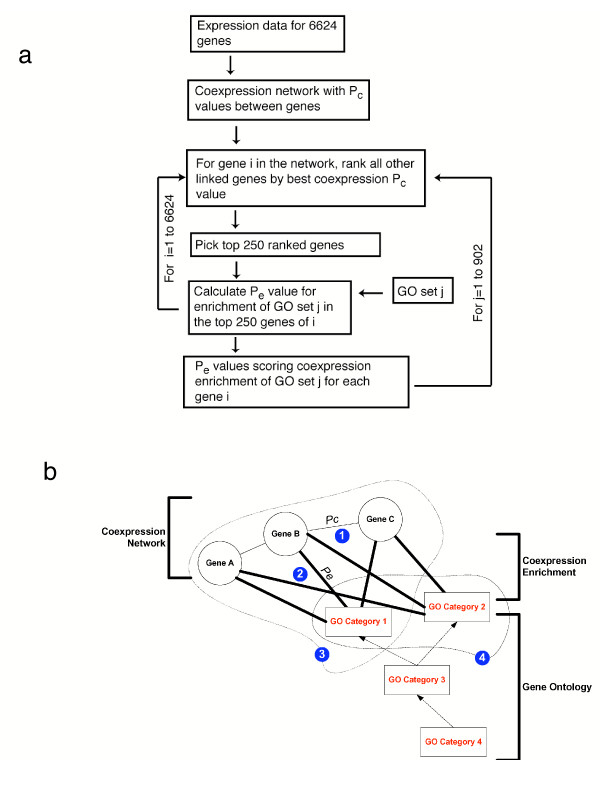
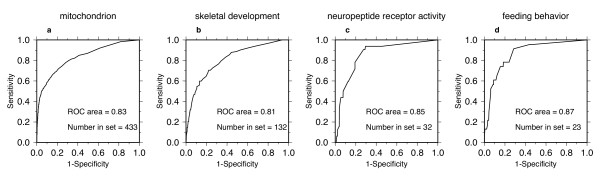
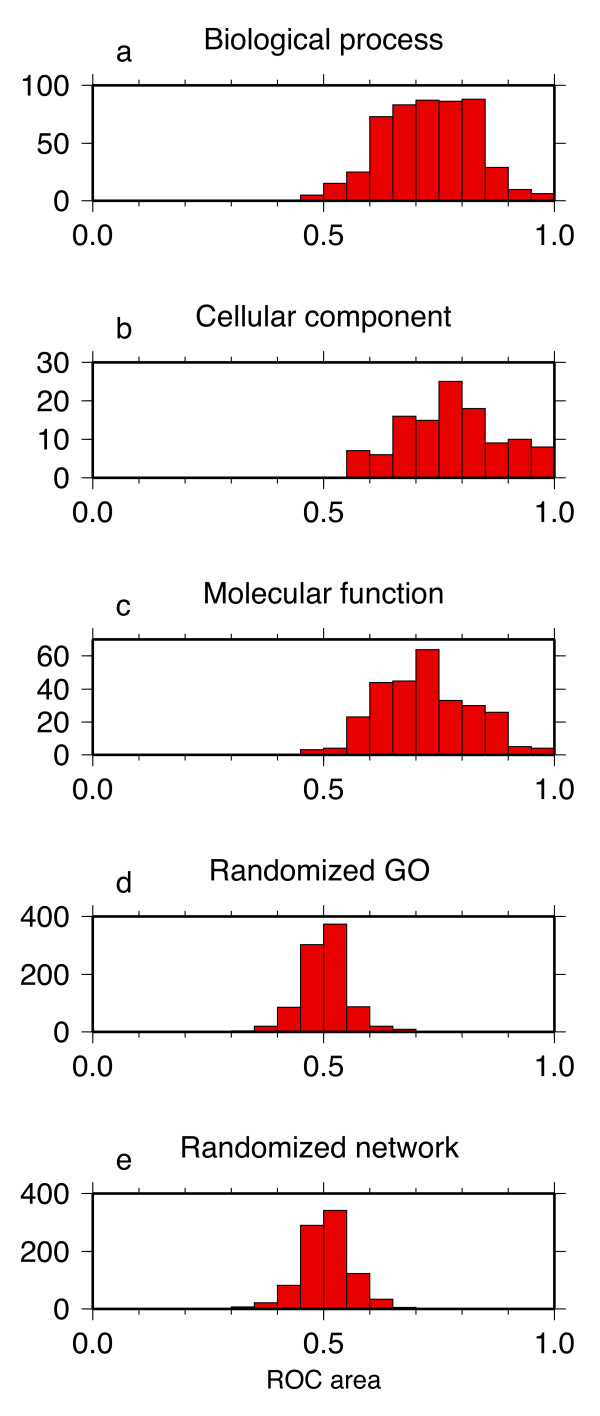
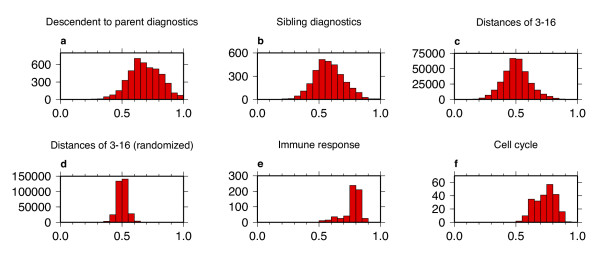
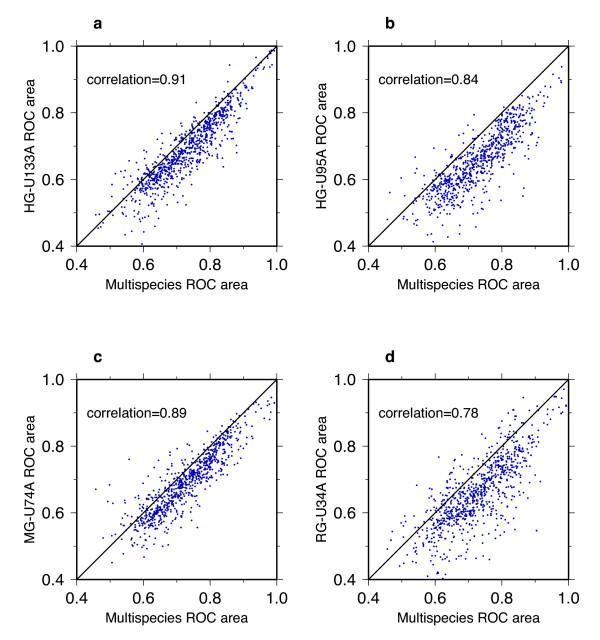
Background: Biological processes are carried out by coordinated modules of interacting molecules. As clustering methods demonstrate that genes with similar expression display increased likelihood of being associated with a common functional module, networks of coexpressed genes provide one framework for assigning gene function. This has informed the guilt-by-association (GBA) heuristic, widely invoked in functional genomics. Yet although the idea of GBA is accepted, the breadth of GBA applicability is uncertain. Results: We developed methods to systematically explore the breadth of GBA across a large and varied corpus of expression data to answer the following question: To what extent is the GBA heuristic broadly applicable to the transcriptome and conversely how broadly is GBA captured by a priori knowledge represented in the Gene Ontology (GO)? Our study provides an investigation of the functional organization of five coexpression networks using data from three mammalian organisms. Our method calculates a probabilistic score between each gene and each Gene Ontology category that reflects coexpression enrichment of a GO module. For each GO category we use Receiver Operating Curves to assess whether these probabilistic scores reflect GBA. This methodology applied to five different coexpression networks demonstrates that the signature of guilt-by-association is ubiquitous and reproducible and that the GBA heuristic is broadly applicable across the population of nine hundred Gene Ontology categories. We also demonstrate the existence of highly reproducible patterns of coexpression between some pairs of GO categories. Conclusion: We conclude that GBA has universal value and that transcriptional control may be more modular than previously realized. Our analyses also suggest that methodologies combining coexpression measurements across multiple genes in a biologically-defined module can aid in characterizing gene function or in characterizing whether pairs of functions operate together.
Overview
The claims and statistics of this paper haven’t been checked yet.
Run the check — free, no account needed. It reads the open-access text and checks the sources it cites.
Integrity signals
Registry
Cites
Statistics
Figures
Verification
Claims the paper makes
The claims and statistics of this paper haven’t been checked yet.
Run the check — free, no account needed. It reads the open-access text and checks the sources it cites.
Claims other papers make about this one
Each is checked against this paper’s own text: does it say what the citing paper says it does?
In the citing paper
“Thus, gene products that are involved in an unknown cell type or biological process can be annotated on the basis of their proximity to marker genes of known function (‘guilt by association’)26,33,34.”
From Systems biology and gene networks in neurodevelopmental and neurodegenerative disorders (2015) · cites this paper as [33]
Self-check
Percentages, sums and reported differences re-computed from the paper’s own numbers.
The self-check needs the paper’s full text.
Citations
Cites
Gene Ontology: tool for the unification of biology
Ashburner, M., Ball, C. A., Blake, J. A., Botstein, D., Butler, H., Cherry, J. M., Davis, A. P., Dolinski, K., Dwight, S. S., Eppig, J. T., et al. (2000) · Nature Genetics · doi:10.1038/75556 · Cited by 43,206
The meaning and use of the area under a receiver operating characteristic (ROC) curve.
Hanley, J. A., & McNeil, B. J. (1982) · Radiology · doi:10.1148/radiology.143.1.7063747 · Cited by 21,856
Cluster analysis and display of genome-wide expression patterns
Eisen, M. B., Spellman, P. T., Brown, P. O., & Botstein, D. (1998) · Proceedings of the National Academy of Sciences · doi:10.1073/pnas.95.25.14863 · Cited by 16,184
Mootha, V. K., Lindgren, C. M., Eriksson, K.-F., Subramanian, A., Sihag, S., Lehar, J., Puigserver, P., Carlsson, E., Ridderstråle, M., Laurila, E., et al. (2003) · Nature Genetics · doi:10.1038/ng1180 · Cited by 10,197
From molecular to modular cell biology.
Hartwell, L. H., Hopfield, J. J., Leibler, S., & Murray, A. W. (1999) · Nature · doi:10.1038/35011540 · Cited by 3,632
Functional Discovery via a Compendium of Expression Profiles
Hughes, T. R., Marton, M. J., Jones, A. R., Roberts, C. J., Stoughton, R. B., Armour, C. D., Bennett, H. A., Coffey, E. M., Dai, H. A., He, Y. D., et al. (2000) · Cell · doi:10.1016/s0092-8674(00)00015-5 · Cited by 2,534
Systematic determination of genetic network architecture
Tavazoie, S., Hughes, J. D., Campbell, M. J., Cho, R. J., & Church, G. M. (1999) · Nature Genetics · doi:10.1038/10343 · Cited by 2,509
Exploring the new world of the genome with DNA microarrays
Brown, P. O., & Botstein, D. (1999) · Nature Genetics · doi:10.1038/4462 · Cited by 2,430
A Gene-Coexpression Network for Global Discovery of Conserved Genetic Modules
Stuart, J. M., Segal, E., Koller, D., & Kim, S. K. (2003) · Science · doi:10.1126/science.1087447 · Cited by 2,274
Computational analysis of microarray data
Quackenbush, J. (2001) · Nature Reviews Genetics · doi:10.1038/35076576 · Cited by 1,481
Cited by
Sorted by citations
Items 201–300 of 424
Aid‐Pavlidis, T., Pavlidis, P., & Timmusk, T. (2009) · BMC Genomics · doi:10.1186/1471-2164-10-420 · Cited by 15
Metabolic engineering to increase crop yield: From concept to execution
Skraly, F. A., Ambavaram, M. M. R., Peoples, O. P., & Snell, K. D. (2018) · Plant Science · doi:10.1016/j.plantsci.2018.03.011 · Cited by 15
Measuring similarity between gene expression profiles: a Bayesian approach
Nguyen, V.-A., & Lió, P. (2009) · BMC Genomics · doi:10.1186/1471-2164-10-s3-s14 · Cited by 15
Zuluaga, D. L., Blanco, E., Mangini, G., Sonnante, G., & Curci, P. L. (2023) · Plants · doi:10.3390/plants12061267 · Cited by 14
Kleeßen, S., Klie, S., & Nikoloski, Z. (2013) · The Plant Cell · doi:10.1105/tpc.113.111039 · Cited by 14
Neural network model for integration and visualization of introgressed genome and metabolite data
Stegmayer, G. S., Milone, D. H., Kamenetzky, L., López, M. G., & Carrari, F. O. (2009) · International Joint Conference on Neural Networks (IJCNN) · doi:10.1109/ijcnn.2009.5179039 · Cited by 14
Differentiated transcriptional signatures in the maize landraces of Chiapas, Mexico
Kost, M. A., Perales, H., Wijeratne, S., Wijeratne, A., Stockinger, E. J., & Mercer, K. L. (2017) · BMC Genomics · doi:10.1186/s12864-017-4005-y · Cited by 14
Koryachko, A., Matthiadis, A., Muhammad, D., Foret, J., Brady, S. M., Ducoste, J. J., Tuck, J. M., Long, T. A., & Williams, C. (2015) · PLoS ONE · doi:10.1371/journal.pone.0136591 · Cited by 14
Comparison of automated and human assignment of MeSH terms on publicly-available molecular datasets
Ruau, D., Mbagwu, M., Dudley, J. T., Krishnan, V., & Butte, A. J. (2011) · Journal of Biomedical Informatics · doi:10.1016/j.jbi.2011.03.007 · Cited by 14
Self-citationShadhin, K. A., Hasan, M. R., Paul, B. K., Ahmed, K., Moni, M. A., Kahrizi, D., Bhuyian, T., & Ibrahim, S. M. (2020) · Cellular and Molecular Biology · doi:10.14715/cmb/2020.66.7.23 · Cited by 13
Tayal, S., Bhatia, V., Mehrotra, T., & Bhatnagar, S. (2022) · Amino Acids · doi:10.1007/s00726-022-03163-3 · Cited by 13
Tu, M., Zeng, J., Zhang, J., Fan, G., & Song, G. (2022) · Frontiers in Plant Science · doi:10.3389/fpls.2022.1038109 · Cited by 15
Clustering based on multiple biological information: approach for predicting protein complexes
Tang, X., Feng, Q., Wang, J., He, Y., & Pan, Y. F. (2013) · IET Systems Biology · doi:10.1049/iet-syb.2012.0052 · Cited by 12
A mechanistic insight into the anti-metastatic role of the prostate specific antigen
Pellegrino, F., Coghi, A., Lavorgna, G., Cazzaniga, W., Guazzoni, E., Locatelli, I., Villa, I., Bolamperti, S., Finocchio, N., Alfano, M., et al. (2021) · Translational Oncology · doi:10.1016/j.tranon.2021.101211 · Cited by 13
Orduña, L., Santiago, A., Navarro‐Payá, D., Zhang, C., Wong, D. C. J., & Matus, J. T. (2023) · Journal of Experimental Botany · doi:10.1093/jxb/erad344 · Cited by 13
Inferring Unknown Biological Function by Integration of GO Annotations and Gene Expression Data
Leale, G., Bayá, A. E., Milone, D. H., Granitto, P. M., & Stegmayer, G. S. (2016) · IEEE Transactions on Computational Biology and Bioinformatics · doi:10.1109/tcbb.2016.2615960 · Cited by 13
Inference of Gene Co-expression Networks from Single-Cell RNA-Sequencing Data
Lamere, A. T., & Li, J. (2019) · Methods in molecular biology · doi:10.1007/978-1-4939-9057-3_10 · Cited by 13
Majtán, T., Halgasova, N., Bukovská, G., & Timko, J. (2006) · Virology · doi:10.1016/j.virol.2006.09.028 · Cited by 13
Fernández, J. D., Navarro‐Payá, D., Santiago, A., Cerda, A., Canan, J., Contreras-Riquelme, S., Moyano, T. C., Landaeta-Sepúlveda, D., Melet, L., Canales, J., et al. (2025) · Plant Communications · doi:10.1016/j.xplc.2025.101499 · Cited by 11
Genome-wide identification of lncRNAs associated with viral infection in Spodoptera frugiperda
Robin, S., Legeai, F., Jouan, V., Ogliastro, M., & Darboux, I. (2023) · Journal of General Virology · doi:10.1099/jgv.0.001827 · Cited by 12
Mishra, B., Gou, Y., Tan, Z., Wang, Y., Hu, G., Athar, M., & Mukhtar, M. S. (2025) · npj Systems Biology and Applications · doi:10.1038/s41540-025-00498-x · Cited by 12
Network-based inference from complex proteomic mixtures using SNIPE
Nusinow, D. P., Kieżun, A., O’Connell, D. J., Chick, J. M., Yue, Y., Maas, R. L., Gygi, S. P., & Sunyaev, S. R. (2012) · Bioinformatics · doi:10.1093/bioinformatics/bts594 · Cited by 12
Bloch, N. I., Corral‐López, A., Buechel, S. D., Kotrschal, A., Kolm, N., & Mank, J. E. (2020) · Genes Brain & Behavior · doi:10.1111/gbb.12697 · Cited by 12
Rai, M., Rai, A., Mori, T., Nakabayashi, R., Yamamoto, M., Nakamura, M., Suzuki, H., Saito, K., & Yamazaki, M. (2021) · International Journal of Molecular Sciences · doi:10.3390/ijms22168835 · Cited by 12
DIGNiFI: Discovering causative genes for orphan diseases using protein-protein interaction networks
Liu, X., Yang, Z., Lin, H., Simmons, M., & Lu, Z. (2017) · BMC Systems Biology · doi:10.1186/s12918-017-0402-8 · Cited by 12
Graph Theoretic and Pearson Correlation-Based Discovery of Network Biomarkers for Cancer
Tanvir, R. B., Aqila, T., Maharjan, M., Mamun, A. A., & Mondal, A. M. (2019) · Data · doi:10.3390/data4020081 · Cited by 12
Extracting Global System Dynamics of Corticosteroid Genomic Effects in Rat Liver
Yang, E., Almon, R. R., DuBois, D. C., Jusko, W. J., & Androulakis, I. P. (2007) · Journal of Pharmacology and Experimental Therapeutics · doi:10.1124/jpet.107.133074 · Cited by 12
Inferring large-scale gene regulatory networks using a low-order constraint-based algorithm
Wang, M., Benedito, V. A., Zhao, P. X., & Udvardi, M. K. (2010) · Molecular BioSystems · doi:10.1039/b917571g · Cited by 12
Identifying disease genes from PPI networks weighted by gene expression under different conditions
Luo, P., Tian, L., Ruan, J., & Wu, F. (2016) · IEEE International Conference on Bioinformatics and Biomedicine (BIBM) · doi:10.1109/bibm.2016.7822699 · Cited by 11
Hu, M., & Qin, Z. S. (2009) · PLoS ONE · doi:10.1371/journal.pone.0004495 · Cited by 11
Meta-analytic framework for liquid association
Wang, L., Liu, S., Ding, Y., Yuan, S., Ho, Y., & Tseng, G. C. (2017) · Bioinformatics · doi:10.1093/bioinformatics/btx138 · Cited by 11
Omony, J., de Jong, A., Krawczyk, A. O., Eijlander, R. T., & Kuipers, O. P. (2018) · Microbial Genomics · doi:10.1099/mgen.0.000157 · Cited by 11
Chitneedi, P., Weikard, R., Arranz, J. J., Valladares, M. M., Kuehn, C., & Gutiérrez‐Gil, B. (2021) · Frontiers in Genetics · doi:10.3389/fgene.2021.685341 · Cited by 13
Biological Network Inference and Analysis Using SEBINI and CABIN
Taylor, R. C., & Singhal, M. (2009) · Methods in molecular biology · doi:10.1007/978-1-59745-243-4_24 · Cited by 11
Using the gene ontology to enrich biological pathways
Sanfilippo, A. P., Baddeley, B., Beagley, N., McDermott, J., Riensche, R. M., Taylor, R. C., & Gopalan, B. (2009) · International Journal of Computational Biology and Drug Design · doi:10.1504/ijcbdd.2009.030114 · Cited by 11
Klomp, J. A., & Furge, K. A. (2012) · BMC Research Notes · doi:10.1186/1756-0500-5-370 · Cited by 10
Penrod, N. M., Greene, C. S., & Moore, J. H. (2014) · Genome Medicine · doi:10.1186/gm550 · Cited by 10
Generalized correlation measure using count statistics for gene expression data with ordered samples
Wang, Y. X. R., Liu, K., Theusch, E., Rotter, J. I., Medina, M. W., Waterman, M. S., & Huang, H. (2017) · Bioinformatics · doi:10.1093/bioinformatics/btx641 · Cited by 10
Sheng, Y., Ng, G. Z., SUMMERS, K. M., Every, A. L., Price, G. R., Hasnain, S. Z., SUTTON, P. R. N., & McGuckin, M. A. (2020) · Frontiers in Cellular and Infection Microbiology · doi:10.3389/fcimb.2020.00343 · Cited by 10
Gene co-expression network analysis of Trypanosoma brucei in tsetse fly vector
Mwangi, K. W., Macharia, R. W., & Bargul, J. L. (2021) · Parasites & Vectors · doi:10.1186/s13071-021-04597-6 · Cited by 9
Yu, Y., & Kong, D. (2022) · BMC Bioinformatics · doi:10.1186/s12859-021-04543-4 · Cited by 13
24 Bioinformatic Prediction of Yeast Gene Function
Lee, I., Narayanaswamy, R., & Marcotte, E. M. (2007) · Methods in microbiology · doi:10.1016/s0580-9517(06)36024-2 · Cited by 10
Improving clustering with metabolic pathway data
Milone, D. H., Stegmayer, G. S., López, M. G., Kamenetzky, L., & Carrari, F. O. (2014) · BMC Bioinformatics · doi:10.1186/1471-2105-15-101 · Cited by 9
A Systems-Level Understanding of Cardiovascular Disease through Networks
Farber, C. R., & Mesner, L. D. (2015) · Elsevier eBooks · doi:10.1016/b978-0-12-799961-6.00003-2 · Cited by 12
Network modelling of gene regulation
Ho, J. W. K., & Charleston, M. (2010) · Biophysical Reviews · doi:10.1007/s12551-010-0041-4 · Cited by 10
Saito, S., & Horimoto, K. (2009) · Conference proceedings/Conference proceedings - IEEE International Conference on Systems, Man, and Cybernetics · doi:10.1109/icsmc.2009.5346809 · Cited by 9
Zwaenepoel, A., Diels, T., Amar, D., Parys, T. V., Ron Shamir, A., de Peer, Y. V., & Tzfadia, O. (2018) · Frontiers in Plant Science · doi:10.3389/fpls.2018.00352 · Cited by 9
Poudel, S., Cope, A. L., O’Dell, K. B., Guss, A. M., Seo, H., Trinh, C. T., & Hettich, R. L. (2021) · Biotechnology for Biofuels · doi:10.1186/s13068-021-01964-4 · Cited by 8
Hecker, L. A., Alcon, T. C., Honavar, V., & Greenlee, M. H. W. (2008) · Bioinformatics and Biology Insights · doi:10.4137/bbi.s417 · Cited by 9
Sexual reproduction is controlled by successive transcriptomic waves in Podospora anserina
Bidard, F., Grognet, P., Lelandais, G., Imbeaud, S., Mucchielli-Giorgi, M.-H., Debuchy, R., Berteaux‐Lecellier, V., & Malagnac, F. (2025) · Peer Community Journal · doi:10.24072/pcjournal.574 · Cited by 8
Leveraging additional knowledge to support coherent bicluster discovery in gene expression data
Visconti, A., Cordero, F., & Pensa, R. G. (2014) · Intelligent Data Analysis · doi:10.3233/ida-140671 · Cited by 8
Spectral gene set enrichment (SGSE)
Frost, H. R., Li, Z., & Moore, J. H. (2015) · BMC Bioinformatics · doi:10.1186/s12859-015-0490-7 · Cited by 8
OSG-KINC: High-throughput gene co-expression network construction using the open science grid
Poehlman, W. L., Rynge, M., Balamurugan, D., Mills, N. L., & Feltus, F. A. (2017) · IEEE International Conference on Bioinformatics and Biomedicine (BIBM) · doi:10.1109/bibm.2017.8217938 · Cited by 8
Poehlman, W. L., Schnabel, E. L., Chavan, S. A., Frugoli, J. A., & Feltus, F. A. (2019) · Frontiers in Plant Science · doi:10.3389/fpls.2019.01409 · Cited by 8
Filho, J. A. F., Rosolen, R. R., Almeida, D. A., Azevedo, P., Motta, M. L. L., Aono, A. H., Santos, C. A., Horta, M. A. C., & de Souza, A. P. (2021) · 3 Biotech · doi:10.1007/s13205-021-03032-y · Cited by 8
Generating weighted and thresholded gene coexpression networks using signed distance correlation
Pardo-Diaz, J., Poole, P. S., Beguerisse-Díaz, M., Deane, C. M., & Reinert, G. (2022) · Network Science · doi:10.1017/nws.2022.13 · Cited by 8
Sancho, R., Catalán, P., Contreras‐Moreira, B., Juenger, T., & Marais, D. L. D. (2022) · Molecular Ecology · doi:10.1111/mec.16661 · Cited by 6
Gene network analysis: from heart development to cardiac therapy
Bellazzi, R., Engel, F. B., & Ferrazzi, F. (2014) · Thrombosis and Haemostasis · doi:10.1160/th14-06-0483 · Cited by 8
Cancer Biomarker Discovery from Gene Co-expression Networks Using Community Detection Methods
Tanvir, R. B., & Mondal, A. M. (2019) · IEEE International Conference on Bioinformatics and Biomedicine (BIBM) · doi:10.1109/bibm47256.2019.8982960 · Cited by 9
Network Approaches to the Functional Analysis of Microbial Proteins
Hallinan, J. S., James, K., & Wipat, A. (2011) · Advances in microbial physiology/Advances in Microbial Physiology · doi:10.1016/b978-0-12-387661-4.00005-7 · Cited by 8
Single‐cell profiling screen identifies microtubule‐dependent reduction of variability in signaling
Pesce, C. G., Zdraljevic, S., Peria, W. J., Bush, A., Repetto, M. V., Rockwell, D., Yu, R. C., Colman‐Lerner, A., & Brent, R. (2018) · Molecular Systems Biology · doi:10.15252/msb.20167390 · Cited by 5
Poehlman, W. L., Hsieh, J. J.-D., & Feltus, F. A. (2019) · Scientific Reports · doi:10.1038/s41598-019-39875-y · Cited by 7
Tian, W., Hao, X., Nie, R., Ling, Y., Zhang, B., Zhang, H., & Wu, C. (2022) · Animals · doi:10.3390/ani12091099 · Cited by 7
Fóthi, Á., Pintér, C., Pollner, P., & Lörincz, A. (2022) · npj Systems Biology and Applications · doi:10.1038/s41540-022-00240-x · Cited by 7
Loeffler‐Wirth, H., Rade, M., Arakelyan, A., Kreuz, M., Loeffler, M., Koehl, U., Reiche, K., & Binder, H. (2022) · Frontiers in Immunology · doi:10.3389/fimmu.2022.994885 · Cited by 7
Predicting protein complexes via the integration of multiple biological information
Tang, X., Wang, J., & Pan, Y. F. (2012) · IEEE International Conference on Systems Biology · doi:10.1109/isb.2012.6314132 · Cited by 7
Blom, E.-J., Rainer Breitling, A., Hofstede, K. J., Roerdink, J. B. T. M., van Hijum, S. A. F. T., & Kuipers, O. P. (2008) · BMC Genomics · doi:10.1186/1471-2164-9-495 · Cited by 7
Constraint-Based Knowledge Discovery from SAGE Data
Kléma, J., Blachon, S., Soulet, A., Crémilleux, B., & Gandrillon, O. (2008) · In Silico Biology · doi:10.3233/isb-00351 · Cited by 7
Profiling of Genetic Switches using Boolean Implications in Expression Data
Çakır, M. V., Binder, H., & Wirth, H. (2014) · Berichte aus der medizinischen Informatik und Bioinformatik/Journal of integrative bioinformatics · doi:10.1515/jib-2014-246 · Cited by 7
Context Specific Transcription Factor Prediction
Yang, E., Simcha, D., Almon, R. R., DuBois, D. C., Jusko, W. J., & Androulakis, I. P. (2007) · Annals of Biomedical Engineering · doi:10.1007/s10439-007-9268-z · Cited by 7
Penrod, N. M., & Moore, J. H. (2013) · BMC Medical Genomics · doi:10.1186/1755-8794-6-s2-s2 · Cited by 7
Dissanayake, I. M., Rodríguez-Medina, J., Brady, S. M., & Tanurdžić, M. (2019) · bioRxiv (Cold Spring Harbor Laboratory) · doi:10.1101/551069 · Cited by 7
Bilbao‐Arribas, M., & Jugo, B. M. (2022) · Frontiers in Genetics · doi:10.3389/fgene.2022.1067350 · Cited by 6
Zhao, Y., Zhang, H.-H., Wu, J., Li, L., Li, J., Zhong, H., Jin, Y., Lei, T., Zhao, X., Xu, B., et al. (2023) · Current Medical Science · doi:10.1007/s11596-023-2798-2 · Cited by 6
Bianchetti, G., Clouet, V., Legeai, F., Baron, C., Gazengel, K., Vu, B. L., Baud, S., To, A., Manzanares-Dauleux, M. J., Buitink, J., et al. (2024) · Physiologia Plantarum · doi:10.1111/ppl.14130 · Cited by 6
Li, M., Wang, P., Zhang, N., Guo, L., & Feng, Y.-M. (2019) · Cancer Gene Therapy · doi:10.1038/s41417-019-0143-5 · Cited by 6
Estimation of gene co-expression from RNA-Seq count data
Specht, A. T., & Li, J. (2015) · Statistics and Its Interface · doi:10.4310/sii.2015.v8.n4.a9 · Cited by 6
Probabilistic Models for Gene Silencing DataPreprint
Markowetz, F. M. (2017) · doi:10.31237/osf.io/8r5us · Cited by 6
A high-resolution bovine mitochondrial co-expression network
Alexandre, P. A., Keogh, K. A., Reverter, A., & Hudson, N. J. (2025) · Biology Open · doi:10.1242/bio.061630 · Cited by 5
Joint Gene Network Construction by Single-Cell RNA Sequencing Data
Dong, M., He, Y., Jiang, Y., & Zou, F. (2022) · Biometrics · doi:10.1111/biom.13645 · Cited by 5
Predicting disease‐associated genes: Computational methods, databases, and evaluations
Luo, P., Chen, B., Liao, B., & Wu, F. (2020) · Wiley Interdisciplinary Reviews Data Mining and Knowledge Discovery · doi:10.1002/widm.1383 · Cited by 5
Kwon, G., Wiedemann, A., Steinheuer, L. M., Stefanski, A., Szelinski, F., Racek, T., Frei, A. P., Hatje, K., Kam‐Thong, T., Schubert, D., et al. (2023) · npj Systems Biology and Applications · doi:10.1038/s41540-023-00319-z · Cited by 5
A virus-free cellular model recapitulates several features of severe COVID-19
Lavorgna, G., Cavalli, G., Dagna, L., Gregori, S., Larcher, A., Landoni, G., Ciceri, F., Montorsi, F., & Salonia, A. (2021) · Scientific Reports · doi:10.1038/s41598-021-96875-7 · Cited by 6
Scheff, J. D., Almon, R. R., DuBois, D. C., Jusko, W. J., & Androulakis, I. P. (2010) · OMICS A Journal of Integrative Biology · doi:10.1089/omi.2010.0005 · Cited by 5
Identification of regulatory mechanisms of the hepatic response to thermal injury
Yang, E., Maguire, T. J., Yarmush, M. L., Francois Berthiaume, B., & Androulakis, I. P. (2007) · Computers & Chemical Engineering · doi:10.1016/j.compchemeng.2007.02.009 · Cited by 5
Aloraini, A. (2011) · OpenGrey (Institut de l'Information Scientifique et Technique) · Cited by 5
A graph theoretical approach to experimental prioritization in genome-scale investigations
Grady, S. K., Peterson, K. A., Murray, S. A., Baker, E. J., Langston, M. A., & Chesler, E. J. (2024) · Mammalian Genome · doi:10.1007/s00335-024-10066-z · Cited by 5
Sun, Y., Yu, Q., Li, L., Mei, Z., Zhou, B., Liu, S., Pan, T., Wu, L. L., Lei, Y., Liu, L., et al. (2020) · Scientific Reports · doi:10.1038/s41598-020-75801-3 · Cited by 5
Martins, F. B., Aono, A. H., Moraes, A. D. C. L., Ferreira, R. C. U., Vilela, M. D. M., Pessoa‐Filho, M., Rodrigues‐Motta, M., Simeão, R. M., & de Souza, A. P. (2023) · Frontiers in Plant Science · doi:10.3389/fpls.2023.1303417 · Cited by 5
Peng, M., Müller, A., Kowalczyk, J. E., Kun, R. S., & de Vries, R. P. (2024) · Current Research in Biotechnology · doi:10.1016/j.crbiot.2024.100230 · Cited by 4
Holding, A. N., Cook, H., & Markowetz, F. M. (2019) · Biochimica et Biophysica Acta (BBA) - Gene Regulatory Mechanisms · doi:10.1016/j.bbagrm.2019.194441 · Cited by 4
A function-centric approach to the biological interpretation of microarray time-series.
Mínguez, P., Al‐Shahrour, F., & Dopazo, J. (2006) · PubMed · Cited by 4
Fas Death Pathway in Sarcomas Correlates with Epidermal Growth Factor Transcription
Joyner, D. E., Aboulafia, A. J., Damron, T. A., & Randall, R. L. (2008) · Clinical Orthopaedics and Related Research · doi:10.1007/s11999-008-0313-5 · Cited by 4
A Review on Applications of Graph Theory in Network Analysis of Biological Processes
Mohyedinbonab, E., Jamshidi, M. M., & Jin, Y.-F. (2014) · International Journal of Intelligent Computing in Medical Sciences & Image Processing · doi:10.1080/1931308x.2014.938492 · Cited by 4
Computational Selection of Transcriptomics Experiments Improves Guilt-by-Association Analyses
Bhat, P., Yang, H., Bögre, L., Devoto, A., & Paccanaro, A. (2012) · PLoS ONE · doi:10.1371/journal.pone.0039681 · Cited by 4
Gene Expression Analyses for Elucidating Mechanisms of Hormonal Action in Plants
Bassel, G. W., & Provart, N. J. (2008) · Methods in molecular biology · doi:10.1007/978-1-59745-477-3_3 · Cited by 4
Sánchez, J. A., Gil-Martínez, A. L., Cisterna‐García, A., García-Ruiz, S., Gómez-Pascual, A., Reynolds, R. H., Nalls, M. A., Hardy, J., Ryten, M., & Botía, J. A. (2021) · Bioinformatics · doi:10.1093/bioinformatics/btab175 · Cited by 4
Anderson, K. M., Collins, M. A., Chin, R., Ge, T., Rosenberg, M. D., & Holmes, A. J. (2018) · bioRxiv (Cold Spring Harbor Laboratory) · doi:10.1101/481036 · Cited by 4
Rosolen, R. R., Aono, A. H., Almeida, D. A., Filho, J. A. F., Horta, M. A. C., & de Souza, A. P. (2020) · bioRxiv (Cold Spring Harbor Laboratory) · doi:10.1101/2020.05.02.074344 · Cited by 4
Orduña, L., Li, M., Navarro‐Payá, D., Zhang, C., Santiago, A., Romero, P., Ramšak, Ž., Magon, G., Höll, J., Merz, P., et al. (2021) · bioRxiv (Cold Spring Harbor Laboratory) · doi:10.1101/2020.12.31.424746 · Cited by 4
Metadata
- Authors
- Wolfe, C. J., Kohane, I. S., & Butte, A. J.
- Affiliations
- Harvard University (US)
- Corresponding author
- Wolfe, Cecily J
- Venue
- BMC Bioinformatics
- Published
- 2005-09-14
- Volume
- 6
- Issue
- 1
- Pages
- 227-227
- ISSN
- 1471-2105 (ISSN-L)
- PMC
- PMC1239911
- OpenAlex
- W2159767718
- Cited by
- 422
- References
- 24
- Citations by year
- 2026: 5 · 2025: 10 · 2024: 12 · 2023: 14 · 2022: 28 · 2021: 39 · 2020: 40 · 2019: 29 · 2018: 24 · 2017: 19 · 2016: 17 · 2015: 20 · 2014: 18 · 2013: 20 · 2012: 20
- FWCI
- 5.90
- Type
- journal article
- Language
- en
- Open access
- gold
- doi.org
- Licence
- cc-by
- Locations
- BMC Bioinformatics (publishedVersion, cc-by)
- PubMed Central (publishedVersion, cc-by)
- PubMed (publishedVersion)
- Digital Access to Scholarship at Harvard (DASH) (Harvard University) (submittedVersion, cc-by)
- DOAJ (DOAJ: Directory of Open Access Journals) (submittedVersion)
- Funders
- Pediatric Endocrine Society
- National Institutes of Health (LM008748)
- National Institute of Diabetes and Digestive and Kidney Diseases (R01 DK62948, K12DK63696, K12DK063696, R01DK062948)
- U.S. National Library of Medicine (U54LM008748, 5T15 LM07092, 2 TA5 LM 07092-11, T15LM007092)
- Topics
- Life Sciences › Biochemistry, Genetics and Molecular Biology › Molecular Biology › Bioinformatics and Genomic Networks
- Health Sciences › Medicine › Health Informatics › Biomedical Text Mining and Ontologies
- Life Sciences › Biochemistry, Genetics and Molecular Biology › Molecular Biology › Gene expression and cancer classification
- Keywords
- guilt by association, gene co-expression network, Gene Ontology, gene function prediction, functional modules, probabilistic scoring, transcriptome, transcriptional regulation
- MeSH terms
- Animals, Bone Development, Feeding Behavior, Humans, Phylogeny, Probability, ROC Curve, Species Specificity, Reproducibility of Results, Receptors, Neuropeptide, Oligonucleotide Array Sequence Analysis, Gene Expression Profiling, Synteny, Mice, Rats
About these checks
Registry, retraction, Cites and statistics results are computed, not judged, with one exception: a printed reference that no index lists is read once by a model before it counts as a citation error. Claims are extracted by a model and kept only when their quote appears verbatim in the text; each cited source is then checked, with a model’s help, for whether it says what the claim relies on. Those verdicts can be wrong — read the claim’s quote and the cited source before relying on one.
Statistics and arithmetic are recomputed, not judged.
Confidence bands are shown only for fields calibrated on our annotated test set. None is calibrated yet, so no band is shown.
What counts as a claim ›How we measure confidence ›How we check this ›
Are you an author, or do you see a problem with this page? Request a review
