

The DOI matches its Crossref record; 38 of the 38 references it cites were found in a registry or an index.
TGF-β1 induces senescence of bone marrow mesenchymal stem cells via increase of mitochondrial ROS production
Open accessAbstract
BACKGROUND: Bone marrow derived mesenchymal stem cells (bmMSCs) are multipotent cells that can differentiate into diverse cell types, including cardiomyocytes. BmMSC-based transplantation is capable of repairing acute and chronic myocardial infarction. Prior to the transplantation, MSCs are usually induced in vitro by biological reagents and chemicals for directional differentiation. Transforming growth factor beta (TGF-β) is one of the most commonly used biological reagents for induction of cardiomyocyte differentiation of bmMSCs. Previous studies have shown that TGF-β induces senescence in several cell types. However, whether TGF-β affects senescence of bmMSCs has not been elucidated. The goal of this study was to investigate the effect of TGF-β1 on senescence of bmMSCs and the underlying mechanisms. RESULTS: We found that TGF-β1 increased activity of senescence-associated-galactosidase (SA-Gal) and production of mitochondrial reactive oxygen species (mtROS) in bmMSCs in a dose-dependent manner. TGF-β1 also significantly decreased expression of superoxide dismutase 2 (SOD2) and Id1, and increased expression of 4-Hydroxynonenal (4-HNE) subunits and p16 in bmMSCs in a dose-dependent manner. Pre-treatment with mtROS inhibitor acetyl-L-carnitine (ALCAR, 0.1 mM) significantly inhibited TGF-β1-induced mtROS production and SA-Gal activity. CONCLUSION: TGF-β1 can induce senescence of bmMSCs, which at least partially depends on mtROS production.
Overview
The claims and statistics of this paper haven’t been checked yet.
Run the check — free, no account needed. It reads the open-access text and checks the sources it cites.
Integrity signals
Registry
Cites
Statistics
Figures
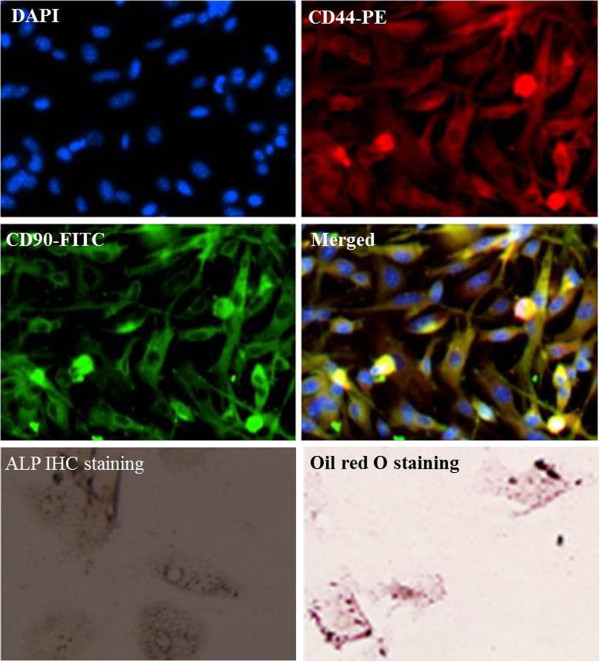
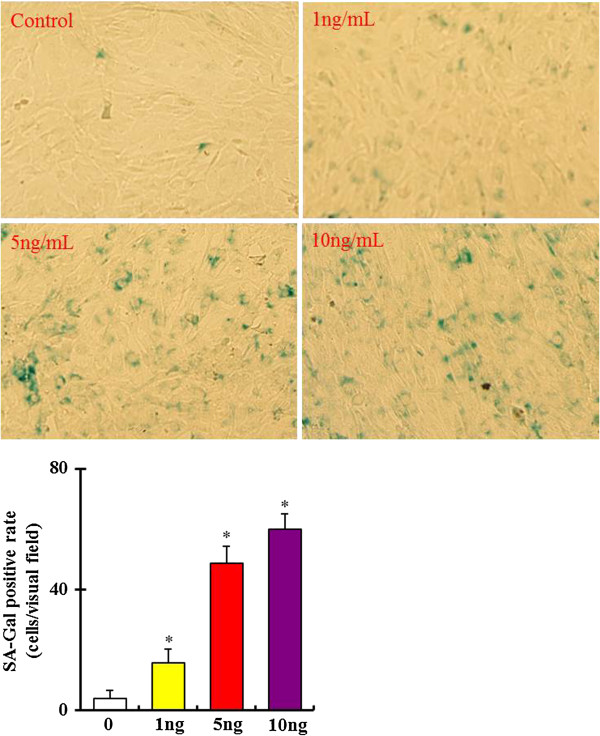
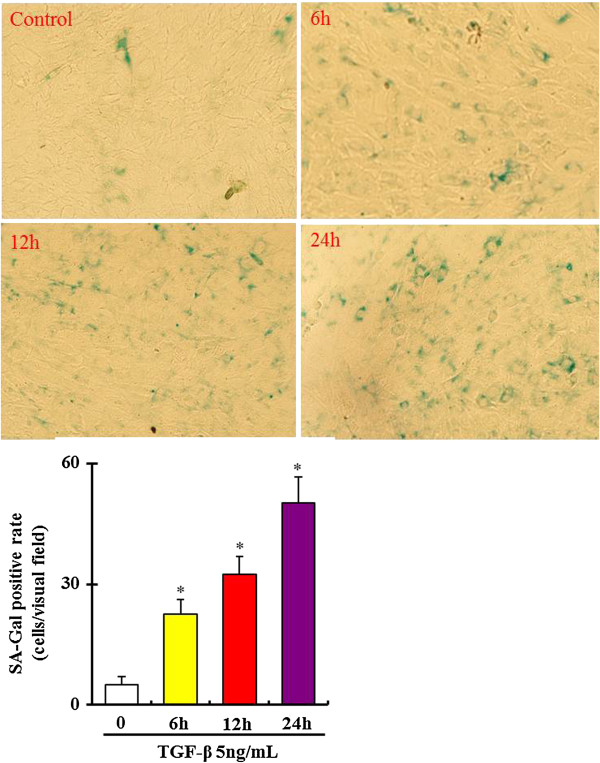
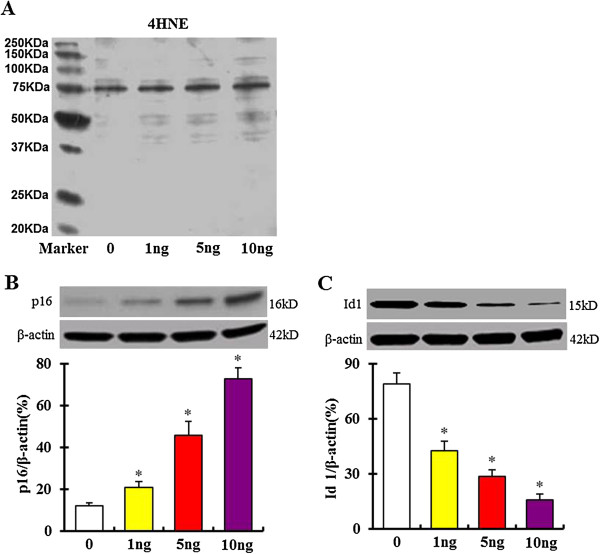
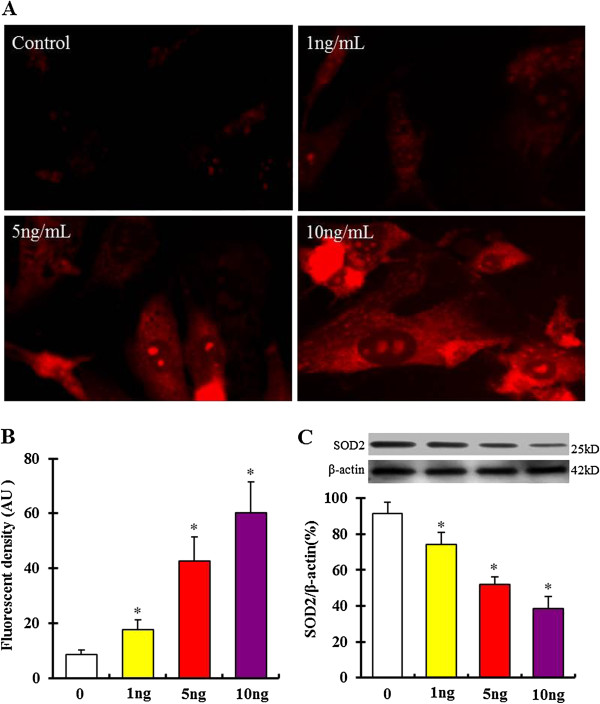
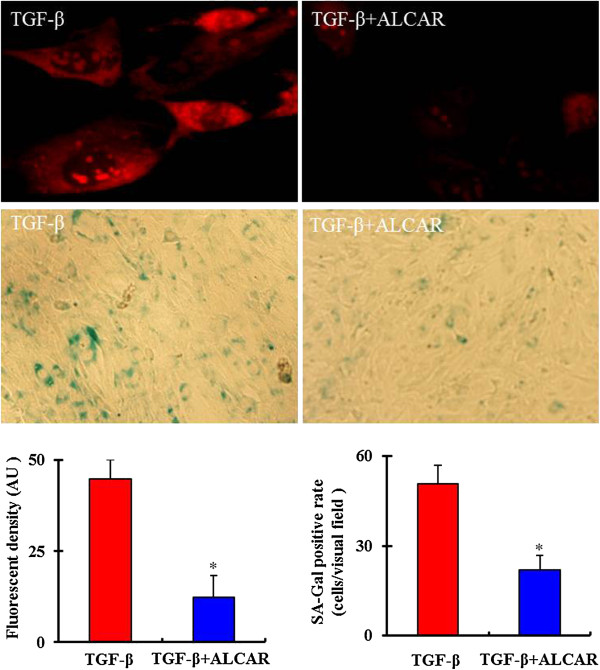
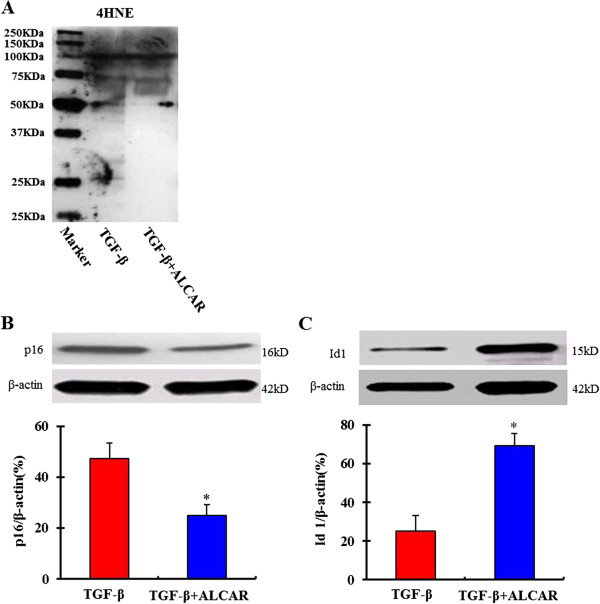
Verification
Claims the paper makes
The claims and statistics of this paper haven’t been checked yet.
Run the check — free, no account needed. It reads the open-access text and checks the sources it cites.
Claims other papers make about this one
Each is checked against this paper’s own text: does it say what the citing paper says it does?
In the citing paper
“mtROS has been shown as a key inducer for premature aging, and mtROS inhibitor reduces senescence in bone marrow mesenchymal stem cells (52, 53).”
From Impaired mitophagy leads to cigarette smoke stress‐induced cellular senescence: implications for chronic obstructive pulmonary disease (2015) · cites this paper as [52]
In the citing paper
“mtROS has been shown as a key inducer for premature aging, and mtROS inhibitor reduces senescence in bone marrow mesenchymal stem cells (52, 53).”
From Impaired mitophagy leads to cigarette smoke stress‐induced cellular senescence: implications for chronic obstructive pulmonary disease (2015) · cites this paper as [52]
Self-check
Percentages, sums and reported differences re-computed from the paper’s own numbers.
The self-check needs the paper’s full text.
Citations
Cites
Clearance of p16Ink4a-positive senescent cells delays ageing-associated disorders
Baker, D. J., Wijshake, T., Tchkonia, T., LeBrasseur, N. K., Childs, B. G., van de Sluis, B., Kirkland, J. L., & van Deursen, J. M. (2011) · Nature · doi:10.1038/nature10600 · Cited by 3,670 · cited 2×
“Expression of 4-HNE has been proved to induce cell senescence and organ aging [23,35,36].”
BackgroundDebacq-Chainiaux, F., Erusalimsky, J. D., Campisi, J., & Toussaint, O. (2009) · Nature Protocols · doi:10.1038/nprot.2009.191 · Cited by 1,668
Oxidative Stress, Mitochondrial Dysfunction, and Aging
Cui, H., Kong, Y., & Zhang, H. (2011) · Journal of Signal Transduction · doi:10.1155/2012/646354 · Cited by 1,076
A senescent cell bystander effect: senescence‐induced senescence
Nelson, G., Wordsworth, J., Wang, C., Jurk, D., Lawless, C., Martin‐Ruiz, C., & von Zglinicki, T. (2012) · Aging Cell · doi:10.1111/j.1474-9726.2012.00795.x · Cited by 755
Mitochondria-Ros Crosstalk in the Control of Cell Death and Aging
Marchi, S., Giorgi, C., Suski, J. M., Agnoletto, C., Bononi, A., Bonora, M., Marchi, E. D., Missiroli, S., Patergnani, S., Poletti, F., et al. (2011) · Journal of Signal Transduction · doi:10.1155/2012/329635 · Cited by 658
Stem cell differentiation requires a paracrine pathway in the heart
Behfar, A., Zingman, L. V., Hodgson, D. M., Rauzier, J., Kane, G. C., Terzic, A., & Pucéat, M. (2002) · The FASEB Journal · doi:10.1096/fj.02-0072com · Cited by 477
Williams, A. R., Hatzistergos, K. E., Addicott, B., McCall, F., Carvalho, D., Suncion, V. Y., Morales, A. R., Silva, J. D., Sussman, M. A., Heldman, A. W., et al. (2012) · Circulation · doi:10.1161/circulationaha.112.131110 · Cited by 395
Velarde, M. C., Flynn, J. M., Day, N. U., Melov, S., & Campisi, J. (2012) · Aging · doi:10.18632/aging.100423 · Cited by 299
Bone marrow and umbilical cord blood human mesenchymal stem cells: state of the art.
Malgieri, A., Kantzari, E., Patrizi, M. P., & Gambardella, S. (2010) · PubMed Central · Cited by 289
Human Mesenchymal Stem Cells Self-Renew and Differentiate According to a Deterministic Hierarchy
Sarugaser, R., Hanoun, L., Keating, A., Stanford, W. L., & Davies, J. E. (2009) · PLoS ONE · doi:10.1371/journal.pone.0006498 · Cited by 261
Research works printed but not linked: 1
- Lü Y, Wang HP, Liu B, Wu ZG, Huo YL, Gao CW: TGF-β1 induced bone marrow mesenchymal stem cells differentiate in cardiomyocyte-like cells. Acta Antomica Sinica. 2013, 44: 49-54.
Cited by
Sorted by citations
Reciprocal regulation of TGF-β and reactive oxygen species: A perverse cycle for fibrosis
Liu, R.-M., & Desai, L. P. (2015) · Redox Biology · doi:10.1016/j.redox.2015.09.009 · Cited by 725
TGF-β Signaling in Cellular Senescence and Aging-Related Pathology
Tominaga, K., & Suzuki, H. I. (2019) · International Journal of Molecular Sciences · doi:10.3390/ijms20205002 · Cited by 393
Mitochondrial oxidative stress in the tumor microenvironment and cancer immunoescape: foe or friend?
Kuo, C., Babuharisankar, A. P., Lin, Y., Lien, H., Lo, Y. K., Chou, H.-Y., Tangeda, V., Cheng, L.-C., Cheng, A. N., & Lee, A. Y. (2022) · Journal of Biomedical Science · doi:10.1186/s12929-022-00859-2 · Cited by 367
Connecting Mitochondria, Metabolism, and Stem Cell Fate
Wanet, A., Arnould, T., Najimi, M., & Renard, P. (2015) · Stem Cells and Development · doi:10.1089/scd.2015.0117 · Cited by 313
Mesenchymal Stem/Stromal Cell Senescence: Hallmarks, Mechanisms, and Combating Strategies
Weng, Z., Wang, Y., Ouchi, T., Liu, H., Qiao, X., Wu, C., Zhao, Z., Li, L., & Li, B. (2022) · Stem Cells Translational Medicine · doi:10.1093/stcltm/szac004 · Cited by 303
Ahmad, T., Sundar, I. K., Lerner, C. A., Gerloff, J., Tormos, A. M., Yao, H., & Rahman, I. (2015) · The FASEB Journal · doi:10.1096/fj.14-268276 · Cited by 264
Senescence of mesenchymal stem cells (Review)
Li, Y., Wu, Q., Wang, Y., Li, L., Bu, H., & Bao, J. (2017) · International Journal of Molecular Medicine · doi:10.3892/ijmm.2017.2912 · Cited by 280
Senile Osteoporosis: The Involvement of Differentiation and Senescence of Bone Marrow Stromal Cells
Qadir, A. S., Liang, S., Wu, Z., Chen, Z., Hu, L., & Qian, A. (2020) · International Journal of Molecular Sciences · doi:10.3390/ijms21010349 · Cited by 279
The role of mitochondrial dysfunction in age-related diseases
Lane, R. K., Hilsabeck, T., & Rea, S. L. (2015) · Biochimica et Biophysica Acta (BBA) - Bioenergetics · doi:10.1016/j.bbabio.2015.05.021 · Cited by 205
Mechanical stress determines the configuration of TGFβ activation in articular cartilage
Zhen, G., Guo, Q., Li, Y., Wu, C., Zhu, S., Wang, R., Guo, X.-D. E., Kim, B. C., Huang, J., Hu, Y., et al. (2021) · Nature Communications · doi:10.1038/s41467-021-21948-0 · Cited by 197
Reactive Oxygen Species and Mitochondrial Homeostasis as Regulators of Stem Cell Fate and Function
Tan, D. Q., & Suda, T. (2017) · Antioxidants and Redox Signaling · doi:10.1089/ars.2017.7273 · Cited by 183
Yan, W., Diao, S., & Fan, Z. (2021) · Stem Cell Research & Therapy · doi:10.1186/s13287-021-02194-z · Cited by 167
Li, Y., & Yao, H. (2016) · British Journal of Pharmacology · doi:10.1111/bph.13518 · Cited by 141
TGF-β and mesenchymal stromal cells in regenerative medicine, autoimmunity and cancer
Farias, V., Carrillo-Gálvez, A. B., Martı́n, F., & Anderson, P. O. (2018) · Cytokine & Growth Factor Reviews · doi:10.1016/j.cytogfr.2018.06.002 · Cited by 142
PINK1-PARK2-mediated mitophagy in COPD and IPF pathogeneses
Tsubouchi, K., Araya, J., & Kuwano, K. (2018) · Inflammation and Regeneration · doi:10.1186/s41232-018-0077-6 · Cited by 117
Shan, M., Qin, J., Jin, F., Han, X., Guan, H., Li, X., Zhang, J., Zhang, H., & Wang, Y. (2017) · Free Radical Biology and Medicine · doi:10.1016/j.freeradbiomed.2017.05.021 · Cited by 112
Self-citationOxidative Stress in Mesenchymal Stem Cell Senescence: Regulation by Coding and Noncoding RNAs
Vono, R., Jover, E., Spinetti, G., & Madeddu, P. R. (2017) · Antioxidants and Redox Signaling · doi:10.1089/ars.2017.7294 · Cited by 112
Sheppard, A. J., Barfield, A. M., Barton, R. S., & Dong, Y. (2022) · Frontiers in Bioengineering and Biotechnology · doi:10.3389/fbioe.2022.836764 · Cited by 105
Beyond Tumor Suppression: Senescence in Cancer Stemness and Tumor Dormancy
Triana-Martínez, F., Loza, M. I., & Domínguez, E. (2020) · Cells · doi:10.3390/cells9020346 · Cited by 102
Cellular senescence: from growth arrest to immunogenic conversion
Burton, D. G. A., & Faragher, R. (2015) · AGE · doi:10.1007/s11357-015-9764-2 · Cited by 99
Bindu, S., Pillai, V. B., Kanwal, A., Samant, S. A., Mutlu, G. M., Verdin, E. M., Dulin, N. O., & Gupta, M. P. (2016) · American Journal of Physiology-Lung Cellular and Molecular Physiology · doi:10.1152/ajplung.00188.2016 · Cited by 92
Szychlinska, M. A., Stoddart, M. J., D’Amora, U., Ambrosio, L., Alini, M., & Musumeci, G. (2017) · Tissue Engineering Part B Reviews · doi:10.1089/ten.teb.2017.0083 · Cited by 86
Preininger, M. K., & Kaufer, D. (2022) · International Journal of Molecular Sciences · doi:10.3390/ijms23116217 · Cited by 87
Cerrada, I., Ruiz‐Saurí, A., Carrero, R., Trigueros, C., Dorronsoro, A., Sánchez-Puelles, J.-M., Díez‐Juan, A., Montero, J., & Sepúlveda, P. (2012) · Stem Cells and Development · doi:10.1089/scd.2012.0340 · Cited by 85
Antioxidant Action of Carnitine: Molecular Mechanisms and Practical Applications
Surai, P. F. (2015) · Cited by 80
Dubon, M. J., Yu, J., Choi, S., & Park, K. (2018) · Journal of Cellular Physiology · doi:10.1002/jcp.25863 · Cited by 76
Lü, M., Xia, L., Liu, Y., Hochman, T., Bizzari, L., Aruch, D. B., Lew, J., Weinberg, R. S., Goldberg, J. D., & Hoffman, R. (2015) · Blood · doi:10.1182/blood-2014-12-618595 · Cited by 76
Zhang, D., Yan, B., Yu, S., Zhang, C., Wang, B., Wang, Y., Wang, J., Yuan, Z., Zhang, L., & Pan, J. (2015) · Oxidative Medicine and Cellular Longevity · doi:10.1155/2015/867293 · Cited by 75
Matsuda, S., Nakagawa, Y., Kitagishi, Y., Nakanishi, A., & Murai, T. (2018) · Cells · doi:10.3390/cells7050036 · Cited by 73
Influence of age on rat bone-marrow mesenchymal stem cells potential
Fafián‐Labora, J., Fernández‐Pernas, P., Fuentes, I. M., Santos, F. J. D. T., Oreiro, N., Sangiao‐Alvarellos, S., Mateos, J., & Arufe, M. C. (2015) · Scientific Reports · doi:10.1038/srep16765 · Cited by 71
Hu, C., Zhao, L., Peng, C., & Li, L. (2018) · Journal of Cellular and Molecular Medicine · doi:10.1111/jcmm.13835 · Cited by 64
Wang, Y., Chen, S., Yan, Z., & Pei, M. (2019) · Cell & Bioscience · doi:10.1186/s13578-018-0264-9 · Cited by 70
The Mechanism of Stem Cell Aging
Mi, L., Hu, J., Li, N., Gao, J., Huo, R., Peng, X., Zhang, N., Liu, Y., Zhao, H., Liu, R., et al. (2022) · Stem Cell Reviews and Reports · doi:10.1007/s12015-021-10317-5 · Cited by 64
Tang, Y. J., Luo, B., Deng, Z., Wang, B., Liu, F., Li, J., Shi, W., Xie, H., Hu, X., & Li, J. (2016) · PeerJ · doi:10.7717/peerj.1821 · Cited by 61
NK Cell Metabolism and TGFβ – Implications for Immunotherapy
Slattery, K., & Gardiner, C. M. (2019) · Frontiers in Immunology · doi:10.3389/fimmu.2019.02915 · Cited by 63
Comparative characteristic study from bone marrow-derived mesenchymal stem cells
Purwaningrum, M., Jamilah, N. S., Purbantoro, S. D., Sawangmake, C., & Nantavisai, S. (2021) · Journal of Veterinary Science · doi:10.4142/jvs.2021.22.e74 · Cited by 58
Li, Z.-Y., Chen, Z., Zhang, T., Wei, C., & Shi, W. (2016) · Aging · doi:10.18632/aging.101050 · Cited by 54
Role of proteoglycans in neuro-inflammation and central nervous system fibrosis
Heindryckx, F., & Li, J. (2018) · Matrix Biology · doi:10.1016/j.matbio.2018.01.015 · Cited by 50
An NIR‐Fluorophore‐Based Therapeutic Endoplasmic Reticulum Stress Inducer
Wang, Y., Luo, S., Zhang, C., Liao, X., Liu, T., Jiang, Z., Liu, D., Tan, X., Long, L., Wang, Y., et al. (2018) · Advanced Materials · doi:10.1002/adma.201800475 · Cited by 50
Lei, W., Lerner, C. A., Sundar, I. K., & Rahman, I. (2017) · Scientific Reports · doi:10.1038/srep43213 · Cited by 44
Regmi, S., Seo, Y., Ahn, J., Pathak, S., Acharya, S., Nguyen, T. T., Yook, S., Sung, J., Park, J., Kim, J. O., et al. (2021) · Biomaterials · doi:10.1016/j.biomaterials.2021.120752 · Cited by 42
Sahini, N., & Borlak, J. (2016) · Translational Research: The Journal of Laboratory and Clinical Medicine · doi:10.1016/j.trsl.2016.06.003 · Cited by 47
Novoa, B., Pereiro, P., López‐Muñoz, A., Varela, M., Forn‐Cuní, G., Anchelin, M., Dios, S., Romero, A., Martinez‐López, A., Medina‐Gali, R. M., et al. (2019) · Aging Cell · doi:10.1111/acel.13020 · Cited by 41
Revisiting MSC expansion from critical quality attributes to critical culture process parameters
Martin, C., Olmos, É., Collignon, M.-L., de Isla, N., Blanchard, F., Chevalot, I., Marc, A., & Guédon, E. (2016) · Process Biochemistry · doi:10.1016/j.procbio.2016.04.017 · Cited by 41
High OCT4 and Low p16 INK4A Expressions Determine In Vitro Lifespan of Mesenchymal Stem Cells
Piccinato, C. D. A., Sertie, A. L., Torres, N., Ferretti, M., & Antonioli, E. (2015) · Stem Cells International · doi:10.1155/2015/369828 · Cited by 42
Converging Paths of Pulmonary Arterial Hypertension and Cellular Senescence
van der Feen, D. E., Berger, R. M. F., & Bartelds, B. (2019) · American Journal of Respiratory Cell and Molecular Biology · doi:10.1165/rcmb.2018-0329tr · Cited by 38
Lee, S. S., Vũ, T. T., Weiss, A. S., & Yeo, G. C. (2023) · European Journal of Cell Biology · doi:10.1016/j.ejcb.2023.151331 · Cited by 43
Blahnová, V. H., Daňková, J., Rampichová, M., & Filová, E. (2020) · Bone and Joint Research · doi:10.1302/2046-3758.97.bjr-2019-0183.r2 · Cited by 39
Zhang, F., Peng, W., Zhang, J., Dong, W., Yuan, D., Zheng, Y., & Wang, Z. (2019) · Journal of Cellular Biochemistry · doi:10.1002/jcb.29298 · Cited by 38
Self-citationPreininger, M. K., Zaytseva, D., Lin, J. M., & Kaufer, D. (2023) · Aging Cell · doi:10.1111/acel.13747 · Cited by 36
Senescence Alterations in Pulmonary Hypertension
Roger, I., Milara, J., Belhadj, N., & Cortijo, J. (2021) · Cells · doi:10.3390/cells10123456 · Cited by 41
Chen, J., & Chang, R. (2022) · Frontiers in Pharmacology · doi:10.3389/fphar.2022.888563 · Cited by 37
Salkın, H., Gönen, Z. B., Ergen, E., Bahar, D., & Çetın, M. (2018) · International Journal of Stem Cells · doi:10.15283/ijsc18051 · Cited by 33
Amaroli, A., Pasquale, C., Zekiy, A. O., Benedicenti, S., Marchegiani, A., Sabbieti, M. G., & Agas, D. (2022) · Journal of Tissue Engineering · doi:10.1177/20417314221110192 · Cited by 29
Bai, H., Gao, Y., Hoyle, D. L., Cheng, T., & Wang, Z. Z. (2016) · Stem Cells Translational Medicine · doi:10.5966/sctm.2016-0089 · Cited by 30
Mitochondria-Mediated Oxidative Stress: Old Target for New Drugs
Lyakhovich, A., & Graifer, D. M. (2015) · Current Medicinal Chemistry · doi:10.2174/0929867322666150729114036 · Cited by 28
Mikuła‐Pietrasik, J., Rutecki, S., & Książek, K. (2022) · Cellular and Molecular Life Sciences · doi:10.1007/s00018-022-04236-y · Cited by 27
Krajewska–Włodarczyk, M., Owczarczyk-Saczonek, A. B., Placek, W. J., Osowski, A., & Wojtkiewicz, J. (2018) · International Journal of Molecular Sciences · doi:10.3390/ijms19020623 · Cited by 27
Mikuła‐Pietrasik, J., Uruski, P., Aniukiewicz, K., Sosińska, P., Krasiński, Z., Tykarski, A., & Książek, K. (2016) · Oxidative Medicine and Cellular Longevity · doi:10.1155/2016/2069290 · Cited by 26
Zhang, S., Zeng, N., Alowayed, N., Singh, Y., Cheng, A., Lang, F. J. W., & Salker, M. S. (2017) · PLoS ONE · doi:10.1371/journal.pone.0183681 · Cited by 22
Managing odds in stem cells: insights into the role of mitochondrial antioxidant enzyme MnSOD
Sheshadri, P., & Kumar, A. (2016) · Free Radical Research · doi:10.3109/10715762.2016.1155708 · Cited by 21
Kim, R., Song, B., Kim, M., Kim, W. J., Lee, H. W., Lee, M. Y., Kim, J. M., & Chang, W. (2020) · BMB Reports · doi:10.5483/bmbrep.2020.53.11.177 · Cited by 20
Guo, G., Watterson, S., Zhang, S., Bjourson, A. J., McGilligan, V., Peace, A. J., & Singh, T. (2021) · Ageing Research Reviews · doi:10.1016/j.arr.2021.101363 · Cited by 22
Mazzella, M., Walker, K., Cormier, C., Kapanowski, M., Ishmakej, A., Saifee, A., Govind, Y., & Chaudhry, G. R. (2023) · Stem Cell Research & Therapy · doi:10.1186/s13287-023-03533-y · Cited by 18
Shuai, B., Shen, L., Zhu, R., & Zhou, P. (2015) · BMC Complementary and Alternative Medicine · doi:10.1186/s12906-015-0777-2 · Cited by 19
González‐Gualda, E., Reinius, M., Macías, D., Morsli, S., Ge, J., Olan, I., Martín, J. E., Ou, H., Hartono, M., Puerto-Camacho, M. P., et al. (2026) · Nature Aging · doi:10.1038/s43587-025-01054-2 · Cited by 19
Thamarath, S. S., Tee, C. A., Neo, S. H., Yang, D., Othman, R. B., Boyer, L. A., & Han, J. (2023) · Stem Cells Translational Medicine · doi:10.1093/stcltm/szad014 · Cited by 19
Joo, H. J., Ma, D. J., Hwang, J. S., & Shin, Y. J. (2020) · Antioxidants · doi:10.3390/antiox9111085 · Cited by 17
Che, L., Zhu, C., Huang, L., Xu, H., Ma, X., Luo, X., He, H., Zhang, T., & Wang, N. (2023) · Foods · doi:10.3390/foods12051075 · Cited by 17
A Mesenchymal stem cell Aging Framework, from Mechanisms to Strategies
Zhao, H., Zhao, H., & Ji, S. (2024) · Stem Cell Reviews and Reports · doi:10.1007/s12015-024-10732-4 · Cited by 17
Central metabolism of functionally heterogeneous mesenchymal stromal cells
Barilani, M., Palorini, R., Votta, G., Piras, R., Buono, G., Grassi, M., Bollati, V., Chiaradonna, F., & Lazzari, L. (2019) · Scientific Reports · doi:10.1038/s41598-019-51937-9 · Cited by 17
Jiang, C., Chen, H., Kang, Y., He, X., Huang, J., Lu, T., Sui, X., Chen, H., Xiao, J., Zhang, J., et al. (2023) · Cell Death Discovery · doi:10.1038/s41420-023-01546-3 · Cited by 15
Zhang, F., Ren, T., Wu, J., & Niu, J. (2015) · PubMed · Cited by 15
Self-citationChitosan delaying human fibroblast senescence through downregulation of TGF-β signaling pathway
Tsai, C.-W., Chiang, I., Wang, J., & Young, T. (2017) · Artificial Cells Nanomedicine and Biotechnology · doi:10.1080/21691401.2017.1394873 · Cited by 16
Carrillo-Gálvez, A. B., Gálvez-Peisl, S., González-Correa, J. E., Haro-Carrillo, M., Ayllón, V., Carmona‐Sáez, P., Ramos–Mejía, V., Galindo‐Moreno, P., Cara, F. E., Granados-Principal, S. M., et al. (2020) · Stem Cells Translational Medicine · doi:10.1002/sctm.19-0372 · Cited by 13
Gurung, S., Ulrich, D., Sturm, M., Rosamilia, A., Werkmeister, J. A., & Gargett, C. E. (2020) · Journal of Personalized Medicine · doi:10.3390/jpm10040261 · Cited by 14
Zhang, F., Ren, T., & Wu, J. (2015) · Experimental and Therapeutic Medicine · doi:10.3892/etm.2015.2590 · Cited by 13
Self-citationÇağnan, I., ÖZCAN, A. G., Aerts‐Kaya, F., Ameziane, N., Kuşkonmaz, B., Dorsman, J. C., Gümrük, F., & Uçkan, D. (2017) · Stem Cell Reviews and Reports · doi:10.1007/s12015-017-9794-5 · Cited by 14
Zhao, X., An, X., Zhu, X., Jiang, Y., Zhai, Y., Zhang, S., Cai, N., Tang, B., Li, Z., & Zhang, X. (2018) · Journal of Experimental Zoology Part B Molecular and Developmental Evolution · doi:10.1002/jez.b.22836 · Cited by 13
Zare, E., Hosseini, E. S., Azad, F. S., Javid, A., Javazm, R. R., Abessi, P., Montazeri, F., & Hoseini, S. M. (2025) · Histochemistry and Cell Biology · doi:10.1007/s00418-025-02364-7 · Cited by 10
Chan, W. L., Bucher, C. H., Goldes, J., Ma, A. C., Steiner, M., Willie, B. M., Mundlos, S., & Kornak, U. (2024) · Aging Cell · doi:10.1111/acel.14322 · Cited by 10
Evaluating effects of L-carnitine on human bone-marrow-derived mesenchymal stem cells
Fujisawa, K., Takami, T., Fukui, Y., Quintanilha, L. F., Matsumoto, T., Yamamoto, N., & Sakaida, I. (2017) · Cell and Tissue Research · doi:10.1007/s00441-017-2569-0 · Cited by 9
Alterations of receptors and insulin-like growth factor binding proteins in senescent cells
Matuszewska, J., Krawiec, A., Radziemski, A., Uruski, P., Tykarski, A., Mikuła‐Pietrasik, J., & Książek, K. (2024) · European Journal of Cell Biology · doi:10.1016/j.ejcb.2024.151438 · Cited by 8
Stromal Co-Cultivation for Modeling Breast Cancer Dormancy in the Bone Marrow
Wieder, R. (2022) · Cancers · doi:10.3390/cancers14143344 · Cited by 8
Lu, Z.-Y., Guo, C.-L., Yang, B., Yao, Y., Yang, Z.-J., Gong, Y.-X., Yang, J.-Y., Dong, W.-Y., Yang, J., Yang, H.-B., et al. (2022) · Journal of Cardiovascular Pharmacology · doi:10.1097/fjc.0000000000001250 · Cited by 7
Choi, D. H., Lee, K. E., & Park, Y. S. (2022) · Stem Cells International · doi:10.1155/2022/4302992 · Cited by 6
Shahani, P., Mahadevan, A., & Datta, I. (2021) · Biochimica et Biophysica Acta (BBA) - Molecular Basis of Disease · doi:10.1016/j.bbadis.2021.166187 · Cited by 6
Lgr4 Expression in Osteoblastic Cells Is Suppressed by Hydrogen Peroxide Treatment
Mahasarakham, C. P. N., Izu, Y., Nishimori, K., Izumi, Y., Noda, M., & Ezura, Y. (2016) · Journal of Cellular Physiology · doi:10.1002/jcp.25684 · Cited by 6
Çağnan, I., Coşgun, E., Konu, Ö., Uçkan, D., & ÖZCAN, A. G. (2018) · Molecular Biology Reports · doi:10.1007/s11033-018-4522-z · Cited by 6
Panahipour, L., Biasi, M. D., Bokor, T. S., Thajer, A., Haiden, N., & Gruber, R. (2020) · Scientific Reports · doi:10.1038/s41598-020-62390-4 · Cited by 5
Itokazu, M., Takehara, T., Toriumi, K., Iwawaki, N., Mori, T., Ondoera, Y., Higashimoto, Y., Goto, K., Yamada, H., & Teramura, T. (2025) · Scientific Reports · doi:10.1038/s41598-025-06982-y · Cited by 4
TGF‑β1 combined with Sal‑B promotes cardiomyocyte differentiation of rat mesenchymal stem cells
Lv, Y., Liu, B., Liu, Y., Wang, H., & Wang, H. (2018) · Experimental and Therapeutic Medicine · doi:10.3892/etm.2018.6105 · Cited by 4
Amelioration of premature aging in Werner syndrome stem cells by targeting SHIP/AKT pathway
Tam, H.-Y., Liu, J., Yiu, T.-C., Leung, A. O.-W., Li, C., Gu, S., Rennert, O. M., Huang, B., & Cheung, H. (2025) · Cell & Bioscience · doi:10.1186/s13578-025-01355-4 · Cited by 3
Chen, H., & Fu, X. (2018) · Experimental and Therapeutic Medicine · doi:10.3892/etm.2018.6667 · Cited by 3
Hakim, S. G., von der Gracht, A., Pries, R., Rades, D., & Steller, D. (2023) · Journal of Cranio-Maxillofacial Surgery · doi:10.1016/j.jcms.2023.06.008 · Cited by 2
ATP-binding cassette B8 prevents endothelial dysfunction and atherosclerosis
Chaker, A. B., Rinaldi, L., Gillham, O., Pérez‐Ternero, C., Bosseboeuf, E., Dyson, N., Smith, D. S., Ardehali, H., Fantin, A., Chikh, A., et al. (2025) · Redox Biology · doi:10.1016/j.redox.2025.103903 · Cited by 2
Yamamoto, K., Kishida, T., Yamamoto, T., Sowa, Y., Seki, M., & Mazda, O. (2025) · Stem Cell Research & Therapy · doi:10.1186/s13287-025-04605-x · Cited by 2
González‐Gualda, E., Macías, D., Morsli, S., Martín, J., Ou, H., Denholm, M., Olan, I., Hoffmann, R. J., Dane, M. A., Veroutis, D., et al. (2022) · bioRxiv (Cold Spring Harbor Laboratory) · doi:10.1101/2022.08.01.502019 · Cited by 2
Cheng, J., Tang, G., Wang, Z., Ding, Y., Zhao, J., Zhang, Y., Tian, H., Wang, G., Shi, C., Gao, J., et al. (2026) · Environment & Health · doi:10.1021/envhealth.5c00566 · Cited by 1
Shibanuma, M., Mori, K., & Ishikawa, F. (2016) · Journal of Cell Signaling · doi:10.4172/2576-1471.1000106 · Cited by 1
Metadata
- Authors
- Wu, J., Niu, J., Li, X., Wang, X., Guo, Z., & Zhang, F.
- Affiliations
- Henan Medical University (CN)
- Corresponding author
- Zhang, Fenxi
- Venue
- BMC Developmental Biology
- Published
- 2014-05-18
- Volume
- 14
- Issue
- 1
- Pages
- 21-21
- ISSN
- 1471-213X (ISSN-L)
- PMC
- PMC4031602
- OpenAlex
- W2080878133
- Cited by
- 120
- References
- 38
- Citations by year
- 2026: 5 · 2025: 7 · 2024: 8 · 2023: 10 · 2022: 13 · 2021: 7 · 2020: 8 · 2019: 7 · 2018: 15 · 2017: 14 · 2016: 11 · 2015: 14
- FWCI
- 6.51
- Type
- journal article
- Language
- en
- Open access
- hybrid
- doi.org
- Licence
- cc-by
- Locations
- BMC Developmental Biology (publishedVersion, cc-by)
- Europe PMC (PubMed Central) (publishedVersion, cc-by)
- PubMed Central (publishedVersion, cc-by)
- PubMed (publishedVersion)
- Funders
- National Natural Science Foundation of China (81370428)
- Topics
- Life Sciences › Biochemistry, Genetics and Molecular Biology › Cell Biology › Mesenchymal stem cell research
- Life Sciences › Biochemistry, Genetics and Molecular Biology › Cell Biology › Telomeres, Telomerase, and Senescence
- Life Sciences › Biochemistry, Genetics and Molecular Biology › Molecular Biology › TGF-β signaling in diseases
- Keywords
- TGF-β1, bone marrow mesenchymal stem cells, cellular senescence, mitochondrial reactive oxygen species, manganese superoxide dismutase, Id1, 4-hydroxynonenal, p16, acetyl-L-carnitine, cardiomyocyte differentiation, myocardial infarction
- MeSH terms
- Superoxide Dismutase 2, Acetylcarnitine, Aldehydes, Animals, Bone Marrow Cells, Cells, Cultured, Dose-Response Relationship, Drug, Galactosidases, Mice, Inbred C57BL, Microscopy, Fluorescence, Mitochondria, Osteogenesis, Superoxide Dismutase, Vitamin B Complex, Blotting, Western, Cellular Senescence, Reactive Oxygen Species, Cyclin-Dependent Kinase Inhibitor p16, Adipogenesis, Mice, Inhibitor of Differentiation Protein 1, Transforming Growth Factor beta1, Mesenchymal Stem Cells
About these checks
Registry, retraction, Cites and statistics results are computed, not judged, with one exception: a printed reference that no index lists is read once by a model before it counts as a citation error. Claims are extracted by a model and kept only when their quote appears verbatim in the text; each cited source is then checked, with a model’s help, for whether it says what the claim relies on. Those verdicts can be wrong — read the claim’s quote and the cited source before relying on one.
Statistics and arithmetic are recomputed, not judged.
Confidence bands are shown only for fields calibrated on our annotated test set. None is calibrated yet, so no band is shown.
What counts as a claim ›How we measure confidence ›How we check this ›
Are you an author, or do you see a problem with this page? Request a review
