

Evolutionary constraints on yeast protein size
Open accessThe DOI matches its Crossref record; 43 of the 43 references it cites were found in a registry or an index.
Abstract
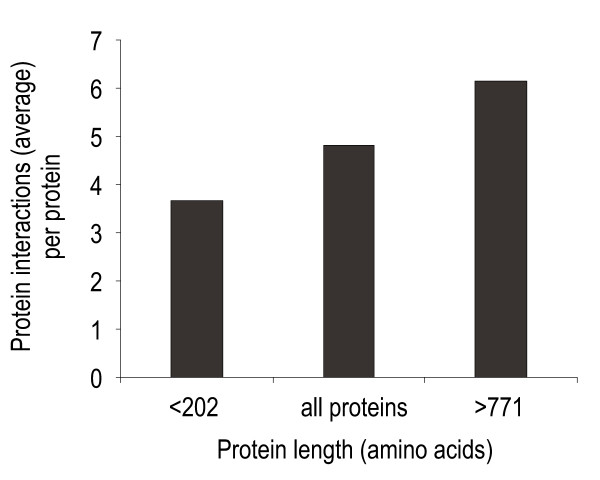
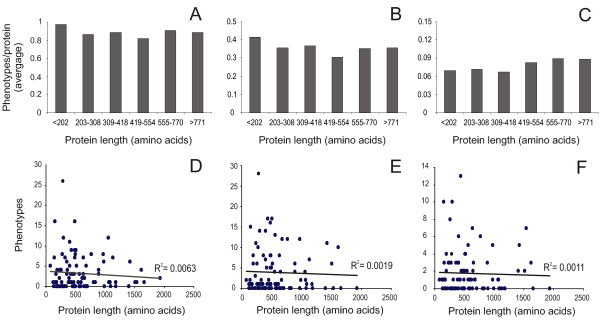
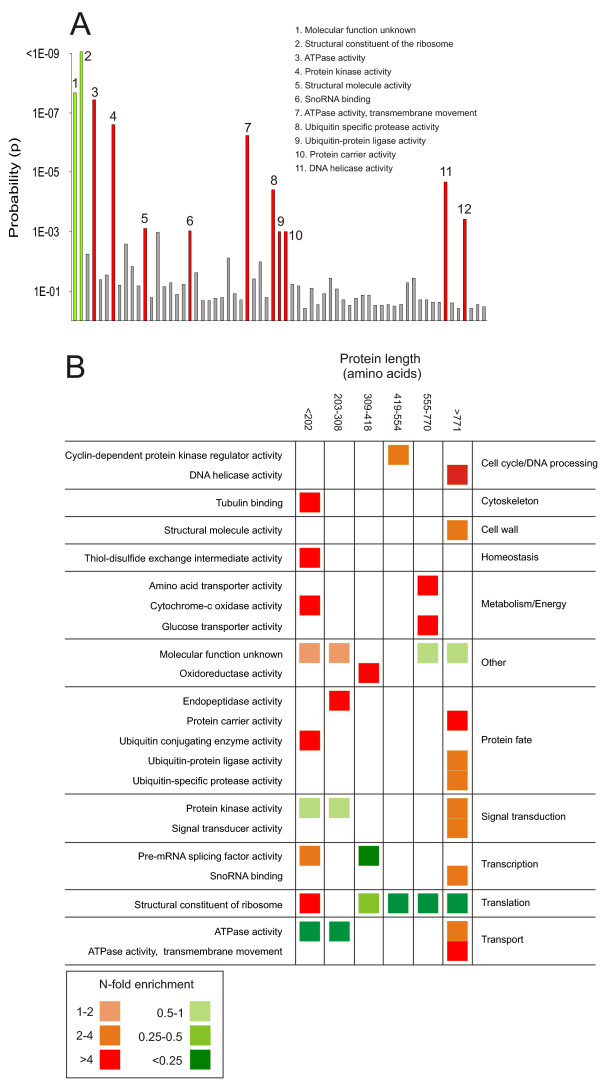
BACKGROUND: Despite a strong evolutionary pressure to reduce genome size, proteins vary in length over a surprisingly wide range also in very compact genomes. Here we investigated the evolutionary forces that act on protein size in the yeast Saccharomyces cerevisiae utilizing a system-wide bioinformatics approach. Data on yeast protein size was compared to global experimental data on protein expression, phenotypic pleiotropy, protein-protein interactions, protein evolutionary rate and biochemical classification. RESULTS: Comparing the experimentally determined abundance of individual proteins, highly expressed proteins were found to be consistently smaller than lowly expressed proteins, in accordance with the biosynthetic cost minimization hypothesis. Yeast proteins able to maintain a high expression level despite a large size tended to belong to a very distinct set of protein families, notably nuclear transport and translation initiation/elongation. Large proteins have significantly more protein-protein interactions than small proteins, suggesting that a requirement for multiple interaction domains may constitute a positive selective pressure for large protein size in yeast. The higher frequency of protein-protein interactions in large proteins was not accompanied by a higher phenotypic pleiotropy. Hence, the increase in interactions may not reflect an increase in function differentiation. Proteins of different sizes also evolved at similar rates. Finally, whereas the biological process involved was found to have little influence on protein size the biochemical activity exerted by the protein represented a dominant factor. More than one third of all biochemical activity classes were enriched in one or more size intervals. CONCLUSION: In yeast, there is an inverse relationship between protein size and protein expression such that highly expressed proteins tend to be of smaller size. Also, protein size is moderately affected by protein connectivity and strongly affected by biochemical activity. Phenotypic pleiotropy does not seem to affect protein size.
Overview
The claims and statistics of this paper haven’t been checked yet.
Free: it reads the open-access text and checks the first 5 claims that cite a source we can check. Create a free account to check every claim.
Integrity signals
Registry
Cites
Statistics
Figures

Verification
Claims the paper makes
The claims and statistics of this paper haven’t been checked yet.
Free: it reads the open-access text and checks the first 5 claims that cite a source we can check. Create a free account to check every claim.
Claims other papers make about this one
Each is checked against this paper’s own text: does it say what the citing paper says it does?
In the citing paper
“This dependence was observed in earlier studies and is thought to reflect the evolutionary advantage of decreasing the size of abundant proteins for reasons of biosynthetic cost (38).”
From A “Proteomic Ruler” for Protein Copy Number and Concentration Estimation without Spike-in Standards (2014) · cites this paper as [38]
Self-check
Percentages, sums and reported differences re-computed from the paper’s own numbers.
The self-check needs the paper’s full text.
Citations
Cites
Initial sequencing and comparative analysis of the mouse genome
Mouse Genome Sequencing Consortium (2002) · Nature · doi:10.1038/nature01262 · Cited by 7,187 · cited 1×
“In lower organisms such as yeast where intergenic DNA comprise less than 30% of the genome [13] – as opposed to 98% in human [14] – it may be argued that reducing the size of coding DNA significantly affects genome size.”
BackgroundLethality and centrality in protein networks
Jeong, H., Mason, S. P., Barabási, A.-L., & Oltvai, Z. N. (2001) · Nature · doi:10.1038/35075138 · Cited by 5,287
Functional Characterization of the S. cerevisiae Genome by Gene Deletion and Parallel Analysis
Winzeler, E. A., Shoemaker, D. D., Astromoff, A., Liang, H., Anderson, K., Andre, B., Bangham, R., Benito, R., Boeke, J. D., Bussey, H., et al. (1999) · Science · doi:10.1126/science.285.5429.901 · Cited by 3,953 · cited 1×
“cerevisiae open reading frame has been completed [26], enabling the evaluation of this hypothesis.”
MethodGlobal analysis of protein expression in yeast
Ghaemmaghami, S., Huh, W.-K., Bower, K., Howson, R. W., Belle, A., Dephoure, N., O'Shea, E. K., & Weissman, J. S. (2003) · Nature · doi:10.1038/nature02046 · Cited by 3,750
Molecular Chaperones in the Cytosol: from Nascent Chain to Folded Protein
Hartl, F. U., & Hayer-Hartl, M. (2002) · Science · doi:10.1126/science.1068408 · Cited by 3,347
Selfish DNA: the ultimate parasite
Orgel, L. E., & Crick, F. H. C. (1980) · Nature · doi:10.1038/284604a0 · Cited by 2,156
The economics of ribosome biosynthesis in yeast
Warner, J. R. (1999) · Trends in Biochemical Sciences · doi:10.1016/s0968-0004(99)01460-7 · Cited by 1,933
Selfish genes, the phenotype paradigm and genome evolution
Doolittle, W. F., & Sapienza, C. (1980) · Nature · doi:10.1038/284601a0 · Cited by 1,829
Sequencing and comparison of yeast species to identify genes and regulatory elements
Kellis, M., Patterson, N., Endrizzi, M., Birren, B., & Lander, E. S. (2003) · Nature · doi:10.1038/nature01644 · Cited by 1,753
Finding Functional Features in Saccharomyces Genomes by Phylogenetic Footprinting
Cliften, P., Sudarsanam, P., Desikan, A., Fulton, L., Fulton, B., Majors, J., Waterston, R., Cohen, B. A., & Johnston, M. (2003) · Science · doi:10.1126/science.1084337 · Cited by 815
Research works printed but not linked: 1
- Grotkopp E Stoltenberg R Rejmanek M Rost TL The effect of genome size on invasiveness American Journal of Botany 1998 85 34
Cited by
Global signatures of protein and mRNA expression levels
de Sousa Abreu, R., Penalva, L. O., Marcotte, E. M., & Vogel, C. (2009) · Molecular BioSystems · doi:10.1039/b908315d · Cited by 1,248
A “Proteomic Ruler” for Protein Copy Number and Concentration Estimation without Spike-in Standards
Wiśniewski, J. R., Hein, M. Y., Cox, J., & Mann, M. (2014) · Molecular & Cellular Proteomics · doi:10.1074/mcp.m113.037309 · Cited by 690
Wiśniewski, J. R., & Rakus, D. (2014) · Journal of Proteomics · doi:10.1016/j.jprot.2014.07.012 · Cited by 222
A Network of Multiple Regulatory Layers Shapes Gene Expression in Fission Yeast
Lackner, D. H., Beilharz, T. H., Marguerat, S., Mata, J., Watt, S., Schubert, F., Preiss, T., & Bähler, J. (2007) · Molecular Cell · doi:10.1016/j.molcel.2007.03.002 · Cited by 204
“In budding yeast, mRNA length and protein size are inversely correlated with ribosome density and protein levels, respectively (Arava et al., 2003; Warringer and Blomberg, 2006), and proteins present at high copies per mRNA tend to be of low molecular weight (Lu et al., 2007).”
Guo, Y. (2013) · The Plant Journal · doi:10.1111/tpj.12089 · Cited by 162
Metadata
- Authors
- Warringer
- Venue
- BMC Evolutionary Biology
- Published
- 2006
- Volume
- 6
- Issue
- 1
- Pages
- 61
- ISSN
- 1471-2148 (ISSN-L)
- PMC
- PMC1560397
- OpenAlex
- W1540866880
- Cited by
- 71
- References
- 41
- Citations by year
- 2025: 3 · 2024: 2 · 2023: 1 · 2022: 1 · 2021: 1 · 2020: 2 · 2019: 2 · 2018: 1 · 2017: 4 · 2016: 1 · 2015: 4 · 2014: 5 · 2013: 3 · 2012: 9
- FWCI
- 3.80
- Type
- journal article
- Language
- en
- Open access
- gold
- doi.org
- Licence
- cc-by
- Locations
- BMC Evolutionary Biology (publishedVersion, cc-by)
- PubMed (publishedVersion)
- DOAJ (DOAJ: Directory of Open Access Journals) (submittedVersion, cc-by-sa)
- Topics
- Life Sciences › Biochemistry, Genetics and Molecular Biology › Genetics › Evolution and Genetic Dynamics
- Life Sciences › Biochemistry, Genetics and Molecular Biology › Molecular Biology › Fungal and yeast genetics research
- Life Sciences › Biochemistry, Genetics and Molecular Biology › Molecular Biology › Bioinformatics and Genomic Networks
- Keywords
- protein size, Saccharomyces cerevisiae, protein expression, protein-protein interaction, protein evolutionary rate, biochemical activity, protein connectivity, genome size reduction
- MeSH terms
- Amino Acid Sequence, Molecular Sequence Data, Protein Binding, Saccharomyces cerevisiae, Gene Expression Regulation, Fungal, Genome, Fungal, Evolution, Molecular, Saccharomyces cerevisiae Proteins
About these checks
Registry, retraction, Cites and statistics results are computed, not judged, with one exception: a printed reference that no index lists is read once by a model before it counts as a citation error. Claims are extracted by a model and kept only when their quote appears verbatim in the text; each cited source is then checked, with a model’s help, for whether it says what the claim relies on. Those verdicts can be wrong — read the claim’s quote and the cited source before relying on one.
Statistics and arithmetic are recomputed, not judged.
Confidence bands are shown only for fields calibrated on our annotated test set. None is calibrated yet, so no band is shown.
What counts as a claim ›How we measure confidence ›How we check this ›
Are you an author, or do you see a problem with this page? Request a review
How to cite
Cite CoChat for the checks on this page, and the paper for its own findings.
- This page
- CoChat. (2026). Citation check: Evolutionary constraints on yeast protein size. https://app.cochat.ai/papers/10.1186/1471-2148-6-61
- The paper
- Warringer. (2006). Evolutionary constraints on yeast protein size. BMC Evolutionary Biology. https://doi.org/10.1186/1471-2148-6-61
Data sources
Bibliographic data: Semantic Scholar, OpenAlex, Crossref.
Contains information from the Semantic Scholar Academic Graph Datasets, made available under the ODC Attribution License (ODC-BY 1.0).
Semantic Scholar’s data is described in: Kinney, R., et al. (2023). The Semantic Scholar Open Data Platform. arXiv:2301.10140.
