

The DOI matches its Crossref record; 64 of the 65 references it cites were found in a registry or an index.
Oil accumulation mechanisms of the oleaginous microalga Chlorella protothecoides revealed through its genome, transcriptomes, and proteomes
Open accessAbstract
BACKGROUND: Microalgae-derived biodiesel is a promising substitute for conventional fossil fuels. In particular, the green alga Chlorella protothecoides sp. 0710 is regarded as one of the best candidates for commercial manufacture of microalgae-derived biofuel. This is due not only to its ability to live autotrophically through photosynthesis, but also to its capacity to produce a large amount of biomass and lipid through fermentation of glucose. However, until the present study, neither its genome sequence nor the platform required for molecular manipulations were available. RESULTS: We generated a draft genome for C. protothecoides, and compared its genome size and gene content with that of Chlorella variabilis NC64A and Coccomyxa subellipsoidea C-169. This comparison revealed that C. protothecoides has a reduced genome size of 22.9 Mbp, about half that of its close relatives. The C. protothecoides genome encodes a smaller number of genes, fewer multi-copy genes, fewer unique genes, and fewer genome rearrangements compared with its close relatives. In addition, three Chlorella-specific hexose-proton symporter (HUP)-like genes were identified that enable the consumption of glucose and, consequently, heterotrophic growth. Furthermore, through comparative transcriptomic and proteomic studies, we generated a global perspective regarding the changes in metabolic pathways under autotrophic and heterotrophic growth conditions. Under heterotrophic conditions, enzymes involved in photosynthesis and CO2 fixation were almost completely degraded, either as mRNAs or as proteins. Meanwhile, the cells were not only capable of quickly assimilating glucose but also showed accelerated glucose catabolism through the upregulation of glycolysis and the tricarboxylic acid (TCA) cycle. Moreover, the rapid synthesis of pyruvate, upregulation of most enzymes involved in fatty acid synthesis, and downregulation of enzymes involved in fatty acid degradation favor the synthesis of fatty acids within the cell. CONCLUSIONS: Despite similarities to other Chlorella, C. protothecoides has a smaller genome than its close relatives. Genes involved in glucose utilization were identified, and these genes explained its ability to grow heterotrophically. Transcriptomic and proteomic results provided insight into its extraordinary ability to accumulate large amounts of lipid. The C. protothecoides draft genome will promote the use of this species as a research model.
Overview
The claims and statistics of this paper haven’t been checked yet.
Run the check — free, no account needed. It reads the open-access text and checks the sources it cites.
Integrity signals
Registry
Cites
Statistics
Figures
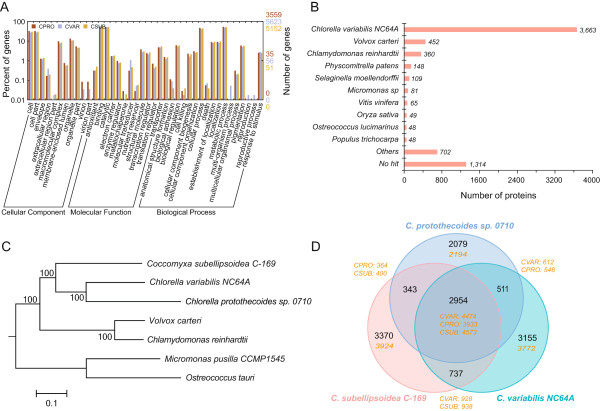
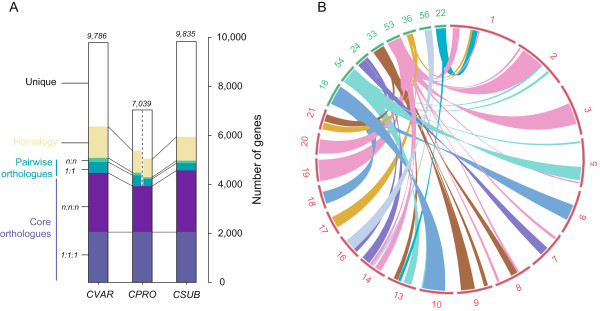
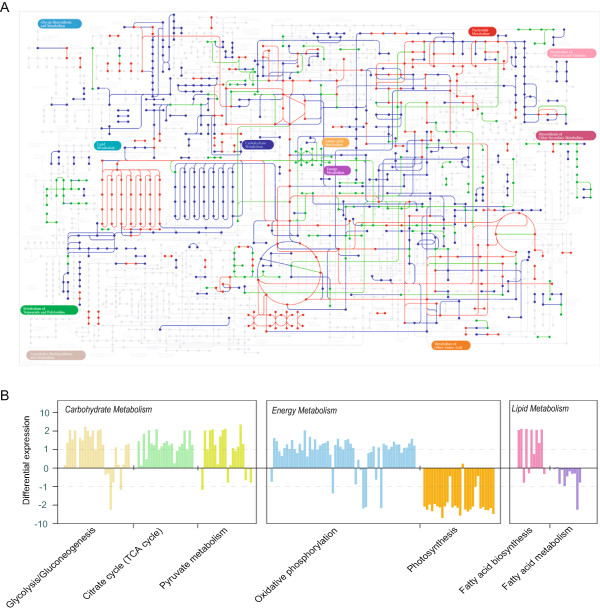
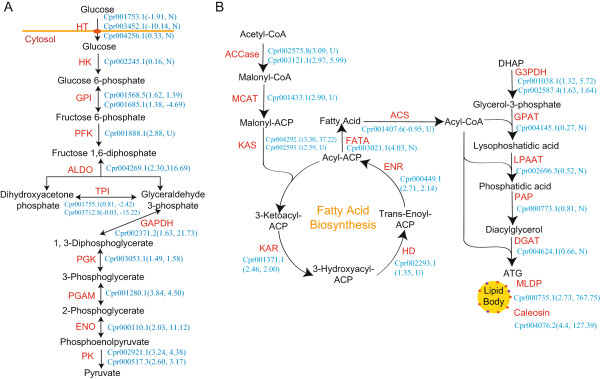
Verification
Claims the paper makes
The claims and statistics of this paper haven’t been checked yet.
Run the check — free, no account needed. It reads the open-access text and checks the sources it cites.
Claims other papers make about this one
Each is checked against this paper’s own text: does it say what the citing paper says it does?
In the citing paper
“| 1 | Auxenochlorella protothecoides | 22.92 | Genome scale and core metabolic model | Biodiesel | Sequencing, phenotypic characterization, lipid analysis | Endogenous promoters or heterologous expression constructs | Enhanced lipid productivity, increased lipid content | Biofuel production | [89] |”
From A Holistic Approach to Circular Bioeconomy Through the Sustainable Utilization of Microalgal Biomass for Biofuel and Other Value-Added Products (2024) · cites this paper as [89]
Self-check
Percentages, sums and reported differences re-computed from the paper’s own numbers.
The self-check needs the paper’s full text.
Citations
Cites
Controlling the False Discovery Rate: A Practical and Powerful Approach to Multiple Testing
Benjamini, Y., & Hochberg, Y. (1995) · Journal of the Royal Statistical Society Series B: Statistical Methodology · doi:10.1111/j.2517-6161.1995.tb02031.x · Cited by 109,482
MUSCLE: multiple sequence alignment with high accuracy and high throughput
Edgar, R. C. (2004) · Nucleic Acids Research · doi:10.1093/nar/gkh340 · Cited by 44,662
Gene Ontology: tool for the unification of biology
Ashburner, M., Ball, C. A., Blake, J. A., Botstein, D., Butler, H., Cherry, J. M., Davis, A. P., Dolinski, K., Dwight, S. S., Eppig, J. T., et al. (2000) · Nature Genetics · doi:10.1038/75556 · Cited by 43,206
KEGG: Kyoto Encyclopedia of Genes and Genomes
Kanehisa, M. (2000) · Nucleic Acids Research · doi:10.1093/nar/28.1.27 · Cited by 37,077
KEGG: Kyoto Encyclopedia of Genes and Genomes
Ogata, H., Goto, S., Sato, K., Fujibuchi, W., Bono, H., & Kanehisa, M. (1999) · Nucleic Acids Research · doi:10.1093/nar/27.1.29 · Cited by 31,232
A Simple, Fast, and Accurate Algorithm to Estimate Large Phylogenies by Maximum Likelihood
Guindon, S., & Gascuel, O. (2003) · Systematic Biology · doi:10.1080/10635150390235520 · Cited by 16,923
Trapnell, C., Williams, B. A., Pertea, G., Mortazavi, A., Kwan, G., van Baren, M. J., Salzberg, S. L., Wold, B. J., & Pachter, L. (2010) · Nature Biotechnology · doi:10.1038/nbt.1621 · Cited by 15,556
Mapping and quantifying mammalian transcriptomes by RNA-Seq
Mortazavi, A., Williams, B. A., McCue, K., Schaeffer, L., & Wold, B. (2008) · Nature Methods · doi:10.1038/nmeth.1226 · Cited by 13,696
TopHat: discovering splice junctions with RNA-Seq
Trapnell, C., Pachter, L. S., & Salzberg, S. L. (2009) · Bioinformatics · doi:10.1093/bioinformatics/btp120 · Cited by 11,682
Tandem repeats finder: a program to analyze DNA sequences
Benson, G. (1999) · Nucleic Acids Research · doi:10.1093/nar/27.2.573 · Cited by 9,374
Cited by
Sorted by citations
Heterotrophic cultivation of microalgae for pigment production: A review
Hu, J., Nagarajan, D., Zhang, Q., Chang, J., & Lee, D. (2017) · Biotechnology Advances · doi:10.1016/j.biotechadv.2017.09.009 · Cited by 474
The biochemistry and molecular biology of chlorophyll breakdown
Kuai, B., Chen, J., & Hörtensteiner, S. (2017) · Journal of Experimental Botany · doi:10.1093/jxb/erx322 · Cited by 334
Kumar, G., Shekh, A., Jakhu, S., Sharma, Y., Kapoor, R., & Sharma, T. R. (2020) · Frontiers in Bioengineering and Biotechnology · doi:10.3389/fbioe.2020.00914 · Cited by 315
Wei, H., Shi, Y., Ma, X., Pan, Y., Hu, H., Li, Y., Luo, M., Gerken, H. G., & Liu, J. (2017) · Biotechnology for Biofuels · doi:10.1186/s13068-017-0858-1 · Cited by 154
Strategies to enhance production of microalgal biomass and lipids for biofuel feedstock
Chu, W.-L. (2017) · European Journal of Phycology · doi:10.1080/09670262.2017.1379100 · Cited by 148
Metadata
- Authors
- Gao, C., Wang, Y., Shen, Y., Yan, D., He, X., Dai, J., & Wu, Q.
- Affiliations
- China People's Public Security University (CN)
- BGI Group (China) (CN)
- Tsinghua University (CN)
- Corresponding author
- Dai, Junbiao
- Wu, Qingyu
- Venue
- BMC Genomics
- Published
- 2014-07-10
- Volume
- 15
- Issue
- 1
- Pages
- 582-582
- ISSN
- 1471-2164 (ISSN-L)
- PMC
- PMC4111847
- OpenAlex
- W1984532384
- Cited by
- 175
- References
- 65
- Citations by year
- 2026: 5 · 2025: 9 · 2024: 15 · 2023: 10 · 2022: 14 · 2021: 17 · 2020: 16 · 2019: 25 · 2018: 18 · 2017: 16 · 2016: 18 · 2015: 7 · 2014: 5
- FWCI
- 5.06
- Type
- journal article
- Language
- en
- Open access
- gold
- doi.org
- Licence
- cc-by
- Locations
- BMC Genomics (publishedVersion, cc-by)
- Europe PMC (PubMed Central) (publishedVersion, cc-by)
- PubMed Central (publishedVersion, cc-by)
- PubMed (publishedVersion)
- Funders
- National Natural Science Foundation of China (41030210, 31370282)
- Tsinghua University (2012Z08128)
- Topics
- Physical Sciences › Energy › Renewable Energy, Sustainability and the Environment › Algal biology and biofuel production
- Life Sciences › Biochemistry, Genetics and Molecular Biology › Molecular Biology › Microbial Metabolic Engineering and Bioproduction
- Life Sciences › Biochemistry, Genetics and Molecular Biology › Biochemistry › Lipid metabolism and biosynthesis
- Keywords
- Chlorella protothecoides, lipid accumulation, draft genome sequence, genome size reduction, comparative genomics, heterotrophic growth, autotrophic growth, glucose catabolism, glycolysis, TCA cycle, fatty acid synthesis, Chlorella variabilis
- MeSH terms
- Carbon, Chlorella, Citric Acid Cycle, Energy Metabolism, Glycolysis, Plant Oils, Genome, Plant, Proteome, Metabolic Networks and Pathways, Comparative Genomic Hybridization, Biofuels, Transcriptome
About these checks
Registry, retraction, Cites and statistics results are computed, not judged, with one exception: a printed reference that no index lists is read once by a model before it counts as a citation error. Claims are extracted by a model and kept only when their quote appears verbatim in the text; each cited source is then checked, with a model’s help, for whether it says what the claim relies on. Those verdicts can be wrong — read the claim’s quote and the cited source before relying on one.
Statistics and arithmetic are recomputed, not judged.
Confidence bands are shown only for fields calibrated on our annotated test set. None is calibrated yet, so no band is shown.
What counts as a claim ›How we measure confidence ›How we check this ›
Are you an author, or do you see a problem with this page? Request a review
