

The DOI matches its Crossref record; 42 of the 43 references it cites were found in a registry or an index.
Cell-type specific gene expression profiles of leukocytes in human peripheral blood
Open accessAbstract
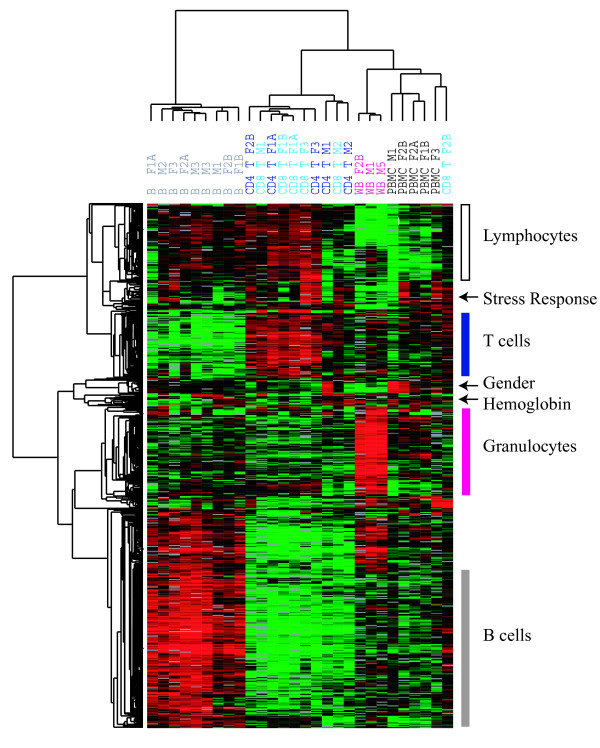
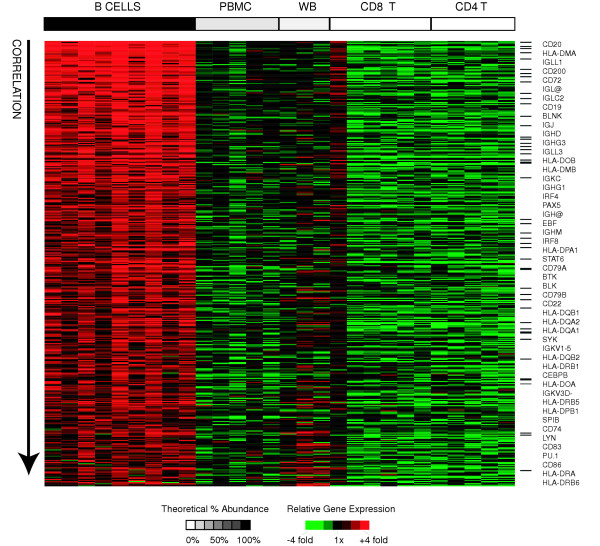
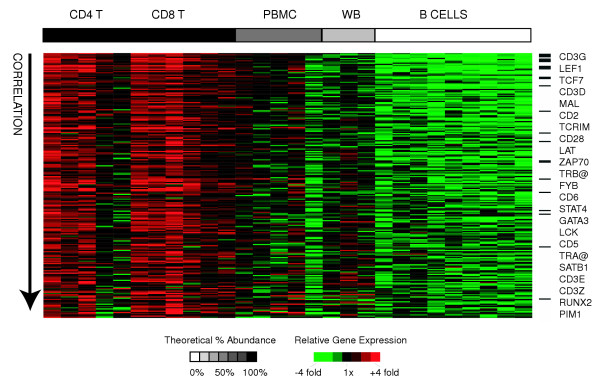
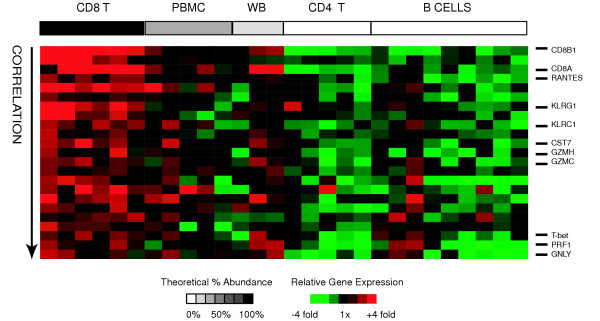
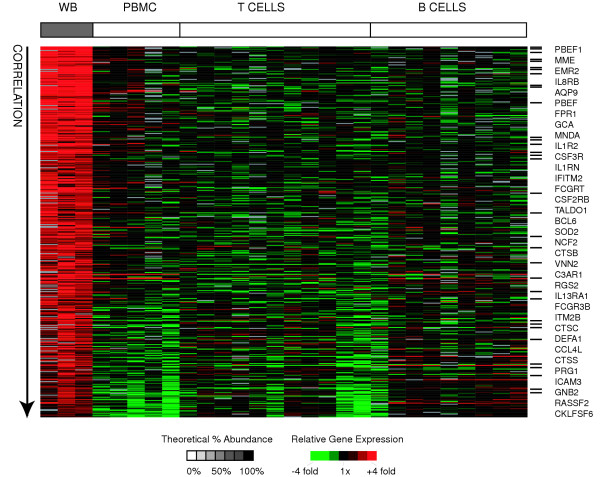
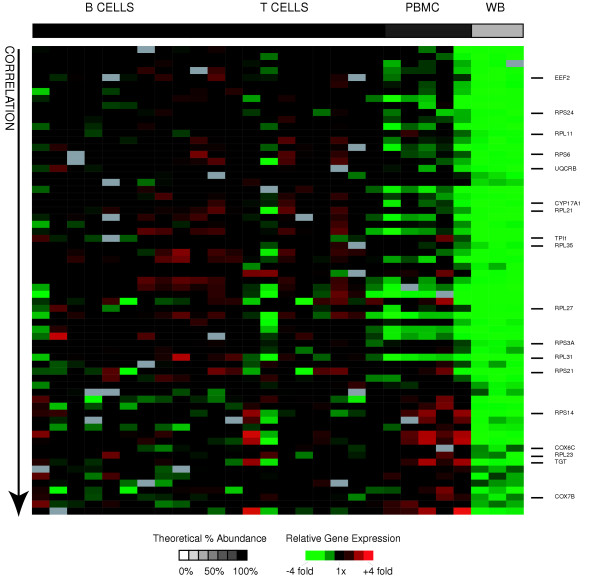
Background: Blood is a complex tissue comprising numerous cell types with distinct functions and corresponding gene expression profiles. We attempted to define the cell type specific gene expression patterns for the major constituent cells of blood, including B-cells, CD4+ T-cells, CD8+ T-cells, lymphocytes and granulocytes. We did this by comparing the global gene expression profiles of purified B-cells, CD4+ T-cells, CD8+ T-cells, granulocytes, and lymphocytes using cDNA microarrays. Results: Unsupervised clustering analysis showed that similar cell populations from different donors share common gene expression profiles. Supervised analyses identified gene expression signatures for B-cells (427 genes), T-cells (222 genes), CD8+ T-cells (23 genes), granulocytes (411 genes), and lymphocytes (67 genes). No statistically significant gene expression signature was identified for CD4+ cells. Genes encoding cell surface proteins were disproportionately represented among the genes that distinguished among the lymphocyte subpopulations. Lymphocytes were distinguishable from granulocytes based on their higher levels of expression of genes encoding ribosomal proteins, while granulocytes exhibited characteristic expression of various cell surface and inflammatory proteins. Conclusion: The genes comprising the cell-type specific signatures encompassed many of the genes already known to be involved in cell-type specific processes, and provided clues that may prove useful in discovering the functions of many still unannotated genes. The most prominent feature of the cell type signature genes was the enrichment of genes encoding cell surface proteins, perhaps reflecting the importance of specialized systems for sensing the environment to the physiology of resting leukocytes.
Overview
The claims and statistics of this paper haven’t been checked yet.
Run the check — free, no account needed. It reads the open-access text and checks the sources it cites.
Integrity signals
Registry
Cites
Statistics
Figures
Verification
Claims the paper makes
The claims and statistics of this paper haven’t been checked yet.
Run the check — free, no account needed. It reads the open-access text and checks the sources it cites.
Claims other papers make about this one
Each is checked against this paper’s own text: does it say what the citing paper says it does?
The check wasn’t confident either way, so it gives no verdict — never disputed.
In the citing paper
“Inspired by models and algorithms developed for detecting contamination in DNA sequencing18, demuxlet is fast, accurate, scalable, and compatible with standard input formats17, 19, 20.”
From Multiplexed droplet single-cell RNA-sequencing using natural genetic variation (2018) · cites this paper as [19]
Experimental — accuracy not yet measured
Self-check
Percentages, sums and reported differences re-computed from the paper’s own numbers.
The self-check needs the paper’s full text.
Citations
Cites
Gene Ontology: tool for the unification of biology
Ashburner, M., Ball, C. A., Blake, J. A., Botstein, D., Butler, H., Cherry, J. M., Davis, A. P., Dolinski, K., Dwight, S. S., Eppig, J. T., et al. (2000) · Nature Genetics · doi:10.1038/75556 · Cited by 43,206
Harrison's Principles of Internal Medicine.
(1988) · Annals of Internal Medicine · doi:10.7326/0003-4819-108-3-499_2 · Cited by 12,528
In silico prediction of protein-protein interactions in human macrophages
Souiai, O., Guerfali, F. Z., Miled, S. B., Brun, C., & Benkahla, A. (2014) · BMC Research Notes · doi:10.1186/1756-0500-7-157 · Cited by 10,785
Significance analysis of microarrays applied to the ionizing radiation response
Tusher, V. G., Tibshirani, R., & Chu, G. (2001) · Proceedings of the National Academy of Sciences · doi:10.1073/pnas.091062498 · Cited by 10,568
Distinct types of diffuse large B-cell lymphoma identified by gene expression profiling
Alizadeh, A. A., Eisen, M. B., Davis, R. E., Ma, C., Lossos, I. S., Rosenwald, A., Boldrick, J. C., Sabet, H., Tran, T., Yu, X., et al. (2000) · Nature · doi:10.1038/35000501 · Cited by 9,925
Self-citationHarrison's Principles of Internal Medicine
Somberg, J. C. (2005) · American Journal of Therapeutics · doi:10.1097/01.mjt.0000179344.69594.75 · Cited by 2,123
Identifying biological themes within lists of genes with EASE
Hosack, D. A., Dennis, G., Sherman, B. T., Lane, H. C., & Lempicki, R. A. (2003) · Genome biology · doi:10.1186/gb-2003-4-10-r70 · Cited by 1,961
[12] DNA arrays for analysis of gene expression
Eisen, M. B., & Brown, P. O. (1999) · Methods in enzymology on CD-ROM/Methods in enzymology · doi:10.1016/s0076-6879(99)03014-1 · Cited by 1,043
Self-citationIndividuality and variation in gene expression patterns in human blood
Whitney, A. R., Diehn, M., Popper, S. J., Alizadeh, A. A., Boldrick, J. C., Relman, D. A., & Brown, P. O. (2003) · Proceedings of the National Academy of Sciences · doi:10.1073/pnas.252784499 · Cited by 775
Self-citationHigh-fidelity mRNA amplification for gene profiling
Wang, E., Miller, L. D., Ohnmacht, G. A., Liu, E. T., & Marincola, F. M. (2000) · Nature Biotechnology · doi:10.1038/74546 · Cited by 675
Research works printed but not linked: 1
- Kuby J: Immunology. 1997, W. H. Freeman and Company, 3
Cited by
Sorted by citations
Items 301–328 of 328
Choi, Y., Qu, J., Wu, E., Hao, Y., Zhang, J., Ning, J., Yang, X., Lofaro, L., Pankratz, D. G., Babiarz, J., et al. (2020) · Figshare · doi:10.6084/m9.figshare.13126703
Choi, Y., Qu, J., Wu, E., Hao, Y., Zhang, J., Ning, J., Yang, X., Lofaro, L., Pankratz, D. G., Babiarz, J., et al. (2020) · Figshare · doi:10.6084/m9.figshare.13126706
Puthiyottil, S., & Skaria, T. (2025) · Tissue Barriers · doi:10.1080/21688370.2025.2503523
Clinicopathological Implications of Maspin, CD8, and PD-L1 Expression in Liposarcomas
Patrichi, A. I., Jung, I., & Gurzu, S. (2025) · Current Issues in Molecular Biology · doi:10.3390/cimb47110935
McCaffrey, T. A., Toma, I., Yang, Z., Katz, R. J., Reiner, J. S., Mazhari, R., Shah, P., Tackett, M., Jones, D., Jepson, T., et al. (2021) · Figshare · doi:10.6084/m9.figshare.16569806
Choi, Y., Qu, J., Wu, S., Hao, Y., Zhang, J., Ning, J., Yang, X., Lofaro, L., Pankratz, D. G., Babiarz, J., et al. (2020) · Figshare · doi:10.6084/m9.figshare.13126700
Henning, A. N., Green, D. S., Baumann, R., Grandinetti, P., Highfill, S. L., Zhou, H., & Giorgi, V. D. (2021) · Figshare · doi:10.6084/m9.figshare.17047164
Wilk, A. J., Marceau, J. O., Kazer, S. W., Fleming, I., Miao, V. N., Galvez-Reyes, J., Kimata, J. T., Shalek, A. K., Holmes, S., Overbaugh, J., et al. (2024) · Figshare · doi:10.6084/m9.figshare.25150648
Wilk, A. J., Marceau, J. O., Kazer, S. W., Fleming, I., Miao, V. N., Galvez-Reyes, J., Kimata, J. T., Shalek, A. K., Holmes, S., Overbaugh, J., et al. (2024) · Figshare · doi:10.6084/m9.figshare.25150707
McCaffrey, T. A., Toma, I., Yang, Z., Katz, R., Reiner, J. S., Mazhari, R., Shah, P., Tackett, M., Jones, D., Jepson, T., et al. (2021) · Figshare · doi:10.6084/m9.figshare.16569803
Henning, A. N., Green, D. S., Baumann, R., Grandinetti, P., Highfill, S. L., Zhou, H., & Giorgi, V. D. (2021) · Figshare · doi:10.6084/m9.figshare.17047161
Pellegrino-Coppola, D., Claringbould, A., Stutvoet, M., Boomsma, D. I., Ikram, M. A., Slagboom, P. E., Westra, H.-J., & Franke, L. (2021) · Figshare · doi:10.6084/m9.figshare.14220860
Teng, X., Jiang, Y., Cho, W. C., Wang, H., Ma, J., Zhao, M., Meng, X., Xiao, H., Lai, Q., Zhang, X., et al. (2026) · medRxiv · doi:10.64898/2026.01.20.26344418
Cruz-Barrera, M., Sonn, A., Galindo, C. C., Nehmo, G. M., Lê, O., Ferbeyre, G., & Beausejour, C. M. (2026) · bioRxiv (Cold Spring Harbor Laboratory) · doi:10.64898/2026.02.09.704891
Yan, X., Tang, X., Guo, L., He, Z., Liu, S., Wu, S., Zhilong, L., Liu, T.-Z., Zheng, H., Zhang, W., et al. (2026) · Cancer Medicine · doi:10.1002/cam4.71737
Cellules placentaires et infection par coxiella burnetii
Amara, A. B. (2011) · theses.fr (ABES) · doi:10.70675/560a05fczbfbbz4e49zaf9az4c7610eb46e7
Caractérisation moléculaire et immunité des cancers du sein triple-négatifs
Bonsang‐Kitzis, H. (2018) · theses.fr (ABES) · doi:10.70675/285c912cz8251z4099z9cf7ze121cd7350d0
Sadacca, B. (2017) · theses.fr (ABES) · doi:10.70675/86d0b41azfb6bz44bdz9f35zf24452ba9c6a
Bedhiafi, W. (2017) · theses.fr (ABES) · doi:10.70675/d63cc072z8a6dz4d88zabdbzd4b304c6abf3
Lopresti, A. (2019) · theses.fr (ABES) · doi:10.70675/216c614ezc8f7z414cza7e4z61c22dd929c4
Rôle du TNFR2 exprimé par les lymphocytes T régulateurs au cours de l'immunodépression post septique
Gaborit, B. (2019) · theses.fr (ABES) · doi:10.70675/fc216760z171az42f4zade0z7695e77ea077
Yang, C., Aguet, F., Auguste, G. E., Ardlie, K., Gerszten, R. E., Post, W. S., Wheeler, H. E., Taylor, K. D., Kasela, S., Lappalainen, T., et al. (2026) · medRxiv · doi:10.64898/2026.07.31.26357396
Biomarker-guided responses in patient-derived organoids predict effective therapies in breast cancer
Bui, T. B. V., Wolf, D. M., Bruck, M. C., Moore, K., Lien, J., Choi, S. D. W., Warhadpande, S., Parizadeh, A., Dillon, D. A. R., Overmoyer, B. A., et al. (2026) · Cell Reports Medicine · doi:10.1016/j.xcrm.2026.102973
Rao, J., Jihad, M., Biffi, G., & Kirk, P. (2026) · bioRxiv (Cold Spring Harbor Laboratory) · doi:10.64898/2026.09.04.749363
Islam, M. A., Neuhoff, C., Pröll, M. J., Große‐Brinkhaus, C., Rony, S. A., Tholen, E., Schellander, K., & Uddin, M. J. (2026) · Viruses · doi:10.3390/v18090994
Metadata
- Authors
- Palmer, C., Diehn, M., Alizadeh, A. A., & Brown, P. O.
- Affiliations
- Stanford Medicine (US)
- Howard Hughes Medical Institute (US)
- Corresponding author
- Brown, Patrick O
- Venue
- BMC Genomics
- Published
- 2006-05-16
- Volume
- 7
- Issue
- 1
- Pages
- 115-115
- ISSN
- 1471-2164 (ISSN-L)
- PMC
- PMC1479811
- OpenAlex
- W2116830437
- Cited by
- 331
- References
- 43
- Citations by year
- 2026: 8 · 2025: 7 · 2024: 13 · 2023: 12 · 2022: 15 · 2021: 27 · 2020: 26 · 2019: 31 · 2018: 23 · 2017: 31 · 2016: 12 · 2015: 16 · 2014: 18 · 2013: 17 · 2012: 15
- FWCI
- 3.26
- Type
- journal article
- Language
- en
- Open access
- gold
- doi.org
- Licence
- Locations
- BMC Genomics (publishedVersion, cc-by)
- PubMed Central (publishedVersion, cc-by)
- PubMed (publishedVersion)
- DOAJ (DOAJ: Directory of Open Access Journals) (submittedVersion)
- Funders
- Howard Hughes Medical Institute
- National Institute of General Medical Sciences (T32GM007365, GM 07365)
- Topics
- Life Sciences › Biochemistry, Genetics and Molecular Biology › Molecular Biology › Gene expression and cancer classification
- Life Sciences › Biochemistry, Genetics and Molecular Biology › Molecular Biology › Bioinformatics and Genomic Networks
- Life Sciences › Immunology and Microbiology › Immunology › T-cell and B-cell Immunology
- Keywords
- cell type-specific gene expression, leukocytes, B cells, CD4+ T cells, CD8+ T cells, granulocytes, lymphocytes, gene expression signatures, cell surface proteins, ribosomal proteins, inflammatory proteins, peripheral blood
- MeSH terms
- Adult, B-Lymphocytes, Blood Cells, Cell Separation, Female, Genes, Granulocytes, Humans, Leukocytes, Male, Middle Aged, Organ Specificity, CD4-Positive T-Lymphocytes, T-Lymphocyte Subsets, CD8-Positive T-Lymphocytes, Oligonucleotide Array Sequence Analysis, Gene Expression Profiling
About these checks
Registry, retraction, Cites and statistics results are computed, not judged, with one exception: a printed reference that no index lists is read once by a model before it counts as a citation error. Claims are extracted by a model and kept only when their quote appears verbatim in the text; each cited source is then checked, with a model’s help, for whether it says what the claim relies on. Those verdicts can be wrong — read the claim’s quote and the cited source before relying on one.
Statistics and arithmetic are recomputed, not judged.
Confidence bands are shown only for fields calibrated on our annotated test set. None is calibrated yet, so no band is shown.
What counts as a claim ›How we measure confidence ›How we check this ›
Are you an author, or do you see a problem with this page? Request a review
