

The DOI matches its Crossref record; 56 of the 56 references it cites were found in a registry or an index.
Gene expressions and copy numbers associated with metastatic phenotypes of uterine cervical cancer
Open accessAbstract
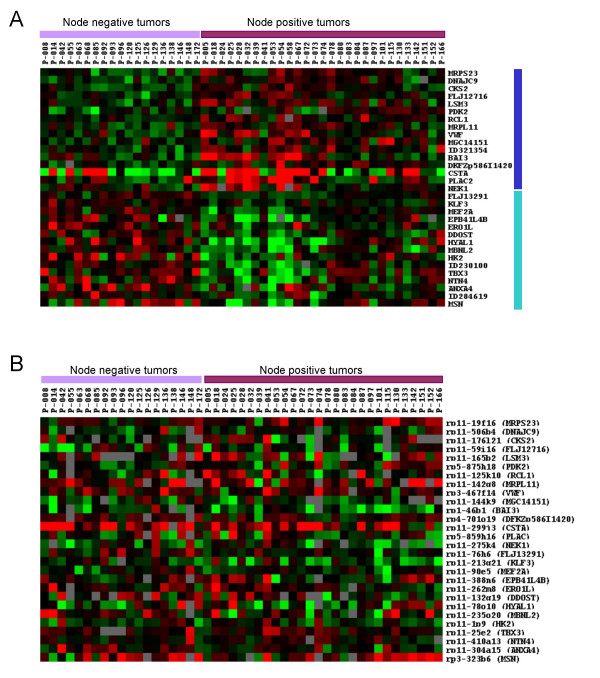
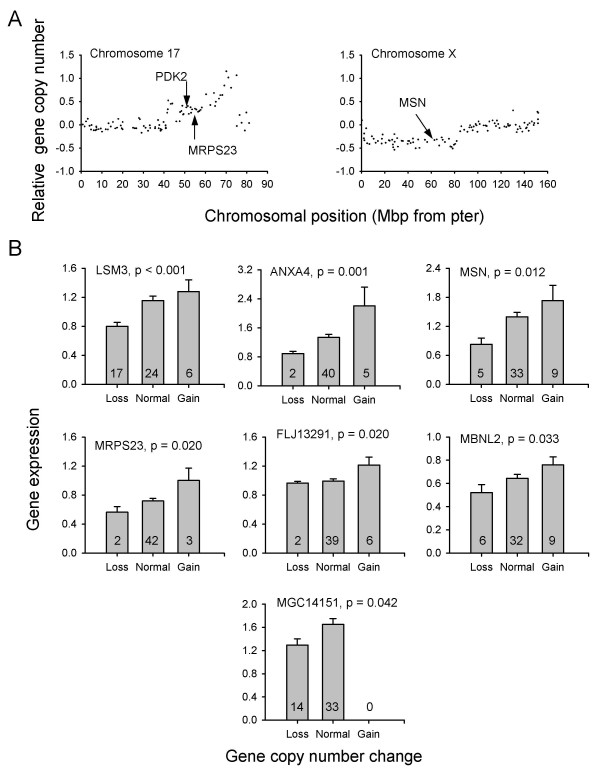
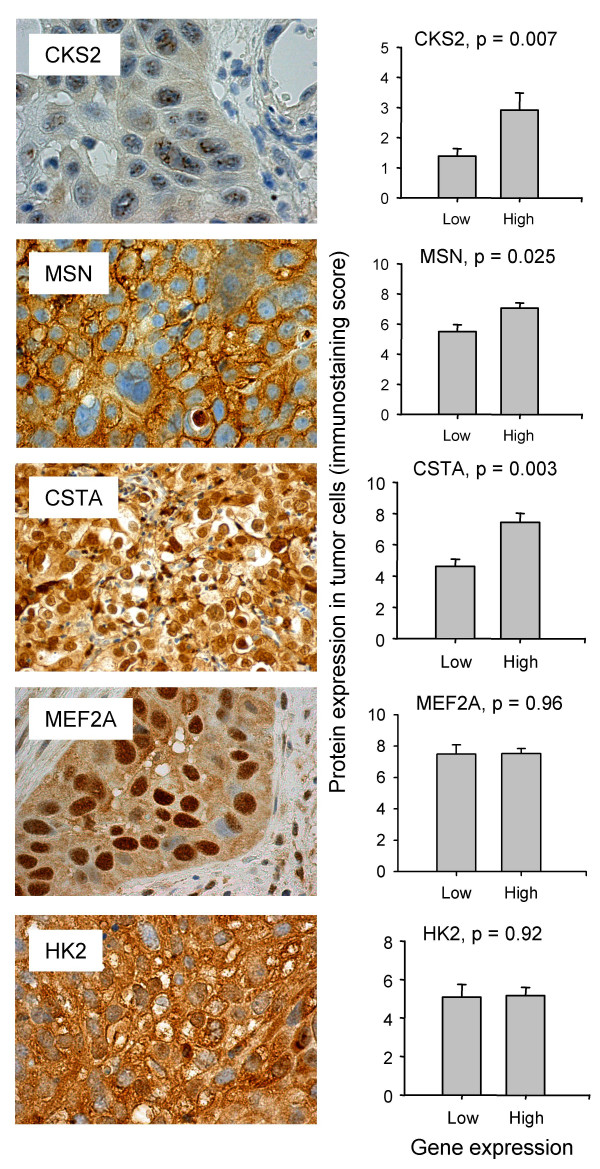
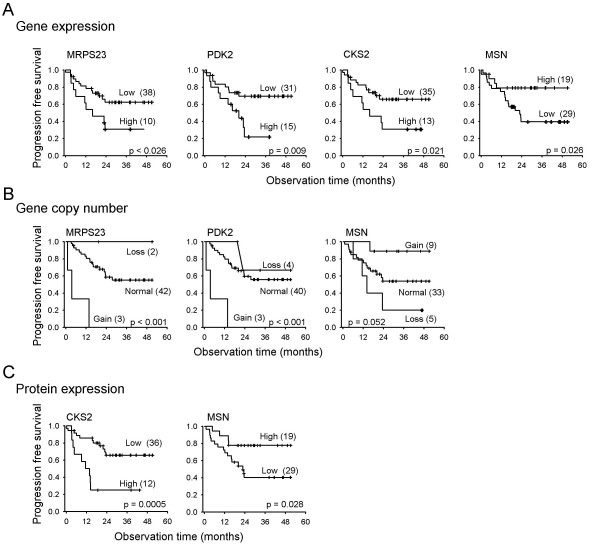
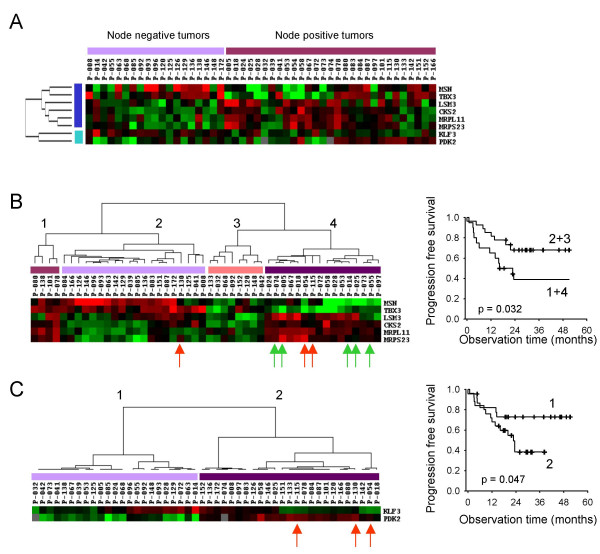
BACKGROUND: A better understanding of the development of metastatic disease and the identification of molecular markers for cancer spread would be useful for the design of improved treatment strategies. This study was conducted to identify gene expressions associated with metastatic phenotypes of locally advanced cervical carcinomas and investigate whether gains or losses of these genes could play a role in regulation of the transcripts. Gene expressions and copy number changes were determined in primary tumors from 29 patients with and 19 without diagnosed lymph node metastases by use of cDNA and genomic microarray techniques, respectively. RESULTS: Thirty-one genes that differed in expression between the node positive and negative tumors were identified. Expressions of eight of these genes (MRPL11, CKS2, PDK2, MRPS23, MSN, TBX3, KLF3, LSM3) correlated with progression free survival in univariate analysis and were therefore more strongly associated with metastatic phenotypes than the others. Immunohistochemistry data of CKS2 and MSN showed similar relationships to survival. The prognostic genes clustered into two groups, suggesting two major metastatic phenotypes. One group was associated with rapid proliferation, oxidative phosphorylation, invasiveness, and tumor size (MRPS23, MRPL11, CKS2, LSM3, TBX3, MSN) and another with hypoxia tolerance, anaerobic metabolism, and high lactate content (PDK2, KLF3). Multivariate analysis identified tumor volume and PDK2 expression as independent prognostic variables. Gene copy number changes of the differentially expressed genes were not frequent, but correlated with the expression level for seven genes, including MRPS23, MSN, and LSM3. CONCLUSION: Gene expressions associated with known metastatic phenotypes of cervical cancers were identified. Our findings may indicate molecular mechanisms underlying development of these phenotypes and be useful as markers of cancer spread. Gains or losses of the genes may be involved in development of the metastatic phenotypes in some cases, but other mechanisms for transcriptional regulation are probably important in the majority of tumors.
Overview
The claims and statistics of this paper haven’t been checked yet.
Run the check — free, no account needed. It reads the open-access text and checks the sources it cites.
Integrity signals
Registry
Cites
Statistics
Figures
Verification
Claims the paper makes
The claims and statistics of this paper haven’t been checked yet.
Run the check — free, no account needed. It reads the open-access text and checks the sources it cites.
Claims other papers make about this one
Each is checked against this paper’s own text: does it say what the citing paper says it does?
The source backs part of the claim, not all of it — or backs it for a different population, condition or comparison.
In the citing paper
“As Tbx3 is involved in the carcinogenesis of multiple types of human cancers, our findings suggest an important target for anti-cancer drug development.”
From Novel HDAC5-interacting motifs of Tbx3 are essential for the suppression of E-cadherin expression and for the promotion of metastasis in hepatocellular carcinoma (2018) · cites this paper as [31]
Experimental — accuracy not yet measured
Self-check
Percentages, sums and reported differences re-computed from the paper’s own numbers.
The self-check needs the paper’s full text.
Citations
Cites
Analysis of Relative Gene Expression Data Using Real-Time Quantitative PCR and the 2−ΔΔCT Method
Livak, K. J., & Schmittgen, T. D. (2001) · Methods · doi:10.1006/meth.2001.1262 · Cited by 180,860
Cluster analysis and display of genome-wide expression patterns
Eisen, M. B., Spellman, P. T., Brown, P. O., & Botstein, D. (1998) · Proceedings of the National Academy of Sciences · doi:10.1073/pnas.95.25.14863 · Cited by 16,184
In silico prediction of protein-protein interactions in human macrophages
Souiai, O., Guerfali, F. Z., Miled, S. B., Brun, C., & Benkahla, A. (2014) · BMC Research Notes · doi:10.1186/1756-0500-7-157 · Cited by 10,785
Significance analysis of microarrays applied to the ionizing radiation response
Tusher, V. G., Tibshirani, R., & Chu, G. (2001) · Proceedings of the National Academy of Sciences · doi:10.1073/pnas.091062498 · Cited by 10,568
Mutation of the mouse klotho gene leads to a syndrome resembling ageing
Kuro-o, M., Matsumura, Y., Aizawa, H., Kawaguchi, H., Suga, T., Utsugi, T., Ohyama, Y., Kurabayashi, M., Kaname, T., Kume, E., et al. (1997) · Nature · doi:10.1038/36285 · Cited by 3,837
A molecular signature of metastasis in primary solid tumors
Ramaswamy, S., Ross, K. N., Lander, E. S., & Golub, T. R. (2002) · Nature Genetics · doi:10.1038/ng1060 · Cited by 2,469
Sp1 and krüppel‐like factor family of transcription factors in cell growth regulation and cancer
Black, A. R., Black, J. D., & Azizkhan‐Clifford, J. (2001) · Journal of Cellular Physiology · doi:10.1002/jcp.1111 · Cited by 1,048
Walenta, S., Wetterling, M., Lehrke, M., Schwickert, G., Sundfør, K., Rofstad, E. K., & Mueller‐Klieser, W. (2000) · PubMed · Cited by 817
Self-citationRoepman, P., Wessels, L. F. A., Kettelarij, N., Kemmeren, P., Miles, A. J., Lijnzaad, P., Tilanus, M. G. J., Koole, R., Hordijk, G. J., van der Vliet, P. C., et al. (2005) · Nature Genetics · doi:10.1038/ng1502 · Cited by 512
Muscleblind proteins regulate alternative splicing
Ho, T. H., Charlet‐Berguerand, N., Poulos, M. G., Singh, G., Swanson, M. S., & Cooper, T. A. (2004) · The EMBO Journal · doi:10.1038/sj.emboj.7600300 · Cited by 494
Research works printed but not linked: 1
- NCBI UniGene database. [ http://www.ncbi.nlm.nih.gov/UniGene ]
Cited by
Sorted by citations
Items 101–158 of 158
Krstic, M., Hassan, H. M., Kolendowski, B., Hague, M. N., Anborgh, P. H., Postenka, C. O., Torchia, J., Chambers, A. F., & Tuck, A. B. (2019) · Laboratory Investigation · doi:10.1038/s41374-019-0326-6 · Cited by 11
Expression profile and prognostic values of LSM family in skin cutaneous melanoma
Sun, X., Zhang, J., Xiao, C., & Ge, Z. (2022) · BMC Medical Genomics · doi:10.1186/s12920-022-01395-6 · Cited by 11
Han, M., Chiu, D. T., & Koc, E. C. (2010) · Mitochondrion · doi:10.1016/j.mito.2009.12.150 · Cited by 10
KLF3 promotes colorectal cancer growth by activating WNT1
Shen, W., Yuan, L., Hao, B., Xiang, J., Cheng, F., Wu, Z., & Li, X. (2024) · Aging · doi:10.18632/aging.205494 · Cited by 9
Sun, X., Zhang, J., Hu, J., Han, Q., & Ge, Z. (2023) · BMC Medical Genomics · doi:10.1186/s12920-023-01564-1 · Cited by 9
Smith, S. P., Phillips, J. B., Johnson, M. L., Abbot, P., Capra, J. A., & Rokas, A. (2019) · Evolution Medicine and Public Health · doi:10.1093/emph/eoz015 · Cited by 9
Jung, M., Lee, C., Han, D., Kim, K., Yang, S., Nikas, I. P., Moon, K. C., Kim, H., Song, M. J., Kim, B., et al. (2022) · Frontiers in Oncology · doi:10.3389/fonc.2022.841398 · Cited by 8
Oviya, R. P., Thangaretnam, K. P., Ramachandran, B., Ramanathan, P., Jayavelu, S., Gopisetty, G., & Rajkumar, T. (2022) · Molecular Biology Reports · doi:10.1007/s11033-022-07842-y · Cited by 7
Hsp40 Co-chaperones as Drug Targets: Towards the Development of Specific Inhibitors
Pesce, E.-., Blatch, G. L., & Edkins, A. L. (2015) · Topics in medicinal chemistry · doi:10.1007/7355_2015_92 · Cited by 7
Halle, C., Lando, M., Sundfør, K., Kristensen, G. B., Holm, R., & Lyng, H. (2011) · Radiotherapy and Oncology · doi:10.1016/j.radonc.2011.05.052 · Cited by 7
Self-citationAntigen-subtracted 2-DE/MS strategy, a novel proteomic analysis platform
Zhao, P., Zhang, L., Zhong, W., Ying, X., Huang, H., Yao, B., Yuan, Z., Fu, J., Wang, Y., & Zhou, Z. (2010) · Archives of Toxicology · doi:10.1007/s00204-010-0539-3 · Cited by 6
Benson, M. D., Khor, C. C., Gage, P. J., & Lehmann, O. J. (2017) · PubMed Central · Cited by 6
Kurmyshkina, O. V., Kovchur, P. I., & Volkova, T. O. (2015) · Asian Pacific Journal of Cancer Prevention · doi:10.7314/apjcp.2015.16.11.4477 · Cited by 6
Biological functions and therapeutic potential of CKS2 in human cancer
Lai, Y., & Ye, L. (2024) · Frontiers in Oncology · doi:10.3389/fonc.2024.1424569 · Cited by 6
Elevated MRPS23 expression facilitates aggressive phenotypes in breast cancer cells
Khan, F. A., Fouad, D., Ataya, F. S., Saeed, U., Ji, X.-Y., & Dong, J. (2025) · Cellular and Molecular Biology · doi:10.14715/cmb/2024.70.12.9 · Cited by 5
High Expression of MRPL23 Is Associated with Poor Survival in Clear-Cell Renal Cell Carcinoma
Podemska, E., Borowczak, J., Łukasik, D., Grzanka, D., & Durślewicz, J. (2024) · Cancers · doi:10.3390/cancers16233909 · Cited by 4
DNAJC9 expression in basal-like and luminal A breast cancer subtypes predicts worse survival
Incekara, O., & Acun, T. (2023) · Molecular Biology Reports · doi:10.1007/s11033-023-08654-4 · Cited by 4
TBX3 stimulates proliferation and stem cell self-renewal in bladder carcinoma.
(2023) · PubMed · doi:10.14670/hh-18-496 · Cited by 4
Qin, L., Luo, X., Xiao, Q., Huang, H., Zhang, L., Chen, S., Wu, X., Huang, B., Pan, J. G., & Wei, J. (2022) · International Journal of Genomics · doi:10.1155/2022/6084549 · Cited by 3
The value of RPS15 and MRPS27 in ischemic stroke
Zhao, M., Liu, A., Mo, L., Wan, G., & Lu, F. (2023) · Medicine · doi:10.1097/md.0000000000034706 · Cited by 3
Liu, A., Xu, K.-L., Wang, W., Zhou, B., & Guo, Q.-G. (2019) · RSC Advances · doi:10.1039/c8ra08973f · Cited by 2
RetractedSun, L.-B., Ding, A., Han, Y., Song, M., & Shan, T. (2022) · Current Stem Cell Research & Therapy · doi:10.2174/1574888x17666220331124607 · Cited by 2
Kobori, T., Ito, Y., Urashima, Y., Ito, T., Takagaki, N., Hotta, K., & Obata, T. (2025) · Taiwanese Journal of Obstetrics and Gynecology · doi:10.1016/j.tjog.2024.12.006 · Cited by 2
Rudd, M. L., Hansen, N. F., Zhang, X., Urick, M. E., Zhang, S., Merino, M. J., Mullikin, J. C., Brody, L. C., & Bell, D. W. (2022) · PLoS ONE · doi:10.1371/journal.pone.0251286 · Cited by 2
The Lsm Proteins: Ring Architectures for RNA Capture
Milbradt, J., Sobti, M., & Bridget, C. (2011) · InTech eBooks · doi:10.5772/20054 · Cited by 2
TNF-alpha-induced metastasis gene changes in MCF-7 cells
Chen, X., Shu, Y., Li, W., & Yin, Y. (2008) · 南京医科大学学报:英文版 · doi:10.1016/s1007-4376(09)60008-3 · Cited by 2
Novel insights into the molecular heterogeneity of hepatocellular carcinomaPreprint
Jovel, J., Lin, Z. Y., O’Keefe, S. L., Willows, S. D., Wang, W., Zhang, G., Patterson, J., Kelvin, D. J., Wong, G. K., & Mason, A. L. (2017) · bioRxiv (Cold Spring Harbor Laboratory) · doi:10.1101/101766 · Cited by 2
Hof, J. P., Galesloot, T. E., Aben, K. K. H., Bryan, R. T., Catto, J. W. F., Cheng, K. K., Conroy, S., Fleshner, N. E., van der Heijden, A. G., James, N. D., et al. (2026) · Cancer Genetics · doi:10.1016/j.cancergen.2026.06.004 · Cited by 1
THE CYTOLOGICAL DIAGNOSTIC OF THE CERVICAL CANCER
Iancu, D., Crauciuc, E., Toma, O., & Crauciuc, D. V. (2010) · Analele Stiintifice ale Universitatii "Alexandru Ioan Cuza" din Iasi Sec. II a. Genetica si Biologie Moleculara · Cited by 1
CYTOLOGICAL DIAGNOSIS IN CERVICAL CANCER
Bratu, M., Pricop, F., Toma, O., Crauciuc, D. V., & Crauciuc, E. (2010) · Cited by 1
Caspersen, E. F. (2006) · NORA - Norwegian Open Research Archives · Cited by 1
Phillips, J. B., Smith, S. A., Johnson, M. L., Abbot, P., Capra, J. A., & Rokas, A. (2018) · bioRxiv (Cold Spring Harbor Laboratory) · doi:10.1101/285791 · Cited by 1
Neue Biomarker beim Zervixkarzinom
Kübler, K., Domröse, C. M., & Kuhn, W. C. (2013) · Der Gynäkologe · doi:10.1007/s00129-013-3292-x
Microarray Analysis Software and its Applications
Bessant, C. (2007) · doi:10.1002/9780470061565.hbb105
Ballim, R., & Prince, S. (2013) · Atlas of Genetics and Cytogenetics in Oncology and Haematology · doi:10.4267/2042/51044
Maragliano, C., & Eric, E. (2015) · TDX (Tesis Doctorals en Xarxa)
Regulation of the cyclin-dependent kinase inhibitor p21 by TBX3
Hare, S. (2013) · Open University of Cape Town (University of Cape Town)
Lando, M. (2011) · NORA - Norwegian Open Research Archives
Data Integration in Penalized Regression Models : with application to genomics
Bergersen, L. C. (2009) · Duo Research Archive (University of Oslo)
Antigen-subtracted 2-DE/MS strategy, a novel proteomic analysis platform
ZhaoLijuan, P. (2011)
Valencia-Pesqueira, L. M. (2018) · NORA - Norwegian Open Research Archives
A New Transcription Factor in Hematopoiesis
Bozok, Ü. G., Uysal, V. N. I., Yildirim, F., & Kumru, S. (2020) · Journal of Health, Medicine and Nursing · doi:10.7176/jhmn/75-05
Immunohistochemical Analysis of TBX3 and β-catenin in Gastric Cancers
Song, J. H. (2009)
Brown, S. M. (2008) · doi:10.1002/9780470336168.ch15
Mandem, A., Panicker, S., Mitra, A., & Ramalingam, S. (2023) · BENTHAM SCIENCE PUBLISHERS eBooks · doi:10.2174/9789815136500123020013
Sun, X., Zhang, J., Hu, J., Han, Q., & Ge, Z. (2023) · Figshare · doi:10.6084/m9.figshare.23512691
Sun, X., Zhang, J., Hu, J., Han, Q., & Ge, Z. (2023) · Figshare · doi:10.6084/m9.figshare.23512688
DNAJC9 promotes cervical cancer cell proliferation by regulating GLI1 expression
Xie, Z., Di, L., He, X., Huang, M., Qian, J., Yang, H., Chen, J., Lu, X., & Zhu, W. (2026) · Acta Biochimica et Biophysica Sinica · doi:10.3724/abbs.2026080
Andrographis restrains the progression of colorectal cancer by inhibiting the KLF3/LEMD1 axis
Zhang, L., Li, D., Tang, Y., & Xie, Y. (2026) · Functional & Integrative Genomics · doi:10.1007/s10142-026-01877-1
Huang, S., Liu, X. D., Ruan, Z., Hou, G., Liao, Y., Gu, D., & Xiong, W. (2026) · Biochimica et Biophysica Acta (BBA) - Molecular Basis of Disease · doi:10.1016/j.bbadis.2026.168319
Li, Z., Wu, Y., Li, J., Chen, M., Liang, H., He, L., Han, L., & Cao, J. (2026) · RSC Medicinal Chemistry · doi:10.1039/d6md00532b
Metadata
- Authors
- Lyng, H., Brøvig, R. S., Svendsrud, D. H., Holm, R., Kaalhus, O., Knutstad, K., Oksefjell, H., Sundfør, K., Kristensen, G. B., & Stokke, T.
- Affiliations
- University of Oslo (NO)
- Corresponding author
- Lyng, Heidi
- Venue
- BMC Genomics
- Published
- 2006-10-20
- Volume
- 7
- Issue
- 1
- Pages
- 268-268
- ISSN
- 1471-2164 (ISSN-L)
- PMC
- PMC1626467
- OpenAlex
- W2170540646
- Cited by
- 158
- References
- 56
- Citations by year
- 2026: 5 · 2025: 4 · 2024: 4 · 2023: 8 · 2022: 7 · 2021: 5 · 2020: 6 · 2019: 5 · 2018: 13 · 2017: 12 · 2016: 3 · 2015: 11 · 2014: 8 · 2013: 10 · 2012: 11
- FWCI
- 5.39
- Type
- journal article
- Language
- en
- Open access
- gold
- doi.org
- Licence
- Locations
- BMC Genomics (publishedVersion, cc-by)
- Europe PMC (PubMed Central) (publishedVersion, cc-by)
- PubMed (publishedVersion)
- DOAJ (DOAJ: Directory of Open Access Journals) (submittedVersion)
- NORA - Norwegian Open Research Archives (submittedVersion, cc-by)
- Funders
- Norges Forskningsråd
- Topics
- Health Sciences › Medicine › Epidemiology › Cervical Cancer and HPV Research
- Health Sciences › Medicine › Obstetrics and Gynecology › Endometrial and Cervical Cancer Treatments
- Life Sciences › Biochemistry, Genetics and Molecular Biology › Cancer Research › Breast Cancer Treatment Studies
- Keywords
- cervical cancer, lymph node metastasis, metastatic phenotype, gene expression, copy number alterations, prognostic genes, PDK2, MSN, CKS2, TBX3, KLF3, progression-free survival, tumor volume, hypoxia tolerance, oxidative phosphorylation, anaerobic metabolism, metastasis markers
- MeSH terms
- Analysis of Variance, Carcinoma, Squamous Cell, Carrier Proteins, Uterine Cervical Neoplasms, Female, Humans, Immunohistochemistry, Lymphatic Metastasis, Microfilament Proteins, Phenotype, Protein Kinases, Regression Analysis, Ribosomal Proteins, Gene Expression Regulation, Neoplastic, Cluster Analysis, Proportional Hazards Models, Survival Analysis, Protein Serine-Threonine Kinases, Gene Dosage, Cell Cycle Proteins, Oligonucleotide Array Sequence Analysis, T-Box Domain Proteins, Gene Expression Profiling, CDC2-CDC28 Kinases, Kruppel-Like Transcription Factors, 3-Phosphoinositide-Dependent Protein Kinases
About these checks
Registry, retraction, Cites and statistics results are computed, not judged, with one exception: a printed reference that no index lists is read once by a model before it counts as a citation error. Claims are extracted by a model and kept only when their quote appears verbatim in the text; each cited source is then checked, with a model’s help, for whether it says what the claim relies on. Those verdicts can be wrong — read the claim’s quote and the cited source before relying on one.
Statistics and arithmetic are recomputed, not judged.
Confidence bands are shown only for fields calibrated on our annotated test set. None is calibrated yet, so no band is shown.
What counts as a claim ›How we measure confidence ›How we check this ›
Are you an author, or do you see a problem with this page? Request a review
