

The DOI matches its Crossref record; 40 of the 40 references it cites were found in a registry or an index; 35 of the 53 sources its claims cite were checked for support.
Preferred and avoided codon pairs in three domains of life
Open accessAbstract
Background: Alternative synonymous codons are not used with equal frequencies. In addition, the contexts of codons – neighboring nucleotides and neighboring codons – can have certain patterns. The codon context can influence both translational accuracy and elongation rates. However, it is not known how strong or conserved the codon context preferences in different organisms are. We analyzed 138 organisms (bacteria, archaea and eukaryotes) to find conserved patterns of codon pairs. Results: After removing the effects of single codon usage and dipeptide biases we discovered a set of neighboring codons for which avoidances or preferences were conserved in all three domains of life. Such biased codon pairs could be divided into subtypes on the basis of the nucleotide patterns that influence the bias. The most frequently avoided type of codon pair was nnUAnn. We discovered that 95.7% of avoided nnUAnn type patterns contain out-frame UAA or UAG triplets on the sense and/or antisense strand. On average, nnUAnn codon pairs are more frequently avoided in ORFeomes than in genomes. Thus we assume that translational selection plays a major role in the avoidance of these codon pairs. Among the preferred codon pairs, nnGCnn was the major type. Conclusion: Translational selection shapes codon pair usage in protein coding sequences by rules that are common to all three domains of life. The most frequently avoided codon pairs contain the patterns nnUAnn, nnGGnn, nnGnnC, nnCGCn, GUCCnn, CUCCnn, nnCnnA or UUCGnn. The most frequently preferred codon pairs contain the patterns nnGCnn, nnCAnn or nnUnCn.
Overview
AI snapshot
Written from the paper’s full text.
TL;DR
Analyzing 138 organisms from bacteria, archaea, and eukaryotes, this study identifies conserved preferred and avoided neighboring codon pairs after removing single-codon and dipeptide biases. The biases are generally stronger in ORFeomes than in genomes, implicating translational selection, with nnUAnn avoidance and nnGCnn preference as major conserved patterns.
Key findings
- Of 288 conserved biased neighboring codon pairs, 207 were avoided and 81 were preferred; for more distant pairs, only GGUnnnGGU (1–3) was conserved, over-represented in 61% of organisms, and no conserved biases were found for 1–4 or 1–5 pairs.
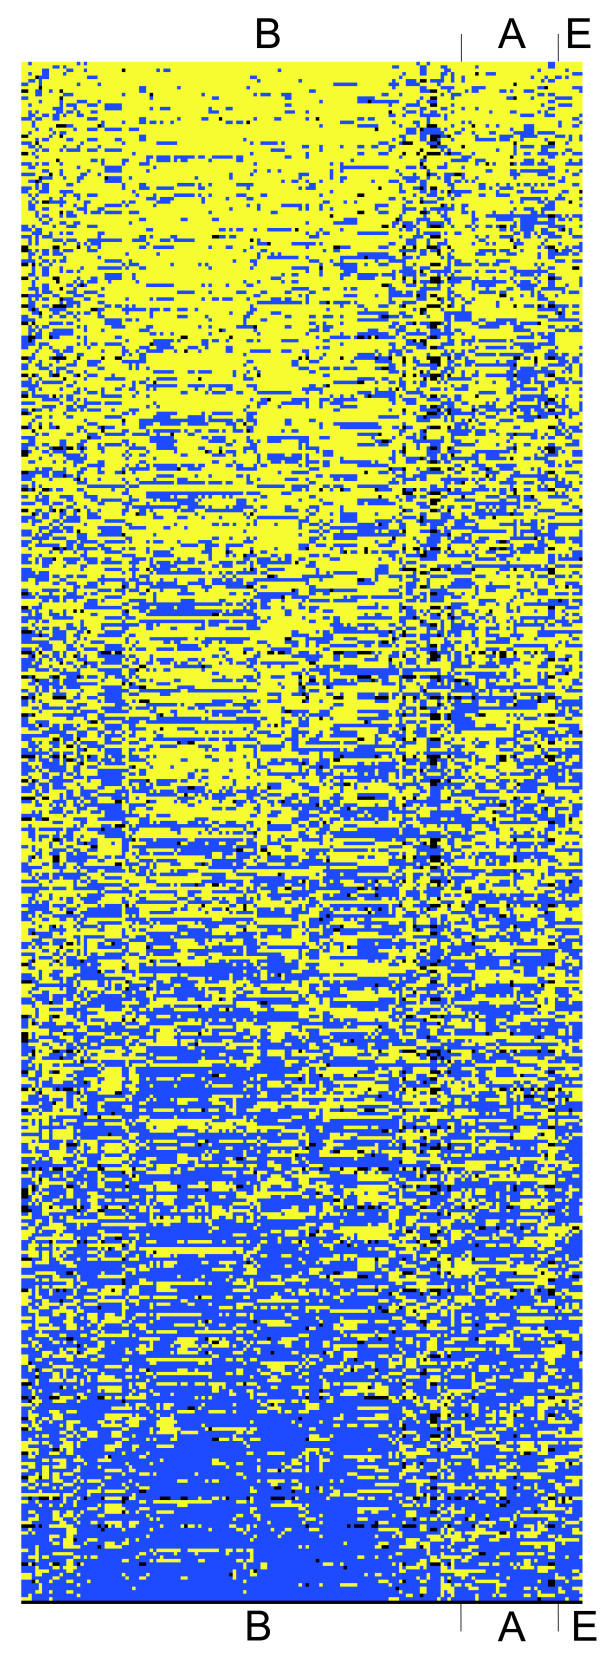
- The most abundant avoided type was nnUAnn (33.8% of avoided pairs); 75.7% of nnUAnn pairs were more strongly avoided in ORFeomes than genomes, and 95.7% (67/70) contained out-frame UAA or UAG triplets on the sense and/or antisense strand. The most conserved avoided pair was UUCGCA, under-represented in 86% of organisms.
- The most abundant preferred type was nnGCnn (21.0% of preferred pairs); all major preferred types were more strongly over-represented in ORFeomes than genomes. The most conserved preferred pair was GGGCUU, over-represented in 76% of organisms.
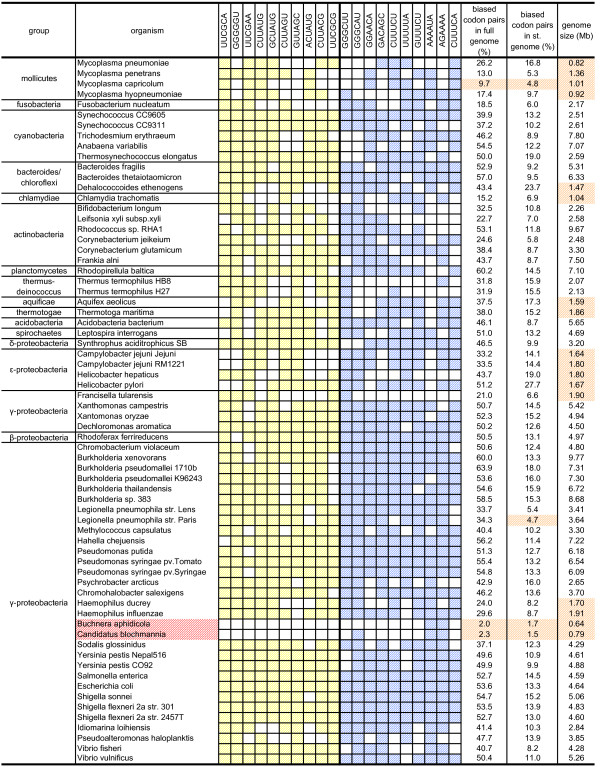
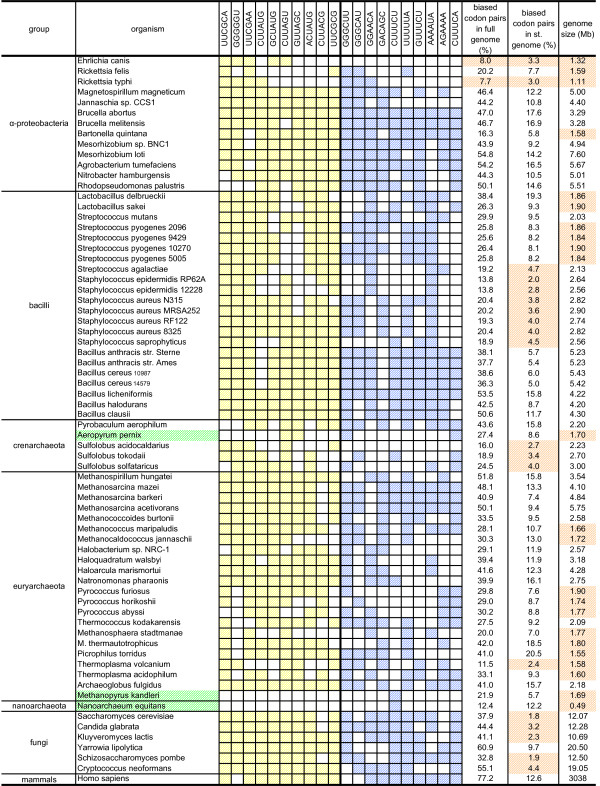
- Conserved biased pairs were uniformly distributed across the three domains, though five genomes were atypical; Buchnera aphidicola and Candidatus blochmannia pensilvanicus had bias in only 2.0% and 2.3% of codon pairs versus an average 37.7%, and even in standardized samples only 1.5% and 1.7%.
Methods
- The dataset comprised 138 organisms: 103 bacteria, 28 archaea, and 7 eukaryotes (six fungi and human); standardized genomes were built by randomly sampling 150,000 ± 1000 codon pairs.
- Observed counts were calculated for all 61 × 64 = 3904 sense:sense and sense:stop codon pairs; expected ORFeome values were normalized to dipeptide frequencies, while genome expected values used trinucleotide frequencies, with correction for out-frame UAA/UAG triplets.
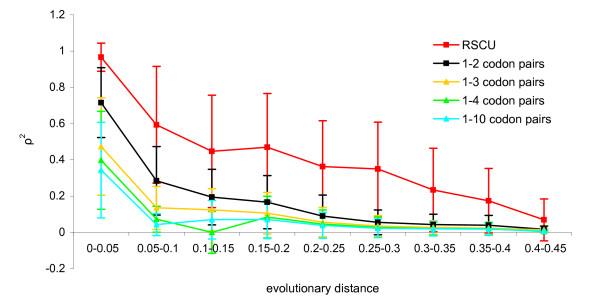
- Biased pairs were tested with two-tailed Fisher’s exact test (p ≤ 0.01; observed/expected ≤ 0.9 or ≥ 1.1) and marked conserved if significantly biased in at least 51% of organisms; z-scores compared sub-patterns, and RSCU/RDCU correlations and trees assessed evolutionary conservation.
Limitations
- The authors state that the eukaryotic sample is not representative because it is small and contains only one mammal.
- The authors state that no multiple correction methods were used at this point in the significance testing.
- Evident from the text: the conserved-bias criterion requires bias in more than 50% of organisms, so lineage-specific or rare biases are not captured; the authors note that some organisms use different sets of biased codon pairs or have very few biased pairs.
Model-written summary. Check it against the paper before relying on it.
Integrity signals
Registry
Cites
Statistics
Figures
Verification
Claims the paper makes
64 Own result · 33 Own interpretation · 13 No basis given · 11 Supported · 7 Partly supported · 7 Own method · 5 No full text of the sources · 2 Supported so far · accuracy not yet measured
Every source the paper cites for this claim was checked and supports it.
In the paper
“It is suggested that codon context biases are associated with translational efficiency, since codon context influences translational elongation rates [1].”
§ Preferred and avoided codon pairs in three domains of life > Background
What the sources say
- Supportedcites [1] Irwin B, Heck JD, Hatfield GW: Codon pair utilization biases influence translational elongation step times. J Biol Chem. 1995, 270 (39): 22801-22806. 10.1074/jbc.270.39.22801. source
The paper states that translational elongation rates are influenced by codon context. Its Discussion also reports that codon-pair bias is related to translational step times in E. coli, supporting the cited claim. (LLM, conf=0.94)
hedgeddirect- Asserted: passes — The authors put it forward as true.
- Checkable: passes — It can be checked against evidence.
- Load-bearing: passes — The paper’s conclusions depend on it.
- Based: passes — The paper gives a reason why it holds.
- Supported
Every source the paper cites for this claim was checked and supports it.
In the paper
“Moreover, experimental results support the observation that codon context is more strongly related to translational efficiency than single codon usage [1].”
§ Preferred and avoided codon pairs in three domains of life > Background
What the sources say
- Supportedcites [1] Irwin B, Heck JD, Hatfield GW: Codon pair utilization biases influence translational elongation step times. J Biol Chem. 1995, 270 (39): 22801-22806. 10.1074/jbc.270.39.22801. source
The Discussion states that translational efficiency is more closely related to codon context (codon-pair bias) than to individual codon utilization frequency. It supports this comparison with codon pairs containing the same frequently used codons but translated at different rates in opposite orientations. The finding concerns the codon pairs tested in E. coli. (LLM, conf=0.94)
boostedcorrelational- Asserted: passes — The authors put it forward as true.
- Checkable: passes — It can be checked against evidence.
- Load-bearing: passes — The paper’s conclusions depend on it.
- Based: passes — The paper gives a reason why it holds.
- Supported
Every source the paper cites for this claim was checked and supports it.
In the paper
“It has been shown that in five gamma proteobacteria, Bacillus subtilis and two yeasts, the A-site codons decoded by the same tRNA have similar patterns of P-site codon pairing preference [16].”
§ Preferred and avoided codon pairs in three domains of life > Background
What the sources say
- Supportedcites [16] Buchan JR, Aucott LS, Stansfield I: tRNA properties help shape codon pair preferences in open reading frames. Nucleic Acids Res. 2006, 34 (3): 1015-1027. 10.1093/nar/gkj488. source
The Results section reports that A-site codons decoded by the same tRNA cluster together in the gamma proteobacteria, B. subtilis, S. cerevisiae and S. pombe. It explains that this clustering means the codons have similar P-site pairing preferences. Our copy does not provide a page number. (LLM, conf=0.93)
plaincorrelational- Asserted: passes — The authors put it forward as true.
- Checkable: passes — It can be checked against evidence.
- Load-bearing: passes — The paper’s conclusions depend on it.
- Based: passes — The paper gives a reason why it holds.
- Supported
The cited sources support only part of this claim — read each source’s verdict below.
In the paper
“Mononucleotide repeats, especially poly(A) and poly(U) tracts, are also known to cause transcriptional and translational frameshifting [8-10].”
§ Preferred and avoided codon pairs in three domains of life > Discussion
What the sources say
- Partly supportedcites [8] Baranov PV, Hammer AW, Zhou J, Gesteland RF, Atkins JF: Transcriptional slippage in bacteria: distribution in sequenced genomes and utilization in IS element gene expression. Genome Biol. 2005, 6 (3): R25-10.1186/gb-2005-6-3-r25. sourceExperimental — accuracy not yet measured
The Background describes transcriptional slippage at a run of nine As, producing mRNAs with different reading frames. It also describes ribosomal frameshifting in E. coli, but does not establish that poly(A) or poly(U) tracts cause that translational frameshifting. The Discussion likewise supports transcriptional slippage on A and T runs, not both mechanisms. (LLM, conf=0.84)
- Partly supportedcites [9] Wagner LA, Weiss RB, Driscoll R, Dunn DS, Gesteland RF: Transcriptional slippage occurs during elongation at runs of adenine or thymine in Escherichia coli. Nucleic Acids Res. 1990, 18 (12): 3529-3535. 10.1093/nar/18.12.3529. sourceExperimental — accuracy not yet measured
The title (p. 3529) identifies transcriptional slippage at runs of adenine or thymine in E. coli, supporting the transcriptional part of the claim. The available passage does not address translational frameshifting or establish the claim for mononucleotide repeats generally. (LLM, conf=0.82)
- Partly supportedcites [10] Gurvich OL, Baranov PV, Zhou J, Hammer AW, Gesteland RF, Atkins JF: Sequences that direct significant levels of frameshifting are frequent in coding regions of Escherichia coli. Embo J. 2003, 22 (21): 5941-5950. 10.1093/emboj/cdg561. sourceExperimental — accuracy not yet measured
The A_AAA_AAG section reports ribosomal frameshifting at an A-rich sequence, and the CCC_UGA section reports frameshifting during translation at UUU_U/C. These support the translational part of the claim, but the paper does not establish that mononucleotide repeats cause transcriptional frameshifting. (LLM, conf=0.86)
boosteddirect- Asserted: passes — The authors put it forward as true.
- Checkable: passes — It can be checked against evidence.
- Load-bearing: passes — The paper’s conclusions depend on it.
- Based: passes — The paper gives a reason why it holds.
- Partly supported
A result the paper reports from its own data — it cites no other source for it, so there is none to check. The quote shows it is in the paper.
In the paper
“Still, with one exception (codon pair UUUUUU and pattern UnnnnU), all sub-patterns contained a fixed nucleotide in the last position of the P-site codon in the codon pair.”
§ Preferred and avoided codon pairs in three domains of life > Discussion
plain- Asserted: passes — The authors put it forward as true.
- Checkable: passes — It can be checked against evidence.
- Load-bearing: passes — The paper’s conclusions depend on it.
- Based: passes — The paper gives a reason why it holds.
The paper states this without a source or data behind it here, so there is nothing to check it against. The quote shows it is in the paper.
In the paper
“As in the conserved avoided codon pairs, all the different preferred sub-patterns that caused codon pair preferences contained a fixed last nucleotide of the P-site codon in the pair.”
§ Preferred and avoided codon pairs in three domains of life > Results > Over-represented codon pairs can be divided into 4 types
plaindirect- Asserted: passes — The authors put it forward as true.
- Checkable: passes — It can be checked against evidence.
- Load-bearing: passes — The paper’s conclusions depend on it.
- Based: passes — The paper gives a reason why it holds.
A result the paper reports from its own data — it cites no other source for it, so there is none to check. The quote shows it is in the paper.
In the paper
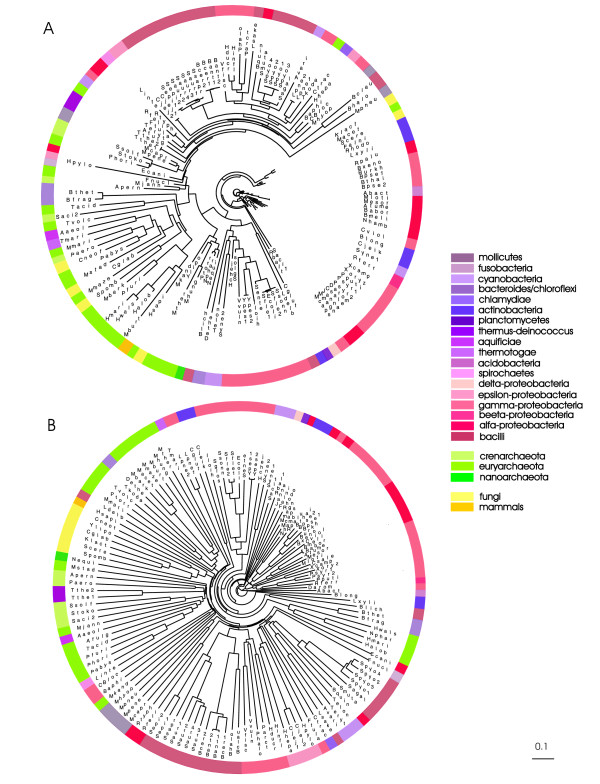
“Some were similarly clustered in both trees, e.g. bacilli, gamma-proteobacteria and alpha-proteobacteria.”
§ Preferred and avoided codon pairs in three domains of life > Results > Evolutionary conservation of codon context
plaincorrelational- Asserted: passes — The authors put it forward as true.
- Checkable: passes — It can be checked against evidence.
- Load-bearing: passes — The paper’s conclusions depend on it.
- Based: passes — The paper gives a reason why it holds.
A result the paper reports from its own data — it cites no other source for it, so there is none to check. The quote shows it is in the paper.
In the paper
“The third type, type 3A contained the pattern nnCGCn.”
§ Preferred and avoided codon pairs in three domains of life > Results > Under-represented codon pairs can be divided into 9 major types
plain- Asserted: passes — The authors put it forward as true.
- Checkable: passes — It can be checked against evidence.
- Load-bearing: unclear — It is unclear whether the paper’s conclusions depend on it.
- Based: passes — The paper gives a reason why it holds.
The paper states this without a source or data behind it here, so there is nothing to check it against. The quote shows it is in the paper.
In the paper
“It is interesting to note that this codon pair contains several clearly avoided sub-patterns (UUCGnn, nnCGCn, nnCnnA).”
§ Preferred and avoided codon pairs in three domains of life > Results > Under-represented codon pairs can be divided into 9 major types
boosted- Asserted: passes — The authors put it forward as true.
- Checkable: passes — It can be checked against evidence.
- Load-bearing: unclear — It is unclear whether the paper’s conclusions depend on it.
- Based: passes — The paper gives a reason why it holds.
A result the paper reports from its own data — it cites no other source for it, so there is none to check. The quote shows it is in the paper.
In the paper
“All the major types were more strongly over-represented in ORFeomes than in genomes, again indicating that the common preference of codon pairs that we detected is mainly influenced by translational mechanisms.”
§ Preferred and avoided codon pairs in three domains of life > Results > Over-represented codon pairs can be divided into 4 types
plaincorrelational- Asserted: passes — The authors put it forward as true.
- Checkable: passes — It can be checked against evidence.
- Load-bearing: passes — The paper’s conclusions depend on it.
- Based: passes — The paper gives a reason why it holds.
- Probably not a substantial claim. 22
- It may state two separate claims as one. 21
Every source the paper cites for this claim was checked and supports it.
In the paper
“For example, it has been shown that certain heptanucleotides that are prone to frameshifts are under-represented in the coding sequences of Saccharomyces cerevisiae [15] and Escherichia coli [10].”
§ Preferred and avoided codon pairs in three domains of life > Background
What the sources say
- Supportedcites [15] Shah AA, Giddings MC, Parvaz JB, Gesteland RF, Atkins JF, Ivanov IP: Computational identification of putative programmed translational frameshift sites. Bioinformatics. 2002, 18 (8): 1046-1053. 10.1093/bioinformatics/18.8.1046. source
The cited paper supports the yeast portion of the sentence, which is the part attached to this citation; the E. coli portion has a separate citation. In “Summary of results for phase I heptamers,” it reports that two known yeast frameshift heptanucleotides occur substantially less often in S. cerevisiae coding sequences than expected. (LLM, conf=0.93)
- Supportedcites [10] Gurvich OL, Baranov PV, Zhou J, Hammer AW, Gesteland RF, Atkins JF: Sequences that direct significant levels of frameshifting are frequent in coding regions of Escherichia coli. Embo J. 2003, 22 (21): 5941-5950. 10.1093/emboj/cdg561. source
The Abstract reports moderate selection against the frameshift-prone A_AAA_AAG sequence in E. coli coding regions, and the A_AAA_AAG section reiterates that conclusion. This supports the E. coli portion attributed to this source; the sentence cites a different source for Saccharomyces cerevisiae. (LLM, conf=0.91)
plain- Asserted: passes — The authors put it forward as true.
- Checkable: passes — It can be checked against evidence.
- Load-bearing: fails — The paper’s conclusions may not depend on it.
- Based: passes — The paper gives a reason why it holds.
Probably not a substantial claim. The paper’s conclusions may not depend on it.
- Supported
The cited sources support only part of this claim — read each source’s verdict below.
In the paper
“The main selective effects on codon context are found in the nucleotides following the codon in the 3' direction [16,18,19,22].”
§ Preferred and avoided codon pairs in three domains of life > Background
What the sources say
- Partly supportedcites [16] Buchan JR, Aucott LS, Stansfield I: tRNA properties help shape codon pair preferences in open reading frames. Nucleic Acids Res. 2006, 34 (3): 1015-1027. 10.1093/nar/gkj488. sourceExperimental — accuracy not yet measured
The Discussion reports significant interactions between a codon’s third nucleotide (cP3) and nucleotides in the following A-site codon. But it calls cP3 itself cardinal to pairing frequencies, so it does not locate the main effects solely in nucleotides following the codon. No page number is available in our copy. (LLM, conf=0.82)
- Supportedcites [18] Berg OG, Silva PJ: Codon bias in Escherichia coli: the influence of codon context on mutation and selection. Nucleic Acids Res. 1997, 25 (7): 1397-1404. 10.1093/nar/25.7.1397. source
The Results state that strong selective context effects occur only at position N1, while effects from more distant positions appear mostly mutational. The Discussion likewise says selection is influenced mostly by N1, the first position in the following codon. (LLM, conf=0.94)
- Not checked — no full text of the sourcecites [19] Fedorov A, Saxonov S, Gilbert W: Regularities of context-dependent codon bias in eukaryotic genes. Nucleic Acids Res. 2002, 30 (5): 1192-1197. 10.1093/nar/30.5.1192. source
- Partly supportedcites [22] Moura G, Pinheiro M, Arrais J, Gomes AC, Carreto L, Freitas A, Oliveira JL, Santos MA: Large scale comparative codon-pair context analysis unveils general rules that fine-tune evolution of mRNA primary structure. PLoS ONE. 2007, 2 (9): e847-10.1371/journal.pone.0000847. sourceExperimental — accuracy not yet measured
The Introduction (page unavailable) says the strongest neighboring-nucleotide influence arises from the interplay between a codon’s last nucleotide and the next codon’s first nucleotide. The Results section on genome and translation biases likewise finds that this pair discriminates codon-pair preferences. These passages support an important role for a nucleotide in the 3′ direction, but not the claim that the main effects reside in the following nucleotides alone. (LLM, conf=0.82)
plaindirect- Asserted: passes — The authors put it forward as true.
- Checkable: passes — It can be checked against evidence.
- Load-bearing: fails — The paper’s conclusions may not depend on it.
- Based: passes — The paper gives a reason why it holds.
Probably not a substantial claim. The paper’s conclusions may not depend on it.
- Partly supported
The cited sources support only part of this claim — read each source’s verdict below.
In the paper
“In addition, codons in combination with surrounding nucleotides can form mononucleotide repeats, which may cause transcriptional [8,9] or translational [10] slippage.”
§ Preferred and avoided codon pairs in three domains of life > Background
What the sources say
- Supportedcites [8] Baranov PV, Hammer AW, Zhou J, Gesteland RF, Atkins JF: Transcriptional slippage in bacteria: distribution in sequenced genomes and utilization in IS element gene expression. Genome Biol. 2005, 6 (3): R25-10.1186/gb-2005-6-3-r25. source
The Background (page unavailable) says that long poly(A) or poly(T) tracts cause transcriptional slippage, including when a slippery sequence occurs in a coding region. The Results (page unavailable) also discuss how codon usage affects A/T runs. In the citing sentence, translational slippage is attributed to a different citation, not this paper. (LLM, conf=0.90)
- Partly supportedcites [9] Wagner LA, Weiss RB, Driscoll R, Dunn DS, Gesteland RF: Transcriptional slippage occurs during elongation at runs of adenine or thymine in Escherichia coli. Nucleic Acids Res. 1990, 18 (12): 3529-3535. 10.1093/nar/18.12.3529. sourceExperimental — accuracy not yet measured
The title (p. 3529) states that transcriptional slippage occurs at runs of adenine or thymine, supporting the transcriptional-slippage part of the claim. The available passage does not say that codons combine with surrounding nucleotides to form those runs. The separate citation for translational slippage is not being judged here. (LLM, conf=0.77)
- Supportedcites [10] Gurvich OL, Baranov PV, Zhou J, Hammer AW, Gesteland RF, Atkins JF: Sequences that direct significant levels of frameshifting are frequent in coding regions of Escherichia coli. Embo J. 2003, 22 (21): 5941-5950. 10.1093/emboj/cdg561. source
Citation [10] is attached to translational slippage, not transcriptional slippage. The A_AAA_AAG section describes a run of adenines spanning codon boundaries that supports ribosomal frameshifting, and the Statistical analysis section says surrounding sequence context affects its efficiency (page numbers unavailable). (LLM, conf=0.90)
hedgedconditional- Asserted: passes — The authors put it forward as true.
- Checkable: passes — It can be checked against evidence.
- Load-bearing: fails — The paper’s conclusions may not depend on it.
- Based: passes — The paper gives a reason why it holds.
Probably not a substantial claim. The paper’s conclusions may not depend on it. It may state two separate claims as one.
- Supported
The cited sources support only part of this claim — read each source’s verdict below.
In the paper
“Codon context can influence both mis-sense and nonsense suppression [2-7].”
§ Preferred and avoided codon pairs in three domains of life > Background
What the sources say
- Not checked — no full text of the sourcecites [2] Murgola EJ, Pagel FT, Hijazi KA: Codon context effects in missense suppression. J Mol Biol. 1984, 175 (1): 19-27. 10.1016/0022-2836(84)90442-X. source
- Not checked — no full text of the sourcecites [3] Bossi L, Ruth JR: The influence of codon context on genetic code translation. Nature. 1980, 286 (5769): 123-127. 10.1038/286123a0. source
- Not checked — no full text of the sourcecites [4] Miller JH, Albertini AM: Effects of surrounding sequence on the suppression of nonsense codons. J Mol Biol. 1983, 164 (1): 59-71. 10.1016/0022-2836(83)90087-6. source
- Not checked — no full text of the sourcecites [5] Kopelowitz J, Hampe C, Goldman R, Reches M, Engelberg-Kulka H: Influence of codon context on UGA suppression and readthrough. J Mol Biol. 1992, 225 (2): 261-269. 10.1016/0022-2836(92)90920-F. source
- Could not verifycites [6] Stormo GD, Schneider TD, Gold L: Quantitative analysis of the relationship between nucleotide sequence and functional activity. Nucleic Acids Res. 1986, 14 (16): 6661-6679. 10.1093/nar/14.16.6661. sourceExperimental — accuracy not yet measured
The available copy contains an abstract and a selected-reference list, but no body text to assess the claim. Searches for mis-sense and nonsense suppression and for context effects on suppression by su2 found no passage in the paper’s body addressing both; the decisive full-text discussion may be missing from the indexed copy. (LLM, conf=0.73)
- Partly supportedcites [7] Curran JF, Poole ES, Tate WP, Gross BL: Selection of aminoacyl-tRNAs at sense codons: the size of the tRNA variable loop determines whether the immediate 3' nucleotide to the codon has a context effect. Nucleic Acids Res. 1995, 23 (20): 4104-4108. 10.1093/nar/23.20.4104. sourceExperimental — accuracy not yet measured
The Abstract reports that the nucleotide following a codon can affect translation by amber suppressors and describes a re-examination of amber-suppression data, supporting the nonsense-suppression part. The study measures tRNA selection at sense codons, but the supplied text does not report an effect on missense suppression; that topic appears only in a Selected References title. No page numbers are available in our copy. (LLM, conf=0.84)
plaindirect- Asserted: passes — The authors put it forward as true.
- Checkable: passes — It can be checked against evidence.
- Load-bearing: fails — The paper’s conclusions may not depend on it.
- Based: passes — The paper gives a reason why it holds.
Probably not a substantial claim. The paper’s conclusions may not depend on it. It may state two separate claims as one.
The sources with a verdict support this claim; the rest weren’t checked yet, have no full text we could read, or their verdicts aren’t rated yet.
In the paper
“Previous studies suggest that the effects of codon context are influenced by the physical interactions between tRNA isoacceptors in the ribosomal P- and A-sites [1,16,23].”
§ Preferred and avoided codon pairs in three domains of life > Background
What the sources say
- Supportedcites [1] Irwin B, Heck JD, Hatfield GW: Codon pair utilization biases influence translational elongation step times. J Biol Chem. 1995, 270 (39): 22801-22806. 10.1074/jbc.270.39.22801. source
The opening section says codon-context effects are related to the compatibility of adjacent tRNA isoacceptors on a translating ribosome. It also identifies those tRNAs as occupying the A- and P-sites. This supports the citing sentence’s hedged description of physical interactions. (LLM, conf=0.92)
- Supportedcites [16] Buchan JR, Aucott LS, Stansfield I: tRNA properties help shape codon pair preferences in open reading frames. Nucleic Acids Res. 2006, 34 (3): 1015-1027. 10.1093/nar/gkj488. source
The Abstract says the study sought evidence of A- and P-site tRNA interaction and found that tRNA identity influences codon-pair preference. The Discussion describes a possible structural mechanism involving the juxtaposition of tRNAs in those sites. Because the citing sentence says “suggest,” it preserves the paper’s uncertainty about the physical mechanism. (LLM, conf=0.89)
- Not checked — no full text of the sourcecites [23] Smith D, Yarus M: tRNA-tRNA interactions within cellular ribosomes. Proc Natl Acad Sci USA. 1989, 86 (12): 4397-4401. 10.1073/pnas.86.12.4397. source
hedgedconditional- Asserted: passes — The authors put it forward as true.
- Checkable: passes — It can be checked against evidence.
- Load-bearing: passes — The paper’s conclusions depend on it.
- Based: passes — The paper gives a reason why it holds.
Probably not a substantial claim.
- Supported
Every source the paper cites for this claim was checked and supports it.
In the paper
“It has been found that the specific preferred or avoided nucleotide patterns differ among species [16,22].”
§ Preferred and avoided codon pairs in three domains of life > Background
What the sources say
- Supportedcites [16] Buchan JR, Aucott LS, Stansfield I: tRNA properties help shape codon pair preferences in open reading frames. Nucleic Acids Res. 2006, 34 (3): 1015-1027. 10.1093/nar/gkj488. source
The Discussion states that the specific cP3-cA2 nucleotide combinations selected for and against differ between species. This directly supports the claim about species-specific preferred and avoided nucleotide patterns in codon pairs. (LLM, conf=0.94)
- Supportedcites [22] Moura G, Pinheiro M, Arrais J, Gomes AC, Carreto L, Freitas A, Oliveira JL, Santos MA: Large scale comparative codon-pair context analysis unveils general rules that fine-tune evolution of mRNA primary structure. PLoS ONE. 2007, 2 (9): e847-10.1371/journal.pone.0000847. source
The Results section, “Codon-pair context preferences are species specific,” says codon-pair preferences differ across the three domains of life and explicitly describes the context maps as species-specific. Figure 4 also contrasts preferred and rejected dinucleotide patterns among organisms. The paper notes some shared patterns, but these do not undermine the claim about specific patterns differing. (LLM, conf=0.93)
plaincorrelational- Asserted: passes — The authors put it forward as true.
- Checkable: passes — It can be checked against evidence.
- Load-bearing: passes — The paper’s conclusions depend on it.
- Based: passes — The paper gives a reason why it holds.
Probably not a substantial claim.
- Supported
Every source the paper cites for this claim was checked and supports it.
In the paper
“It has been proposed that codon context is even more important than single codon usage for translational efficiency [1].”
§ Preferred and avoided codon pairs in three domains of life > Results > Evolutionary conservation of codon context
What the sources say
- Supportedcites [1] Irwin B, Heck JD, Hatfield GW: Codon pair utilization biases influence translational elongation step times. J Biol Chem. 1995, 270 (39): 22801-22806. 10.1074/jbc.270.39.22801. source
The Discussion explicitly says translational efficiency is more closely related to codon context (codon-pair bias) than to individual-codon utilization frequency. The paper bases this proposal on comparisons of selected codon pairs in E. coli and cautions that only a small number of pairs were studied. (LLM, conf=0.93)
hedgedcorrelational- Asserted: fails — The authors may not put it forward as true.
- Checkable: passes — It can be checked against evidence.
- Load-bearing: fails — The paper’s conclusions may not depend on it.
- Based: passes — The paper gives a reason why it holds.
Probably not a substantial claim. The authors may not put it forward as true. The paper’s conclusions may not depend on it.
- Supported
Every source the paper cites for this claim was checked and supports it.
In the paper
“It was shown recently that the species specific combinations of three consecutive codons are highly biased among fungal species and even reaching to the complete vanishing of certain combinations [27].”
§ Preferred and avoided codon pairs in three domains of life > Background
What the sources say
- Supportedcites [27] Moura GR, Lousado JP, Pinheiro M, Carreto L, Silva RM, Oliveira JL, Santos MA: Codon-triplet context unveils unique features of the Candida albicans protein coding genome. BMC Genomics. 2007, 8: 444-10.1186/1471-2164-8-444. source
The Results section, “Codon-triplets in fungal genomes,” reports ORFeome-specific patterns of preference and rejection across 11 fungal ORFeomes. It also reports that many codon-triplets were absent from those ORFeomes, matching the claim that some combinations vanished. (LLM, conf=0.94)
plaincorrelational- Asserted: passes — The authors put it forward as true.
- Checkable: passes — It can be checked against evidence.
- Load-bearing: fails — The paper’s conclusions may not depend on it.
- Based: passes — The paper gives a reason why it holds.
Probably not a substantial claim. The paper’s conclusions may not depend on it.
- Supported
The cited sources support only part of this claim — read each source’s verdict below.
In the paper
“In addition, it has been confirmed that E-site occupation is essential for preventing frameshift [24-26].”
§ Preferred and avoided codon pairs in three domains of life > Background
What the sources say
- Not checked — no full text of the sourcecites [24] Marquez V, Wilson DN, Tate WP, Triana-Alonso F, Nierhaus KH: Maintaining the ribosomal reading frame: the influence of the E site during translational regulation of release factor 2. Cell. 2004, 118 (1): 45-55. 10.1016/j.cell.2004.06.012. source
- Partly supportedcites [25] Trimble MJ, Minnicus A, Williams KP: tRNA slippage at the tmRNA resume codon. Rna. 2004, 10 (5): 805-812. 10.1261/rna.7010904. sourceExperimental — accuracy not yet measured
In “Correlation of P-site slippage with unusual E-site filling” (page not provided), the paper proposes that E-site tRNA may help prevent P-site slippage. It presents this as a possibility that could explain frameshifting at the tmRNA resume codon, not as confirmation that E-site occupation is essential for preventing frameshifts. (LLM, conf=0.88)
- Could not verifycites [26] Geigenmuller U, Nierhaus KH: Significance of the third tRNA binding site, the E site, on E. coli ribosomes for the accuracy of translation: an occupied E site prevents the binding of non-cognate aminoacyl-tRNA to the A site. Embo J. 1990, 9 (13): 4527-4533. sourceExperimental — accuracy not yet measured
The section on cognate E-site occupation reports that it prevents non-cognate aminoacyl-tRNA from interfering with A-site decoding. Neither that section nor passages retrieved for frameshifting and reading-frame maintenance address whether E-site occupation is essential to prevent frameshifts. (LLM, conf=0.74)
boosteddirect- Asserted: passes — The authors put it forward as true.
- Checkable: passes — It can be checked against evidence.
- Load-bearing: fails — The paper’s conclusions may not depend on it.
- Based: passes — The paper gives a reason why it holds.
Probably not a substantial claim. The paper’s conclusions may not depend on it.
Every source the paper cites for this claim was checked and supports it.
In the paper
“Previously, the only universal context selection rule found to cover all three domains of life was the avoidance of most codon pairs of the nnUAnn type, which was suggested to result from rejection of TA dinucleotides in DNA sequences [22].”
§ Preferred and avoided codon pairs in three domains of life > Discussion
What the sources say
- Supportedcites [22] Moura G, Pinheiro M, Arrais J, Gomes AC, Carreto L, Freitas A, Oliveira JL, Santos MA: Large scale comparative codon-pair context analysis unveils general rules that fine-tune evolution of mRNA primary structure. PLoS ONE. 2007, 2 (9): e847-10.1371/journal.pone.0000847. source
The Discussion (Influence of translational biases on codon-pair context) calls rejection of most NNU3-A1NN codon pairs the unique universal rule found across 119 genomes and attributes the trend to repression of TpA dinucleotides in DNA. The Results (Codon-pair context is influenced by genome and mRNA translation biases) also reports UA dinucleotide rejection across the three domains of life. (LLM, conf=0.95)
hedgedconditional- Asserted: passes — The authors put it forward as true.
- Checkable: passes — It can be checked against evidence.
- Load-bearing: fails — The paper’s conclusions may not depend on it.
- Based: passes — The paper gives a reason why it holds.
Probably not a substantial claim. The paper’s conclusions may not depend on it. It may state two separate claims as one.
- Supported
The cited sources support only part of this claim — read each source’s verdict below.
In the paper
“One is the possible decrease of frameshifting errors through avoidance of mononucleotide repeats [8-10].”
§ Preferred and avoided codon pairs in three domains of life > Discussion
What the sources say
- Partly supportedcites [8] Baranov PV, Hammer AW, Zhou J, Gesteland RF, Atkins JF: Transcriptional slippage in bacteria: distribution in sequenced genomes and utilization in IS element gene expression. Genome Biol. 2005, 6 (3): R25-10.1186/gb-2005-6-3-r25. sourceExperimental — accuracy not yet measured
The Results section reports that A/T runs are avoided in some prokaryotic coding regions, and the Discussion links their underrepresentation to slippage and possible frameshift errors. The paper does not establish that this avoidance shapes codon-pair preferences specifically; it also says it cannot distinguish transcriptional from replication-level slippage. (LLM, conf=0.82)
- Partly supportedcites [9] Wagner LA, Weiss RB, Driscoll R, Dunn DS, Gesteland RF: Transcriptional slippage occurs during elongation at runs of adenine or thymine in Escherichia coli. Nucleic Acids Res. 1990, 18 (12): 3529-3535. 10.1093/nar/18.12.3529. sourceExperimental — accuracy not yet measured
The available passage (title, p. 3529) says that transcriptional slippage occurs at runs of adenine or thymine in E. coli, supporting the connection between nucleotide repeats and slippage. It does not say that avoiding those repeats decreases frameshifting errors or shapes codon-pair preferences; searches for those terms returned no further passages. (LLM, conf=0.72)
- Supportedcites [10] Gurvich OL, Baranov PV, Zhou J, Hammer AW, Gesteland RF, Atkins JF: Sequences that direct significant levels of frameshifting are frequent in coding regions of Escherichia coli. Embo J. 2003, 22 (21): 5941-5950. 10.1093/emboj/cdg561. source
The A_AAA_AAG section reports that this frameshift-prone sequence, which contains a run of A nucleotides, is moderately under-represented in E. coli coding regions compared with the non-shifty codon arrangement A_AAG_AAA. The paper interprets this as selection against a shift-prone sequence, supporting the cited sentence’s proposed link between codon arrangements and fewer frameshifting errors. Page numbers are unavailable in our copy. (LLM, conf=0.88)
hedgedconditional- Asserted: passes — The authors put it forward as true.
- Checkable: passes — It can be checked against evidence.
- Load-bearing: fails — The paper’s conclusions may not depend on it.
- Based: passes — The paper gives a reason why it holds.
Probably not a substantial claim. The paper’s conclusions may not depend on it.
- Partly supported
The sources with a verdict support this claim; the rest weren’t checked yet, have no full text we could read, or their verdicts aren’t rated yet.
In the paper
“In addition, it has been suggested that codon context might be influenced by certain structural constraints imposed by two tRNAs occupying the ribosomal P- and A-sites [1,16,23].”
§ Preferred and avoided codon pairs in three domains of life > Discussion
What the sources say
- Supportedcites [1] Irwin B, Heck JD, Hatfield GW: Codon pair utilization biases influence translational elongation step times. J Biol Chem. 1995, 270 (39): 22801-22806. 10.1074/jbc.270.39.22801. source
The paper’s introductory passage says translation rates are influenced by the compatibility of adjacent tRNAs in the ribosomal A- and P-sites. Its opening summary likewise relates codon-context effects to adjacent tRNA compatibility. The citing sentence presents this as a suggestion, consistent with the source’s wording. (LLM, conf=0.93)
- Supportedcites [16] Buchan JR, Aucott LS, Stansfield I: tRNA properties help shape codon pair preferences in open reading frames. Nucleic Acids Res. 2006, 34 (3): 1015-1027. 10.1093/nar/gkj488. source
The Discussion suggests that P- and A-site interactions may affect the geometry needed for optimal tRNA juxtaposition, and that nearby A-site tRNA structures may influence positioning. This supports the citing sentence’s tentative claim about structural constraints on codon context. (LLM, conf=0.91)
- Not checked — no full text of the sourcecites [23] Smith D, Yarus M: tRNA-tRNA interactions within cellular ribosomes. Proc Natl Acad Sci USA. 1989, 86 (12): 4397-4401. 10.1073/pnas.86.12.4397. source
hedgedconditional- Asserted: passes — The authors put it forward as true.
- Checkable: passes — It can be checked against evidence.
- Load-bearing: fails — The paper’s conclusions may not depend on it.
- Based: passes — The paper gives a reason why it holds.
Probably not a substantial claim. The paper’s conclusions may not depend on it.
- Supported
The cited sources support only part of this claim — read each source’s verdict below.
In the paper
“It has been shown that the E-site tRNA can influence decoding in the A-site [24-26].”
§ Preferred and avoided codon pairs in three domains of life > Discussion
What the sources say
- Not checked — no full text of the sourcecites [24] Marquez V, Wilson DN, Tate WP, Triana-Alonso F, Nierhaus KH: Maintaining the ribosomal reading frame: the influence of the E site during translational regulation of release factor 2. Cell. 2004, 118 (1): 45-55. 10.1016/j.cell.2004.06.012. source
- Partly supportedcites [25] Trimble MJ, Minnicus A, Williams KP: tRNA slippage at the tmRNA resume codon. Rna. 2004, 10 (5): 805-812. 10.1261/rna.7010904. sourceExperimental — accuracy not yet measured
In “Correlation of P-site slippage with unusual E-site filling” (page unavailable), the paper proposes that E-site tRNA may stabilize codon–anticodon pairing in the P site. It does not show that E-site tRNA influences decoding in the A site; its A-site discussion concerns how slow decoding may allow P-site slippage. (LLM, conf=0.79)
- Supportedcites [26] Geigenmuller U, Nierhaus KH: Significance of the third tRNA binding site, the E site, on E. coli ribosomes for the accuracy of translation: an occupied E site prevents the binding of non-cognate aminoacyl-tRNA to the A site. Embo J. 1990, 9 (13): 4527-4533. source
The section ‘Cognate E site occupation prevents the interference of non-cognate aminoacyl-tRNA with the decoding process at the A site’ reports that cognate E-site occupation lowers A-site affinity and prevents non-cognate tRNAs from interfering with decoding. This directly supports the broad claim that E-site tRNA can influence A-site decoding. (LLM, conf=0.94)
plaindirect- Asserted: passes — The authors put it forward as true.
- Checkable: passes — It can be checked against evidence.
- Load-bearing: passes — The paper’s conclusions depend on it.
- Based: passes — The paper gives a reason why it holds.
Probably not a substantial claim.
Every source the paper cites for this claim was checked and supports it.
In the paper
“It has been proposed that codon context is even more important than codon usage for translational efficiency [1].”
§ Preferred and avoided codon pairs in three domains of life > Discussion
What the sources say
- Supportedcites [1] Irwin B, Heck JD, Hatfield GW: Codon pair utilization biases influence translational elongation step times. J Biol Chem. 1995, 270 (39): 22801-22806. 10.1074/jbc.270.39.22801. source
The Discussion explicitly concludes from a comparison of codon pairs in E. coli that translational efficiency is more closely related to codon context than to individual-codon usage frequency. The citing sentence presents this as a proposal, consistent with the paper's cautious framing. (LLM, conf=0.93)
hedgedcorrelational- Asserted: fails — The authors may not put it forward as true.
- Checkable: passes — It can be checked against evidence.
- Load-bearing: fails — The paper’s conclusions may not depend on it.
- Based: passes — The paper gives a reason why it holds.
Probably not a substantial claim. The authors may not put it forward as true. The paper’s conclusions may not depend on it.
- Supported
Every source the paper cites for this claim was checked and supports it.
In the paper
“It was shown that the usage of three neighbouring codons is species specific among fungi [27].”
§ Preferred and avoided codon pairs in three domains of life > Discussion
What the sources say
- Supportedcites [27] Moura GR, Lousado JP, Pinheiro M, Carreto L, Silva RM, Oliveira JL, Santos MA: Codon-triplet context unveils unique features of the Candida albicans protein coding genome. BMC Genomics. 2007, 8: 444-10.1186/1471-2164-8-444. source
The Results section (“Codon-triplets in fungal genomes”) reports that patterns of codon-triplet preference and rejection were specific to each of the 11 fungal ORFeomes studied. The Discussion (“Context of codon-triplets”) also refers to the species specificity found. This supports the claim about neighbouring-codon usage among the fungi examined. (LLM, conf=0.92)
plaincorrelational- Asserted: passes — The authors put it forward as true.
- Checkable: passes — It can be checked against evidence.
- Load-bearing: passes — The paper’s conclusions depend on it.
- Based: passes — The paper gives a reason why it holds.
Probably not a substantial claim.
- Supported
Every source the paper cites for this claim was checked and supports it.
In the paper
“In addition, it was shown in fungi that the combinations of three consecutive codons are biased and some combinations are even vanished from the ORFeomes [27].”
§ Preferred and avoided codon pairs in three domains of life > Discussion
What the sources say
- Supportedcites [27] Moura GR, Lousado JP, Pinheiro M, Carreto L, Silva RM, Oliveira JL, Santos MA: Codon-triplet context unveils unique features of the Candida albicans protein coding genome. BMC Genomics. 2007, 8: 444-10.1186/1471-2164-8-444. source
The Results section (“Codon-triplets in fungal genomes”) reports preferences and rejections among codon-triplets in 11 fungal ORFeomes. It also reports that some codon-triplet combinations were absent from those ORFeomes. (LLM, conf=0.95)
plaincorrelational- Asserted: passes — The authors put it forward as true.
- Checkable: passes — It can be checked against evidence.
- Load-bearing: passes — The paper’s conclusions depend on it.
- Based: passes — The paper gives a reason why it holds.
Probably not a substantial claim. It may state two separate claims as one.
- Supported
A result the paper reports from its own data — it cites no other source for it, so there is none to check. The quote shows it is in the paper.
In the paper
“The most conserved preferred codon pair, GGGCUU, was over-represented in 76% of the organisms studied and also belonged to Type 1P.”
§ Preferred and avoided codon pairs in three domains of life > Results > Over-represented codon pairs can be divided into 4 types
plaincorrelational- Asserted: passes — The authors put it forward as true.
- Checkable: passes — It can be checked against evidence.
- Load-bearing: unclear — It is unclear whether the paper’s conclusions depend on it.
- Based: passes — The paper gives a reason why it holds.
It may state two separate claims as one.
A result the paper reports from its own data — it cites no other source for it, so there is none to check. The quote shows it is in the paper.
In the paper
“Even in the standardized sample, most other genomes showed bias in 5–15% codon pairs, whereas B. aphidicola and C. blochmannia had only 1.5% and 1.7% biased codons respectively.”
§ Preferred and avoided codon pairs in three domains of life > Results > Five genomes had atypical sets of biased codon pairs
plain- Asserted: passes — The authors put it forward as true.
- Checkable: passes — It can be checked against evidence.
- Load-bearing: passes — The paper’s conclusions depend on it.
- Based: passes — The paper gives a reason why it holds.
It may state two separate claims as one.
A result the paper reports from its own data — it cites no other source for it, so there is none to check. The quote shows it is in the paper.
In the paper
“All three began with GGUA and did not show strong avoidance on the ORFeome level.”
§ Preferred and avoided codon pairs in three domains of life > Results > Under-represented codon pairs can be divided into 9 major types
plain- Asserted: passes — The authors put it forward as true.
- Checkable: passes — It can be checked against evidence.
- Load-bearing: unclear — It is unclear whether the paper’s conclusions depend on it.
- Based: passes — The paper gives a reason why it holds.
It may state two separate claims as one.
A result the paper reports from its own data — it cites no other source for it, so there is none to check. The quote shows it is in the paper.
In the paper
“On average, nnUAnn codon pairs are more frequently avoided in ORFeomes than in genomes.”
- Also stated in: § Under-represented codon pairs can be divided into 9 major types · plain
“Among the avoided nnUAnn codon pairs, 75.7% were more strongly avoided on average in the ORFeome than in the genome (Table 2).”
§ Preferred and avoided codon pairs in three domains of life > Abstract > Results
plaincorrelational- Asserted: passes — The authors put it forward as true.
- Checkable: passes — It can be checked against evidence.
- Load-bearing: passes — The paper’s conclusions depend on it.
- Based: passes — The paper gives a reason why it holds.
It may state two separate claims as one.
- Also stated in: § Under-represented codon pairs can be divided into 9 major types · plain
A result the paper reports from its own data — it cites no other source for it, so there is none to check. The quote shows it is in the paper.
In the paper
“In contrast, eukaryotes showed different patterns, being spread around the codon usage tree (Figure 6A), but clustered together in the codon context tree (Figure 6B).”
§ Preferred and avoided codon pairs in three domains of life > Results > Evolutionary conservation of codon context
plaincorrelational- Asserted: passes — The authors put it forward as true.
- Checkable: passes — It can be checked against evidence.
- Load-bearing: passes — The paper’s conclusions depend on it.
- Based: passes — The paper gives a reason why it holds.
It may state two separate claims as one.
A result the paper reports from its own data — it cites no other source for it, so there is none to check. The quote shows it is in the paper.
In the paper
“Although phylogenetically very close species tend to have similar codon pair usage, no major phylogenetic group-specific distribution was observed.”
§ Preferred and avoided codon pairs in three domains of life > Results > Phylogenetic distribution of the conserved codon context patterns
plain- Asserted: passes — The authors put it forward as true.
- Checkable: passes — It can be checked against evidence.
- Load-bearing: passes — The paper’s conclusions depend on it.
- Based: passes — The paper gives a reason why it holds.
It may state two separate claims as one.
A result the paper reports from its own data — it cites no other source for it, so there is none to check. The quote shows it is in the paper.
In the paper
“UUUUUU was clearly avoided in ORFeomes but was significantly preferred at the genome level (Table 2).”
§ Preferred and avoided codon pairs in three domains of life > Results > Under-represented codon pairs can be divided into 9 major types
boostedcorrelational- Asserted: passes — The authors put it forward as true.
- Checkable: passes — It can be checked against evidence.
- Load-bearing: unclear — It is unclear whether the paper’s conclusions depend on it.
- Based: passes — The paper gives a reason why it holds.
It may state two separate claims as one.
The paper states this without a source or data behind it here, so there is nothing to check it against. The quote shows it is in the paper.
In the paper
“The second most abundant type of conserved avoided codon pair was nnGnnC (type 2A), which was more strongly avoided in ORFeomes than in genomes.”
§ Preferred and avoided codon pairs in three domains of life > Results > Under-represented codon pairs can be divided into 9 major types
plaincorrelational- Asserted: passes — The authors put it forward as true.
- Checkable: passes — It can be checked against evidence.
- Load-bearing: unclear — It is unclear whether the paper’s conclusions depend on it.
- Based: passes — The paper gives a reason why it holds.
It may state two separate claims as one.
A result the paper reports from its own data — it cites no other source for it, so there is none to check. The quote shows it is in the paper.
In the paper
“However, for codons 1–3 we found only one codon pair with significant bias – GGUnnnGGU – which was over-represented in 61% of the organisms studied.”
§ Preferred and avoided codon pairs in three domains of life > Results > Definition of conserved biased codon pair
plain- Asserted: passes — The authors put it forward as true.
- Checkable: passes — It can be checked against evidence.
- Load-bearing: passes — The paper’s conclusions depend on it.
- Based: passes — The paper gives a reason why it holds.
It may state two separate claims as one.
A result the paper reports from its own data — it cites no other source for it, so there is none to check. The quote shows it is in the paper.
In the paper
“We observed only one conserved 1–3 interaction, over-representation of the pattern GGUnnnGGU”
§ Preferred and avoided codon pairs in three domains of life > Discussion
plain- Asserted: passes — The authors put it forward as true.
- Checkable: passes — It can be checked against evidence.
- Load-bearing: passes — The paper’s conclusions depend on it.
- Based: passes — The paper gives a reason why it holds.
It may state two separate claims as one.
A result the paper reports from its own data — it cites no other source for it, so there is none to check. The quote shows it is in the paper.
In the paper
“The repeated nucleotide was G (GGGGGG, GGGGGU, GGGGGC and GGGGCC), C (ACCCCG, ACCCCA and GCCCCG) or U (UUUUUU) [Additional file 4].”
§ Preferred and avoided codon pairs in three domains of life > Discussion
plain- Asserted: passes — The authors put it forward as true.
- Checkable: passes — It can be checked against evidence.
- Load-bearing: passes — The paper’s conclusions depend on it.
- Based: passes — The paper gives a reason why it holds.
It may state two separate claims as one.
In the paper
“Nevertheless, frameshifting errors are rare events in most sequences, occurring with a frequency less than once every 10,000 codons [14].”
§ Preferred and avoided codon pairs in three domains of life > Background
What the sources say
- Not checked — no full text of the sourcecites [14] Kurland CG: Translational accuracy and the fitness of bacteria. Annu Rev Genet. 1992, 26: 29-50. source
plain- Asserted: passes — The authors put it forward as true.
- Checkable: passes — It can be checked against evidence.
- Load-bearing: fails — The paper’s conclusions may not depend on it.
- Based: passes — The paper gives a reason why it holds.
Probably not a substantial claim. The paper’s conclusions may not depend on it.
In the paper
“Frameshift errors on 'hungry' codons in specific nucleotide contexts also increase under starvation conditions [11].”
§ Preferred and avoided codon pairs in three domains of life > Background
What the sources say
- Not checked — no full text of the sourcecites [11] Lindsley D, Gallant J: On the directional specificity of ribosome frameshifting at a "hungry" codon. Proc Natl Acad Sci USA. 1993, 90 (12): 5469-5473. 10.1073/pnas.90.12.5469. source
plaindirect- Asserted: passes — The authors put it forward as true.
- Checkable: passes — It can be checked against evidence.
- Load-bearing: fails — The paper’s conclusions may not depend on it.
- Based: passes — The paper gives a reason why it holds.
Probably not a substantial claim. The paper’s conclusions may not depend on it.
What the paper did — it cites no source for this, so there is none to check. The quote shows it is in the paper.
In the paper
“This reduced frequency of occurrence was taken into account when the ratio of observed to expected co-occurrences of trimers in genomes was determined.”
§ Preferred and avoided codon pairs in three domains of life > Results > Method for comparing ORFeomes and genomes
plain- Asserted: passes — The authors put it forward as true.
- Checkable: passes — It can be checked against evidence.
- Load-bearing: passes — The paper’s conclusions depend on it.
- Based: passes — The paper gives a reason why it holds.
Probably not a substantial claim.
In the paper
“As the ribosome does not contact the bases of the codon in the P-site [29]”
§ Preferred and avoided codon pairs in three domains of life > Discussion
What the sources say
- Not checked — no full text of the sourcecites [29] Korostelev A, Trakhanov S, Laurberg M, Noller HF: Crystal structure of a 70S ribosome-tRNA complex reveals functional interactions and rearrangements. Cell. 2006, 126 (6): 1065-1077. 10.1016/j.cell.2006.08.032. source
plain- Asserted: passes — The authors put it forward as true.
- Checkable: passes — It can be checked against evidence.
- Load-bearing: passes — The paper’s conclusions depend on it.
- Based: passes — The paper gives a reason why it holds.
Probably not a substantial claim.
What the paper did — it cites no source for this, so there is none to check. The quote shows it is in the paper.
In the paper
“Thus, we consider the comparison of effects in +1 and +2 reading frames biased and incorrect, so we compare the effects in the ORFeome and genome instead.”
§ Preferred and avoided codon pairs in three domains of life > Results > Method for comparing ORFeomes and genomes
plaindirect- Asserted: passes — The authors put it forward as true.
- Checkable: passes — It can be checked against evidence.
- Load-bearing: passes — The paper’s conclusions depend on it.
- Based: passes — The paper gives a reason why it holds.
It may state two separate claims as one.
What the paper did — it cites no source for this, so there is none to check. The quote shows it is in the paper.
In the paper
“Still, it has to be noted that the sample we used for eukaryotes is not representative since it is small and contains only one mammal.”
§ Preferred and avoided codon pairs in three domains of life > Results > Evolutionary conservation of codon context
plain- Asserted: passes — The authors put it forward as true.
- Checkable: passes — It can be checked against evidence.
- Load-bearing: unclear — It is unclear whether the paper’s conclusions depend on it.
- Based: passes — The paper gives a reason why it holds.
It may state two separate claims as one.
What the paper did — it cites no source for this, so there is none to check. The quote shows it is in the paper.
In the paper
“Z-scores make sub-patterns of different lengths more comparable to each other and can be used to identify the sub-pattern level on which the effect is strongest.”
§ Preferred and avoided codon pairs in three domains of life > Results > Under-represented codon pairs can be divided into 9 major types
plaindirect- Asserted: passes — The authors put it forward as true.
- Checkable: passes — It can be checked against evidence.
- Load-bearing: passes — The paper’s conclusions depend on it.
- Based: passes — The paper gives a reason why it holds.
It may state two separate claims as one.
A conclusion the paper draws from its own results — it cites no other source for it, so there is none to check. The quote shows it is in the paper.
In the paper
“Although most organisms have a similar set of universally conserved biased codon pairs, some organisms use slightly different sets (e.g. N. equitans) and some have a very small number of biased codon pairs (e.g. B. aphidicola, C. blochmannia).”
§ Preferred and avoided codon pairs in three domains of life > Results > Five genomes had atypical sets of biased codon pairs
plain- Asserted: passes — The authors put it forward as true.
- Checkable: passes — It can be checked against evidence.
- Load-bearing: passes — The paper’s conclusions depend on it.
- Based: passes — The paper gives a reason why it holds.
It may state two separate claims as one.
What the paper did — it cites no source for this, so there is none to check. The quote shows it is in the paper.
In the paper
“We used no multiple correction methods at this point.”
§ Preferred and avoided codon pairs in three domains of life > Methods > Calculation of observed and expected codon pair counts
plain- Asserted: passes — The authors put it forward as true.
- Checkable: passes — It can be checked against evidence.
- Load-bearing: passes — The paper’s conclusions depend on it.
- Based: passes — The paper gives a reason why it holds.
Probably not a substantial claim.
A conclusion the paper draws from its own results — it cites no other source for it, so there is none to check. The quote shows it is in the paper.
In the paper
“The reason for avoiding the codon pairs containing out-frame stops could be to minimize premature translational termination through recognition of those stops by a translation termination factor.”
§ Preferred and avoided codon pairs in three domains of life > Discussion
hedgedconditional- Asserted: passes — The authors put it forward as true.
- Checkable: passes — It can be checked against evidence.
- Load-bearing: passes — The paper’s conclusions depend on it.
- Based: passes — The paper gives a reason why it holds.
Probably not a substantial claim.
A conclusion the paper draws from its own results — it cites no other source for it, so there is none to check. The quote shows it is in the paper.
In the paper
“However, although TA dinucleotides could be avoided at the genome level, this would not exclude the possibility that avoidance of UA dinucleotides is also important for ORFs and effective translation.”
§ Preferred and avoided codon pairs in three domains of life > Discussion
hedgedconditional- Asserted: passes — The authors put it forward as true.
- Checkable: passes — It can be checked against evidence.
- Load-bearing: passes — The paper’s conclusions depend on it.
- Based: passes — The paper gives a reason why it holds.
It may state two separate claims as one.
A conclusion the paper draws from its own results — it cites no other source for it, so there is none to check. The quote shows it is in the paper.
In the paper
“This suggests that the selection for more effective and more accurate translation acts primarily through avoidance of the most disadvantageous codon pairs and not through over-representation of the most suitable contexts.”
§ Preferred and avoided codon pairs in three domains of life > Discussion
hedgeddirect- Asserted: passes — The authors put it forward as true.
- Checkable: passes — It can be checked against evidence.
- Load-bearing: passes — The paper’s conclusions depend on it.
- Based: passes — The paper gives a reason why it holds.
It may state two separate claims as one.
The paper relies on this without support.
It is not known how strong or conserved the codon context preferences in different organisms are.
“However, it is not known how strong or conserved the codon context preferences in different organisms are.”
The paper relies on this without support.
The structure and function of the ribosomal decoding centre are highly conserved in evolution.
“Since the structure and function of the ribosomal decoding centre are highly conserved in evolution, we could expect that avoidance of and preference for certain sequence contexts would also be conserved in the protein coding sequences of different organisms.”
The paper relies on this without support.
If the main selective force for codon pair usage were related to translational effects at the ribosome and not to biases in mechanisms operating at DNA level, the codon pair bias would be stronger in ORFeomes than in genomes.
“If the main selective force for codon pair usage were related to translational effects at the ribosome and not to biases in mechanisms operating at DNA level, the codon pair bias would be stronger in ORFeomes than in genomes.”
The paper relies on this without support.
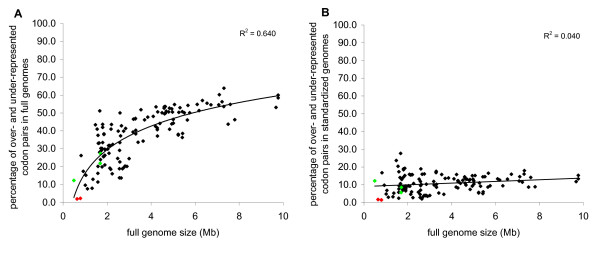
The low number of significantly biased codon pairs in small genomes is not caused by statistical limitations.
“This is not caused by statistical limitations on finding biased codon pairs in smaller genomes, but rather by the absence of codon-pair bias in those organisms.”
Self-check
Percentages, sums and reported differences re-computed from the paper’s own numbers.
Each contradiction between two passages listed here was confirmed by an independent check.
Rated minor: it would not touch a result — a value no result rests on, a p-value that stays on the same side of the significance level, or a conflict that is clerical, resolved elsewhere in the paper, or outside its own findings.
In the paper
§ Preferred and avoided codon pairs in three domains of life > Results > Under-represented codon pairs can be divided into 9 major types
“This led to a score for each codon pair and sub-pattern that described the divergence of the observed/expected ratio from the mean in units of standard deviation. This score is traditionally called the z-score.”
§ Preferred and avoided codon pairs in three domains of life > Methods > Calculation of observed and expected codon pair counts
“zi=log2(observed/expected)i,nσ[log2(observed/expected)n],”
Rated minor: it would not touch a result — a value no result rests on, a p-value that stays on the same side of the significance level, or a conflict that is clerical, resolved elsewhere in the paper, or outside its own findings.
In the paper
§ Preferred and avoided codon pairs in three domains of life > Discussion
“This was also confirmed by the shorter branch lengths in the codon pair usage tree than in the single codon usage tree (Figure 6).”
§ Preferred and avoided codon pairs in three domains of life > Results > Evolutionary conservation of codon context
“Comparing the RSCU and RDCU trees, we observed that the branch lengths were shorter in the RSCU tree (Figure 6A) than in the RDCU (codons 1–2) tree (Figure 6B), showing that codon usage gives stronger similarity between different organisms than codon pair usage.”
Rated minor: it would not touch a result — a value no result rests on, a p-value that stays on the same side of the significance level, or a conflict that is clerical, resolved elsewhere in the paper, or outside its own findings.
In the paper
§ Preferred and avoided codon pairs in three domains of life > Results > Over-represented codon pairs can be divided into 4 types
“| preferred pattern | preferred pattern | % among avoided pairs | the effect is stronger in ORFeome (%) | the effect is stronger in whole genome (%) |”
§ Preferred and avoided codon pairs in three domains of life > Results > Over-represented codon pairs can be divided into 4 types
“Note: The percentage of codon pairs of the corresponding pattern among all conserved preferred codon pairs is shown.”
Rated minor: it would not touch a result — a value no result rests on, a p-value that stays on the same side of the significance level, or a conflict that is clerical, resolved elsewhere in the paper, or outside its own findings.
In the paper
§ Preferred and avoided codon pairs in three domains of life > Results > Phylogenetic distribution of the conserved codon context patterns
“The avoided codon pairs are marked in yellow (obs/exp < 0). The preferred codon pairs are marked in blue (obs/exp > 0). Codon pairs without bias are black (obs/exp = 0).”
§ Preferred and avoided codon pairs in three domains of life > Methods > Calculation of observed and expected codon pair counts
“In each separate ORFeome, only under-represented codon pairs with observed/expected ratios ≤ 0.9 and over-represented codon pairs with observed/expected ratios ≥ 1.1 were subjected to the two-tailed Fisher's exact test.”
Citations
Cites
PHYLIP-Phylogeny inference package (Version 3.2)
Felsenstein, J. (1989) · Cladistics · Cited by 17,682
Sharp, P. M., & Li, W.-H. (1987) · Nucleic Acids Research · doi:10.1093/nar/15.3.1281 · Cited by 3,992 · cited 1×
“RSCU values are the number of times a particular codon is observed, relative to the number of times that the codon would be observed in the absence of any codon usage bias [37].”
BackgroundConstruction of Phylogenetic Trees
Fitch, W. M., & Margoliash, E. (1967) · Science · doi:10.1126/science.155.3760.279 · Cited by 3,611 · cited 1×
“Trees were calculated using the Fitch-Margoliash [38] algorithm from PHYLIP software [39] and were edited using TreeDyn software [40].”
MethodStructure of the 70S Ribosome Complexed with mRNA and tRNA
Selmer, M., Dunham, C., Murphy, F., Weixlbaumer, A., Petry, S., Kelley, A. C., Weir, J., & Ramakrishnan, V. (2006) · Science · doi:10.1126/science.1131127 · Cited by 1,352 · cited 1×
“Unfortunately, we currently have very limited information about the details of interaction between different tRNAs with the ribosome [29,34,35], which precludes further extension of this hypothesis.”
BackgroundThe ribosomal database project (RDP-II): introducing myRDP space and quality controlled public data
Cole, J. R., Chai, B., Farris, R. J., Wang, Q., Kulam-Syed-Mohideen, A. S., McGarrell, D. M., Bandela, A. M., Cardenas, E., Garrity, G. M., & Tiedje, J. M. (2006) · Nucleic Acids Research · doi:10.1093/nar/gkl889 · Cited by 1,171 · cited 3×
“Evolutionary distances between bacteria were retrieved as a 16SRNA distance matrix from the Ribosomal Database Project [28].”
MethodInfluentialTreeDyn: towards dynamic graphics and annotations for analyses of trees
Chevenet, F., Brun, C., Bañuls, A., Jacq, B., & Christen, R. (2006) · BMC Bioinformatics · doi:10.1186/1471-2105-7-439 · Cited by 1,094 · cited 1×
“Trees were calculated using the Fitch-Margoliash [38] algorithm from PHYLIP software [39] and were edited using TreeDyn software [40].”
MethodIkemura, T. (1981) · Journal of Molecular Biology · doi:10.1016/0022-2836(81)90363-6 · Cited by 875 · cited 1×
“Codon frequencies correlate with tRNA concentrations, suggesting that this is a major selective force on codon usage patterns [31-33].”
BackgroundCo-variation of tRNA Abundance and Codon Usage inEscherichia coliat Different Growth Rates
Dong, H., Nilsson, L., & Kurland, C. G. (1996) · Journal of Molecular Biology · doi:10.1006/jmbi.1996.0428 · Cited by 790 · cited 1×
“Codon frequencies correlate with tRNA concentrations, suggesting that this is a major selective force on codon usage patterns [31-33].”
BackgroundCrystal Structure of a 70S Ribosome-tRNA Complex Reveals Functional Interactions and Rearrangements
Korostelev, A., Trakhanov, S., Laurberg, M., & Noller, H. F. (2006) · Cell · doi:10.1016/j.cell.2006.08.032 · Cited by 498 · cited 6×
“Interestingly, among the different avoided sub-patterns causing the conserved avoidance of codon pairs, the last nucleotide of the P-site codon in a pair was always fixed (the only exception was the pattern UnnnnU for codon pair UUUUUU).”
BackgroundInfluentialAn Overview of EnsemblPreprint
Birney, E., Andrews, T. D., Bevan, A. P., Cáccamo, M., Chen, Y., Clarke, L., Coates, G. M. P., Cuff, J. A., Curwen, V., Cutts, T., et al. (2004) · Genome Research · doi:10.1101/gr.1860604 · Cited by 480 · cited 1×
“Human protein coding sequences were retrieved from Ensembl [36].”
Method
Cited by
Sorted by citations
Items 101–121 of 121
Ribosome Processivity and Co-translational Protein Folding
Thommen, M. (2017) · eDiss (Georg-August-Universität Göttingen) · doi:10.53846/goediss-6242
Simm, D. (2022) · eDiss (Georg-August-Universität Göttingen) · doi:10.53846/goediss-9118
Cotranslational folding of HemK C-terminal domain
Daberger, J. (2023) · eDiss (Georg-August-Universität Göttingen) · doi:10.53846/goediss-9786
Wang, X., Dong, Q., Chen, G., Zhang, J., Liu, Y., & Cai, Y. (2022) · Figshare · doi:10.6084/m9.figshare.19976801
Huang, Y., Lin, T. C., Lu, L., Cai, F., Lin, J., Jiang, Y., & Lin, Y. (2021) · Figshare · doi:10.6084/m9.figshare.16935578
Wang, X., Dong, Q., Chen, G., Zhang, J., Liu, Y., & Cai, Y. (2022) · Figshare · doi:10.6084/m9.figshare.19976804
Wang, X., Dong, Q., Chen, G., Zhang, J., Liu, Y., & Cai, Y. (2022) · Figshare · doi:10.6084/m9.figshare.19976789
Wang, X., Dong, Q., Chen, G., Zhang, J., Liu, Y., & Cai, Y. (2022) · Figshare · doi:10.6084/m9.figshare.19976795
Wang, X., Dong, Q., Chen, G., Zhang, J., Liu, Y., & Cai, Y. (2022) · Figshare · doi:10.6084/m9.figshare.19976780
Clement, N. J., Hamasaki‐Katagiri, N., Lin, B., Komar, A. A., DiCuccio, M. N., Bar, H., & Kimchi‐Sarfaty, C. (2025) · NAR Genomics and Bioinformatics · doi:10.1093/nargab/lqaf169
Fumagalli, S. E., Smith, S., Ghazanchyan, T., et al. (2024) · Figshare · doi:10.6084/m9.figshare.26962378
Fumagalli, S. E., Smith, S., Ghazanchyan, T., et al. (2024) · Figshare · doi:10.6084/m9.figshare.26962384
Fumagalli, S. E., Smith, S., Ghazanchyan, T., et al. (2024) · Figshare · doi:10.6084/m9.figshare.26962387
Fumagalli, S. E., Smith, S., Ghazanchyan, T., et al. (2024) · Figshare · doi:10.6084/m9.figshare.26962381
Huang, Y., Lin, T., Lu, L., Cai, F., Lin, J., Jiang, Y., & Lin, Y. (2021) · Figshare · doi:10.6084/m9.figshare.16935575
Attenuation of viscerotropic flaviviruses
Klitting, R. (2017) · theses.fr (ABES) · doi:10.70675/d3cc34d0z2cb7z4b75z831bz1574ac11f93c
Beyond codon optimality: codon pairs regulate mRNA stability dependent on translationPreprint
Lee, H., Musaev, D., Vejnar, C. E., Krishna, S., Nguyen, T. D., Strayer, E. C., Abdelmessih, M., Takacs, C. M., Beaudoin, J.-D., & Giráldez, A. J. (2026) · bioRxiv (Cold Spring Harbor Laboratory) · doi:10.64898/2026.09.15.751551
“Analyses from diverse genomes suggest that codon pair usage is subject to evolutionary constraints beyond single-codon preferences 19-21 .”
Metadata
- Authors
- Tats, A., Tenson, T., & Remm, M.
- Affiliations
- University of Tartu (EE)
- Estonian Biocentre (EE)
- Corresponding author
- Remm, Maido
- Venue
- BMC Genomics
- Published
- 2008-10-08
- Volume
- 9
- Issue
- 1
- Pages
- 463-463
- ISSN
- 1471-2164 (ISSN-L)
- PMC
- PMC2585594
- OpenAlex
- W2151373788
- Semantic Scholar
- 0fa0390d313e7d1a3b7898755535b627b8fd30f4
- Cited by
- 112
- References
- 40
- Citations by year
- 2026: 1 · 2025: 2 · 2024: 5 · 2023: 8 · 2022: 8 · 2021: 10 · 2020: 9 · 2019: 7 · 2018: 3 · 2017: 14 · 2016: 7 · 2015: 8 · 2014: 8 · 2013: 4 · 2012: 8
- FWCI
- 1.12
- Type
- journal article
- Language
- en
- Open access
- gold
- doi.org
- Licence
- cc-by
- Locations
- BMC Genomics (publishedVersion, cc-by)
- PubMed (publishedVersion)
- PubMed Central (submittedVersion, cc-by)
- DOAJ (DOAJ: Directory of Open Access Journals) (submittedVersion)
- Funders
- Wellcome Trust (070210)
- European Regional Development Fund
- Topics
- Life Sciences › Biochemistry, Genetics and Molecular Biology › Molecular Biology › RNA and protein synthesis mechanisms
- Life Sciences › Biochemistry, Genetics and Molecular Biology › Molecular Biology › Genomics and Phylogenetic Studies
- Life Sciences › Biochemistry, Genetics and Molecular Biology › Genetics › Evolution and Genetic Dynamics
- Keywords
- codon context, synonymous codons, translational selection, codon preference, three domains of life, bacteria, archaea, eukaryotes, stop codon, ORFeome, protein-coding sequences
- MeSH terms
- Animals, Archaea, Bacteria, Codon, Fungi, Genetic Code, Humans, Models, Genetic, Phylogeny, Selection, Genetic, Genome, Human, Open Reading Frames, Genome, Bacterial, Genome, Fungal, Evolution, Molecular, Genome, Archaeal
About these checks
Registry, retraction, Cites and statistics results are computed, not judged, with one exception: a printed reference that no index lists is read once by a model before it counts as a citation error. Claims are extracted by a model and kept only when their quote appears verbatim in the text; each cited source is then checked, with a model’s help, for whether it says what the claim relies on. Those verdicts can be wrong — read the claim’s quote and the cited source before relying on one.
A language model drew the claims from the paper on 2026-10-12, under version 3 of the claim definition (model deepseek-v4.1-flash, prompt extract-v3).
A second model labelled each claim on 2026-10-12 (model jev-1.13-20260917, definition revision gold-guideline-v0.2).
Cited sources are checked with a language model’s help (gpt-6-sol).
Statistics and arithmetic are recomputed, not judged.
Confidence bands are shown only for fields calibrated on our annotated test set. None is calibrated yet, so no band is shown.
What counts as a claim ›How we measure confidence ›How we check this ›
Are you an author, or do you see a problem with this page? Request a review
