

The DOI matches its Crossref record; 41 of the 41 references it cites were found in a registry or an index.
Error-dependent modulation of speech-induced auditory suppression for pitch-shifted voice feedback
Open accessAbstract
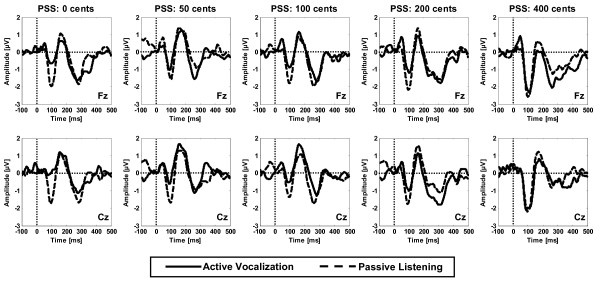
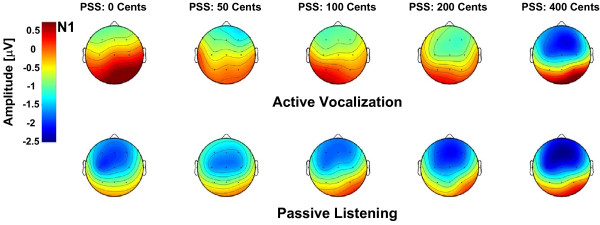
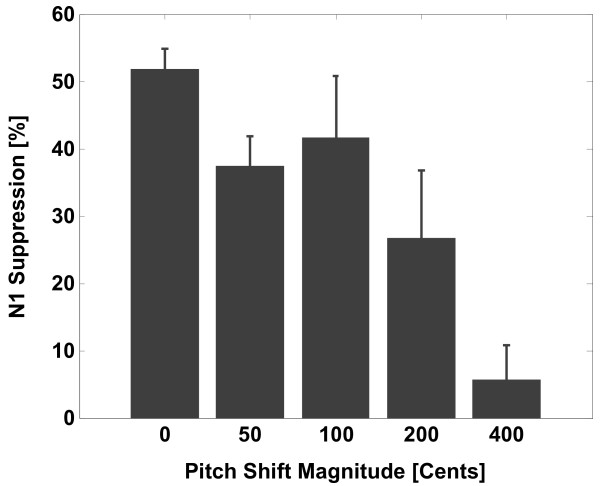
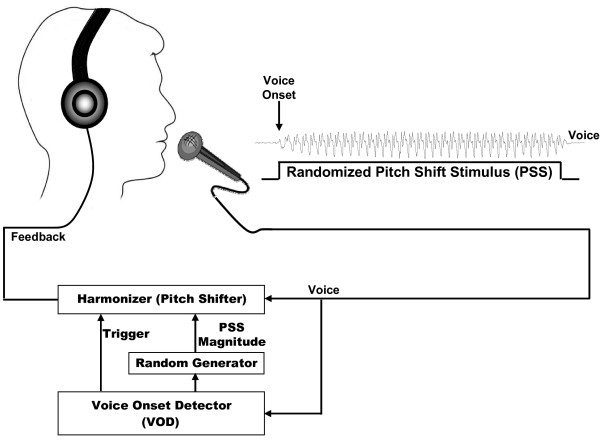
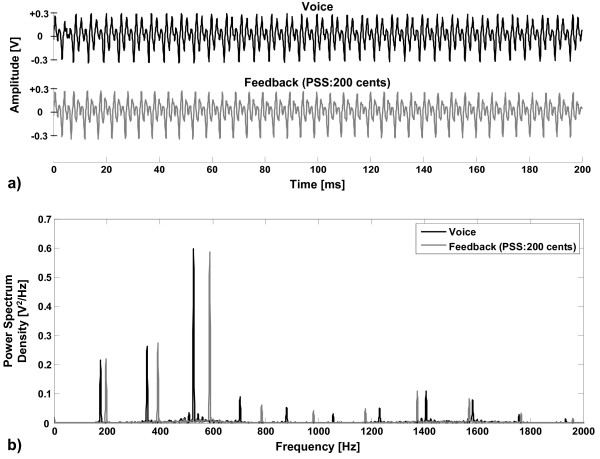
BACKGROUND: The motor-driven predictions about expected sensory feedback (efference copies) have been proposed to play an important role in recognition of sensory consequences of self-produced motor actions. In the auditory system, this effect was suggested to result in suppression of sensory neural responses to self-produced voices that are predicted by the efference copies during vocal production in comparison with passive listening to the playback of the identical self-vocalizations. In the present study, event-related potentials (ERPs) were recorded in response to upward pitch shift stimuli (PSS) with five different magnitudes (0, +50, +100, +200 and +400 cents) at voice onset during active vocal production and passive listening to the playback. RESULTS: Results indicated that the suppression of the N1 component during vocal production was largest for unaltered voice feedback (PSS: 0 cents), became smaller as the magnitude of PSS increased to 200 cents, and was almost completely eliminated in response to 400 cents stimuli. CONCLUSIONS: Findings of the present study suggest that the brain utilizes the motor predictions (efference copies) to determine the source of incoming stimuli and maximally suppresses the auditory responses to unaltered feedback of self-vocalizations. The reduction of suppression for 50, 100 and 200 cents and its elimination for 400 cents pitch-shifted voice auditory feedback support the idea that motor-driven suppression of voice feedback leads to distinctly different sensory neural processing of self vs. non-self vocalizations. This characteristic may enable the audio-vocal system to more effectively detect and correct for unexpected errors in the feedback of self-produced voice pitch compared with externally-generated sounds.
Overview
The claims and statistics of this paper haven’t been checked yet.
Run the check — free, no account needed. It reads the open-access text and checks the sources it cites.
Integrity signals
Registry
Cites
Statistics
Figures
Verification
Claims the paper makes
The claims and statistics of this paper haven’t been checked yet.
Run the check — free, no account needed. It reads the open-access text and checks the sources it cites.
Claims other papers make about this one
Each is checked against this paper’s own text: does it say what the citing paper says it does?
The cited source says what the claim attributes to it.
In the citing paper
“The results of the inner speech experiment mirror those of previous studies which have found sensory attenuation to overt speech to be reduced or eliminated if auditory feedback deviates from what would normally be expected; e.g., by pitch-shifting the feedback or providing foreign-language feedback (Heinks-Maldonado et al., 2006; Behroozmand and Larson, 2011; Behroozmand et al., 2011; Behroozmand”
From Neurophysiological evidence of efference copies to inner speech (2017) · cites this paper as Behroozmand and Larson, 2011
The cited source says what the claim attributes to it.
In the citing paper
“The results of the inner speech experiment mirror those of previous studies which have found sensory attenuation to overt speech to be reduced or eliminated if auditory feedback deviates from what would normally be expected; e.g., by pitch-shifting the feedback or providing foreign-language feedback (Heinks-Maldonado et al., 2006; Behroozmand and Larson, 2011; Behroozmand et al., 2011; Behroozmand”
From Neurophysiological evidence of efference copies to inner speech (2017) · cites this paper as Behroozmand et al., 2011
The cited source says what the claim attributes to it.
In the citing paper
“This result, which is consistent with numerous previous studies in the sensory attenuation literature (Heinks-Maldonado et al., 2006; Behroozmand and Larson, 2011; Behroozmand et al., 2011; Behroozmand et al., 2016; Larson and Robin, 2016), was identical to the corresponding contrast in the inner speech experiment, in which participants had to produce phonemes in inner, as opposed to overt, speech”
From Neurophysiological evidence of efference copies to inner speech (2017) · cites this paper as Behroozmand et al., 2011
The cited source says what the claim attributes to it.
In the citing paper
“This result, which is consistent with numerous previous studies in the sensory attenuation literature (Heinks-Maldonado et al., 2006; Behroozmand and Larson, 2011; Behroozmand et al., 2011; Behroozmand et al., 2016; Larson and Robin, 2016), was identical to the corresponding contrast in the inner speech experiment, in which participants had to produce phonemes in inner, as opposed to overt, speech”
From Neurophysiological evidence of efference copies to inner speech (2017) · cites this paper as Behroozmand and Larson, 2011
Self-check
Percentages, sums and reported differences re-computed from the paper’s own numbers.
The self-check needs the paper’s full text.
Citations
Cites
The cortical organization of speech processing
Hickok, G., & Poeppel, D. (2007) · Nature Reviews Neuroscience · doi:10.1038/nrn2113 · Cited by 5,495
An internal model for sensorimotor integration
Wolpert, D. M., Ghahramani, Z., & Jordan, M. I. (1995) · Science · doi:10.1126/science.7569931 · Cited by 3,553
Hickok, G., & Poeppel, D. (2004) · Cognition · doi:10.1016/j.cognition.2003.10.011 · Cited by 2,212
Neural basis of the spontaneous optokinetic response produced by visual inversion
Sperry, R. W. (1950) · Journal of Comparative and Physiological Psychology · doi:10.1037/h0055479 · Cited by 1,789
Central cancellation of self-produced tickle sensation
Blakemore, S.-J., Wolpert, D. M., & Frith, C. D. (1998) · Nature Neuroscience · doi:10.1038/2870 · Cited by 1,467
Relations between the central Nervous System and the peripheral organs
Holst, E. V. (1954) · The British Journal of Animal Behaviour · doi:10.1016/s0950-5601(54)80044-x · Cited by 1,104
Why canʼt you tickle yourself?
Blakemore, S.-J., Wolpert, D., & Frith, C. (2000) · NeuroReport · doi:10.1097/00001756-200008030-00002 · Cited by 904
Spatio-Temporal Prediction Modulates the Perception of Self-Produced Stimuli
Blakemore, S.-J., Frith, C. D., & Wolpert, D. M. (1999) · Journal of Cognitive Neuroscience · doi:10.1162/089892999563607 · Cited by 829
Neural mechanisms underlying auditory feedback control of speech
Tourville, J. A., Reilly, K. J., & Guenther, F. H. (2008) · NeuroImage · doi:10.1016/j.neuroimage.2007.09.054 · Cited by 649
Neuronal mechanisms of visual stability
Wurtz, R. H. (2008) · Vision Research · doi:10.1016/j.visres.2008.03.021 · Cited by 619
Cited by
Sorted by citations
The Encoding of Speech Sounds in the Superior Temporal Gyrus
Yi, H. G., Leonard, M. K., & Chang, E. F. (2019) · Neuron · doi:10.1016/j.neuron.2019.04.023 · Cited by 424
What does motor efference copy represent? Evidence from speech production
Niziolek, C. A., Nagarajan, S. S., & Houde, J. F. (2013) · The Journal of Neuroscience · doi:10.1523/jneurosci.2137-13.2013 · Cited by 222
Sensory-motor networks involved in speech production and motor control: an fMRI study
Behroozmand, R., Shebek, R., Hansen, D. R., Oya, H., Robin, D. A., Howard, M. A., & Greenlee, J. D. W. (2015) · NeuroImage · doi:10.1016/j.neuroimage.2015.01.040 · Cited by 194
Self-citationZheng, Z. Z., Munhall, K. G., & Johnsrude, I. S. (2010) · Journal of Cognitive Neuroscience · doi:10.1162/jocn.2009.21324 · Cited by 177
Tian, X., & Poeppel, D. (2013) · Journal of Cognitive Neuroscience · doi:10.1162/jocn_a_00381 · Cited by 172
How Movement Modulates Hearing
Schneider, D. M., & MOONEY, R. D. (2018) · Annual Review of Neuroscience · doi:10.1146/annurev-neuro-072116-031215 · Cited by 113
Understanding the neural mechanisms involved in sensory control of voice production
Parkinson, A. L., Flagmeier, S. G., Manes, J. L., Larson, C. R., Rogers, B., & Robin, D. A. (2012) · NeuroImage · doi:10.1016/j.neuroimage.2012.02.068 · Cited by 110
Self-citationNeurophysiological evidence of efference copies to inner speech
Whitford, T. J., Jack, B. N., Pearson, D., Griffiths, O., Luque, D., Harris, A. W., Spencer, K. M., & Le Pelley, M. E. (2017) · eLife · doi:10.7554/elife.28197 · Cited by 106
Functional Heterogeneity within the Default Network during Semantic Processing and Speech Production
Seghier, M. L., & Price, C. J. (2012) · Frontiers in Psychology · doi:10.3389/fpsyg.2012.00281 · Cited by 111
Prediction errors in self- and externally-generated deviants
Knolle, F., Schröger, E., & Kotz, S. A. (2012) · Biological Psychology · doi:10.1016/j.biopsycho.2012.11.017 · Cited by 102
Neural Correlates of Vocal Production and Motor Control in Human Heschl's Gyrus
Behroozmand, R., Oya, H., Nourski, K. V., Kawasaki, H., Larson, C. R., Brugge, J. F., Howard, M. A., & Greenlee, J. D. W. (2016) · Journal of Neuroscience · doi:10.1523/jneurosci.3305-14.2016 · Cited by 96
Self-citationAction planning and predictive coding when speaking
Wang, J., Mathalon, D. H., Roach, B. J., Reilly, J. L., Keedy, S., Sweeney, J. A., & Ford, J. M. (2014) · NeuroImage · doi:10.1016/j.neuroimage.2014.01.003 · Cited by 95
Control Changes the Way We Look at the World
Wen, W., & Haggard, P. (2018) · Journal of Cognitive Neuroscience · doi:10.1162/jocn_a_01226 · Cited by 81
Prediction, Psychosis, and the Cerebellum
Moberget, T., & Ivry, R. B. (2019) · Biological Psychiatry Cognitive Neuroscience and Neuroimaging · doi:10.1016/j.bpsc.2019.06.001 · Cited by 83
Huang, X., Chen, X., Yan, N., Jones, J. A., Wang, E. Q., Chen, L., Guo, Z., Li, W., Liu, P., & Liu, H. (2016) · Human Brain Mapping · doi:10.1002/hbm.23306 · Cited by 79
Sensory-Motor Interactions for Vocal Pitch Monitoring in Non-Primary Human Auditory Cortex
Greenlee, J. D. W., Behroozmand, R., Larson, C. R., Jackson, A. W., Chen, F., Hansen, D. R., Oya, H., Kawasaki, H., & Howard, M. A. (2013) · PLoS ONE · doi:10.1371/journal.pone.0060783 · Cited by 75
Self-citationA bilateral cortical network responds to pitch perturbations in speech feedback
Kort, N. S., Nagarajan, S. S., & Houde, J. F. (2013) · NeuroImage · doi:10.1016/j.neuroimage.2013.09.042 · Cited by 73
Processing Expectancy Violations during Music Performance and Perception: An ERP Study
Maidhof, C., Vavatzanidis, N., Prinz, W., Rieger, M., & Koelsch, S. (2009) · Journal of Cognitive Neuroscience · doi:10.1162/jocn.2009.21332 · Cited by 81
ERP correlates of the magnitude of pitch errors detected in the human voice
Scheerer, N. E., Behich, J., Liu, H., & Jones, J. A. (2013) · Neuroscience · doi:10.1016/j.neuroscience.2013.02.054 · Cited by 78
Brumberg, J. S., Krusienski, D. J., Chakrabarti, S., Gunduz, A., Brunner, P., Ritaccio, A. L., & Schalk, G. (2016) · PLoS ONE · doi:10.1371/journal.pone.0166872 · Cited by 78
Progress in speech decoding from the electrocorticogram
Chakrabarti, S., Sandberg, H. M., Brumberg, J. S., & Krusienski, D. J. (2015) · Biomedical Engineering Letters · doi:10.1007/s13534-015-0175-1 · Cited by 67
From blueprints to brain maps: the status of the Lemma Model in cognitive neuroscience
Kemmerer, D. L. (2018) · Language Cognition and Neuroscience · doi:10.1080/23273798.2018.1537498 · Cited by 60
Speaking-Induced Suppression of the Auditory Cortex in Humans and Its Relevance to Schizophrenia
Whitford, T. J. (2019) · Biological Psychiatry Cognitive Neuroscience and Neuroimaging · doi:10.1016/j.bpsc.2019.05.011 · Cited by 64
ERP correlates of language-specific processing of auditory pitch feedback during self-vocalization
Chen, Z., Liu, P., Wang, E. Q., Larson, C. R., Huang, D., & Liu, H. (2012) · Brain and Language · doi:10.1016/j.bandl.2012.02.004 · Cited by 55
Self-citationGuo, Z., Wu, X., Li, W., Jones, J. A., Yan, N., Sheft, S., Liu, P., & Liu, H. (2017) · Journal of Neuroscience · doi:10.1523/jneurosci.1329-17.2017 · Cited by 54
Behroozmand, R., Ibrahim, N., Korzyukov, O. A., Robin, D. A., & Larson, C. R. (2013) · Brain and Cognition · doi:10.1016/j.bandc.2013.11.007 · Cited by 58
Self-citationAuditory Cortex Processes Variation in Our Own Speech
Sitek, K. R., Mathalon, D. H., Roach, B. J., Houde, J. F., Niziolek, C. A., & Ford, J. M. (2013) · PLoS ONE · doi:10.1371/journal.pone.0082925 · Cited by 59
Inner speech is accompanied by a temporally-precise and content-specific corollary discharge
Jack, B. N., Le Pelley, M. E., Han, N., Harris, A. W. F., Spencer, K. M., & Whitford, T. J. (2019) · NeuroImage · doi:10.1016/j.neuroimage.2019.04.038 · Cited by 50
Role of N-Methyl D-aspartate receptors in action-based predictive coding deficits in schizophrenia
Kort, N. S., Ford, J. M., Roach, B. J., Gunduz-Bruce, H., Krystal, J. H., Jaeger, J., Reinhart, R. M. G., & Mathalon, D. H. (2017) · Biological Psychiatry · doi:10.1016/j.biopsych.2016.06.019 · Cited by 48
Sato, M. (2020) · Neuropsychologia · doi:10.1016/j.neuropsychologia.2020.107404 · Cited by 52
Pinheiro, A. P., Rezaii, N., Nestor, P. G., Rauber, A. S., Spencer, K., & Niznikiewicz, M. A. (2016) · Brain and Language · doi:10.1016/j.bandl.2015.12.003 · Cited by 43
Scheerer, N. E., Liu, H., & Jones, J. A. (2013) · European Journal of Neuroscience · doi:10.1111/ejn.12301 · Cited by 43
Jenson, D. E., Harkrider, A. W., Thornton, D. M., Bowers, A. L., & Saltuklaroglu, T. (2015) · Frontiers in Human Neuroscience · doi:10.3389/fnhum.2015.00534 · Cited by 46
Modulations of the auditory M100 in an imitation task
Franken, M. K., Peter Hagoort, A., & Acheson, D. J. (2015) · Brain and Language · doi:10.1016/j.bandl.2015.01.001 · Cited by 42
When temporal prediction errs: ERP responses to delayed action-feedback onset
Pinheiro, A. P., Schwartze, M., Gutiérrez-Domínguez, F.-J., & Kotz, S. A. (2019) · Neuropsychologia · doi:10.1016/j.neuropsychologia.2019.107200 · Cited by 43
Voice-selective prediction alterations in nonclinical voice hearers
Pinheiro, A. P., Schwartze, M., & Kotz, S. A. (2018) · Scientific Reports · doi:10.1038/s41598-018-32614-9 · Cited by 37
Chen, Z., Chen, X., Liu, P., Huang, D., & Liu, H. (2012) · BMC Neuroscience · doi:10.1186/1471-2202-13-55 · Cited by 42
Liu, Y., Hu, H., Jones, J. A., Guo, Z., Li, W., Chen, X., Liu, P., & Liu, H. (2015) · European Journal of Neuroscience · doi:10.1111/ejn.12949 · Cited by 41
Behroozmand, R., Ibrahim, N., Korzyukov, O. A., Robin, D. A., & Larson, C. R. (2015) · Frontiers in Neuroscience · doi:10.3389/fnins.2015.00109 · Cited by 40
Self-citationConde, T., Gonçalves, Ó. F., & Pinheiro, A. P. (2018) · International Journal of Psychophysiology · doi:10.1016/j.ijpsycho.2018.08.007 · Cited by 36
Bihemispheric network dynamics coordinating vocal feedback control
Kort, N. S., Cuesta, P., Houde, J. F., & Nagarajan, S. S. (2016) · Human Brain Mapping · doi:10.1002/hbm.23114 · Cited by 37
Contributions of sensory tuning to auditory-vocal interactions in marmoset auditory cortex
Eliades, S. J., & Wang, X. (2017) · Hearing Research · doi:10.1016/j.heares.2017.03.001 · Cited by 38
Mifsud, N. G., & Whitford, T. J. (2017) · Neuropsychologia · doi:10.1016/j.neuropsychologia.2017.07.019 · Cited by 41
The neural changes in connectivity of the voice network during voice pitch perturbation
Flagmeier, S. G., Ray, K. L., Parkinson, A. L., Li, K., Vargas, R., Price, L. R., Laird, A. R., Larson, C. R., & Robin, D. A. (2014) · Brain and Language · doi:10.1016/j.bandl.2014.02.001 · Cited by 35
Self-citationPatel, S. P., Kim, J. H., Larson, C. R., & Losh, M. (2019) · Autism Research · doi:10.1002/aur.2156 · Cited by 34
Self-citationBehroozmand, R., Sangtian, S., Korzyukov, O. A., & Larson, C. R. (2016) · Brain Research · doi:10.1016/j.brainres.2016.01.040 · Cited by 35
Self-citationRelationships between vocal pitch perception and production: a developmental perspective
Murray, E. S. H., & Stepp, C. E. (2020) · Scientific Reports · doi:10.1038/s41598-020-60756-2 · Cited by 33
Korzyukov, O. A., Sattler, L., Behroozmand, R., & Larson, C. R. (2012) · PLoS ONE · doi:10.1371/journal.pone.0041216 · Cited by 35
Self-citationModulation of Auditory Responses to Speech vs. Nonspeech Stimuli during Speech Movement Planning
Daliri, A., & Max, L. (2016) · Frontiers in Human Neuroscience · doi:10.3389/fnhum.2016.00234 · Cited by 36
Reality Monitoring and Feedback Control of Speech Production Are Related Through Self-Agency
Subramaniam, K., Kothare, H., Mizuiri, D., Nagarajan, S. S., & Houde, J. F. (2018) · Frontiers in Human Neuroscience · doi:10.3389/fnhum.2018.00082 · Cited by 30
Compensatory Responses to Formant Perturbations Proportionally Decrease as Perturbations Increase
Daliri, A., Chao, S.-C., & Fitzgerald, L. C. (2020) · Journal of Speech Language and Hearing Research · doi:10.1044/2020_jslhr-19-00422 · Cited by 32
Meekings, S., & Scott, S. K. (2020) · Journal of Cognitive Neuroscience · doi:10.1162/jocn_a_01661 · Cited by 36
Neural correlates of impaired vocal feedback control in post-stroke aphasia
Behroozmand, R., Bonilha, L., Rorden, C., Hickok, G. S., & Fridriksson, J. (2022) · NeuroImage · doi:10.1016/j.neuroimage.2022.118938 · Cited by 32
Self-citationA corollary discharge circuit in human speech
Khalilian-Gourtani, A., Wang, R., Chen, X., Yu, L., Dugan, P. C., Friedman, D., Doyle, W., Devinsky, O., Wang, Y., & Flinker, A. (2024) · Proceedings of the National Academy of Sciences · doi:10.1073/pnas.2404121121 · Cited by 31
Real and imagined sensory feedback have comparable effects on action anticipation
Pinheiro, A. P., Schwartze, M., Gutiérrez-Domínguez, F.-J., & Kotz, S. A. (2020) · Cortex · doi:10.1016/j.cortex.2020.04.030 · Cited by 32
Bioelectrical brain effects of one's own voice identification in pitch of voice auditory feedback
Korzyukov, O. A., Bronder, A., Lee, Y., Patel, S. A., & Larson, C. R. (2017) · Neuropsychologia · doi:10.1016/j.neuropsychologia.2017.04.035 · Cited by 31
Self-citationMandarin tone learning in L2 adults: A test of perceptual and sensorimotor contributions
Ning, L.-H., Shih, C., & Loucks, T. M. J. (2014) · Speech Communication · doi:10.1016/j.specom.2014.05.001 · Cited by 29
Impairment of speech auditory feedback error detection and motor correction in post-stroke aphasia
Sangtian, S., Wang, Y., Fridriksson, J., & Behroozmand, R. (2021) · Journal of Communication Disorders · doi:10.1016/j.jcomdis.2021.106163 · Cited by 29
Self-citationAuditory-Motor Perturbations of Voice Fundamental Frequency: Feedback Delay and Amplification
Weerathunge, H. R., Abur, D., Enos, N. M., Brown, K. M., & Stepp, C. E. (2020) · Journal of Speech Language and Hearing Research · doi:10.1044/2020_jslhr-19-00407 · Cited by 26
Zheng, Z. Z., Vicente-Grabovetsky, A., MacDonald, E., Munhall, K. G., Cusack, R., & Johnsrude, I. S. (2013) · Journal of Neuroscience · doi:10.1523/jneurosci.6319-11.2013 · Cited by 31
Li, W., Chen, Z., Liu, P., Zhang, B., Huang, D., & Liu, H. (2013) · Clinical Neurophysiology · doi:10.1016/j.clinph.2013.04.340 · Cited by 27
Franken, M. K., Eisner, F., Acheson, D. J., McQueen, J. M., Peter Hagoort, A., & Schoffelen, J. (2018) · NeuroImage · doi:10.1016/j.neuroimage.2018.06.061 · Cited by 27
Changes in motor preparation affect the sensory consequences of voice production in voice hearers
Pinheiro, A. P., Schwartze, M., Amorim, M., Coentre, R. M., Levy, P., & Kotz, S. A. (2020) · Neuropsychologia · doi:10.1016/j.neuropsychologia.2020.107531 · Cited by 27
Deficits in monitoring self-produced speech in Parkinson’s disease
Railo, H., Nokelainen, N., Savolainen, S., & Kaasinen, V. (2020) · Clinical Neurophysiology · doi:10.1016/j.clinph.2020.05.038 · Cited by 28
Wang, H., Yu, K., Yang, T., Zeng, L., Li, J., Dai, C., Peng, Z., Shao, Y., Fu, W., & Qi, J. (2021) · Frontiers in Neuroscience · doi:10.3389/fnins.2021.665687 · Cited by 24
Voice-related modulation of mechanosensory detection thresholds in the human larynx
Hammer, M. J., & Krueger, M. A. (2013) · Experimental Brain Research · doi:10.1007/s00221-013-3703-1 · Cited by 24
Chen, Z., Wong, F. C. K., Jones, J. A., Li, W., Liu, P., Chen, X., & Liu, H. (2015) · Scientific Reports · doi:10.1038/srep13134 · Cited by 25
Corollary Discharge Mechanisms During Vocal Production in Marmoset Monkeys
Eliades, S. J., & Wang, X. (2019) · Biological Psychiatry Cognitive Neuroscience and Neuroimaging · doi:10.1016/j.bpsc.2019.06.008 · Cited by 23
Auditory Feedback Is Used for Adaptation and Compensation in Speech Timing
Karlin, R. P., Naber, C., & Parrell, B. (2021) · Journal of Speech Language and Hearing Research · doi:10.1044/2021_jslhr-21-00021 · Cited by 21
Modulation of effective connectivity during vocalization with perturbed auditory feedback
Parkinson, A. L., Korzyukov, O. A., Larson, C. R., Vladimir Litvak, A., & Robin, D. A. (2013) · Neuropsychologia · doi:10.1016/j.neuropsychologia.2013.05.002 · Cited by 20
Self-citationAging and Sex Influence Cortical Auditory-Motor Integration for Speech Control
Li, J., Hu, H., Chen, N., Jones, J. A., Wu, D., Liu, P., & Liu, H. (2018) · Frontiers in Neuroscience · doi:10.3389/fnins.2018.00749 · Cited by 19
Effective connectivity associated with auditory error detection in musicians with absolute pitch
Parkinson, A. L., Behroozmand, R., Ibrahim, N., Korzyukov, O. A., Larson, C. R., & Robin, D. A. (2014) · Frontiers in Neuroscience · doi:10.3389/fnins.2014.00046 · Cited by 20
Self-citationAuditory N1 reveals planning and monitoring processes during music performance
Mathias, B., Gehring, W. J., & Palmėr, C. (2016) · Psychophysiology · doi:10.1111/psyp.12781 · Cited by 22
Auditory prediction during speaking and listening
Sato, M., & Shiller, D. M. (2018) · Brain and Language · doi:10.1016/j.bandl.2018.01.008 · Cited by 23
Distinct role of central predictive mechanisms in tactile suppression
Arikan, B. E., Voudouris, D., Straube, B., & Fiehler, K. (2024) · iScience · doi:10.1016/j.isci.2024.110582 · Cited by 19
Predictive error detection in pianists: a combined ERP and motion capture study
Maidhof, C. (2013) · Frontiers in Human Neuroscience · doi:10.3389/fnhum.2013.00587 · Cited by 19
Johari, K., & Behroozmand, R. (2017) · Experimental Brain Research · doi:10.1007/s00221-017-4900-0 · Cited by 15
Self-citationDevelopmental sex-specific change in auditory–vocal integration: ERP evidence in children
Liu, P., Chen, Z., Jones, J. A., Wang, E. Q., Chen, S., Huang, D., & Liu, H. (2012) · Clinical Neurophysiology · doi:10.1016/j.clinph.2012.08.024 · Cited by 17
Conde, T., Gonçalves, Ó. F., & Pinheiro, A. P. (2015) · Cognitive Affective & Behavioral Neuroscience · doi:10.3758/s13415-015-0376-1 · Cited by 20
On the interplay between speech perception and production: insights from research and theories
Arjmandi, M. K., & Behroozmand, R. (2024) · Frontiers in Neuroscience · doi:10.3389/fnins.2024.1347614 · Cited by 20
Self-citationSpatiotemporal Mapping of Auditory Onsets during Speech Production
Kurteff, G., Field, A. M., Asghar, S., Tyler‐Kabara, E. C., Clarke, D., Weiner, H. L., Anderson, A. E., Watrous, A. J., Buchanan, R. J., Modur, P. N., et al. (2024) · Journal of Neuroscience · doi:10.1523/jneurosci.1109-24.2024 · Cited by 13
Neurophysiological Evidence of Sensory Prediction Errors Driving Speech Sensorimotor Adaptation
Kim, K. S., Hinkley, L. B. N., Brent, K., Gaines, J. L., Pongos, A. L. A., Gupta, S., Dale, C. L., Nagarajan, S. S., & Houde, J. F. (2025) · Journal of Neuroscience · doi:10.1523/jneurosci.2084-24.2025 · Cited by 15
Liu, D., Chang, Y., Dai, G., Guo, Z., Jones, J. A., Li, T., Chen, X., Chen, M., Li, J., Wu, X., et al. (2023) · NeuroImage · doi:10.1016/j.neuroimage.2023.120282 · Cited by 15
Dynamics of Vocalization-Induced Modulation of Auditory Cortical Activity at Mid-utterance
Chen, Z., Jones, J. A., Liu, P., Li, W., Huang, D., & Liu, H. (2013) · PLoS ONE · doi:10.1371/journal.pone.0060039 · Cited by 14
Vocalization modulates the mouse auditory cortex even in the absence of hearing
Harmon, T. C., Madlon‐Kay, S., Pearson, J., & MOONEY, R. D. (2024) · Cell Reports · doi:10.1016/j.celrep.2024.114611 · Cited by 12
Behroozmand, R., Korzyukov, O. A., & Larson, C. R. (2012) · Brain Research · doi:10.1016/j.brainres.2012.02.012 · Cited by 14
Self-citationAgency and Ownership are Independent Components of ‘Sensing the Self’ in the Auditory-Verbal Domain
Hubl, D., Schneider, R. C., Kottlow, M., Kindler, J., Strik, W. K., Dierks, T., & Koenig, T. W. (2014) · Brain Topography · doi:10.1007/s10548-014-0351-0 · Cited by 13
Kryshtopava, M., Lierde, K. M. V., Meerschman, I., D’haeseleer, E., Moor, M. D., Vandemaele, P., Vingerhoets, G., & Claeys, S. (2016) · Journal of Voice · doi:10.1016/j.jvoice.2016.02.022 · Cited by 13
Johari, K., & Behroozmand, R. (2018) · Behavioural Brain Research · doi:10.1016/j.bbr.2018.03.028 · Cited by 12
Self-citationSarmukadam, K., & Behroozmand, R. (2023) · Cortex · doi:10.1016/j.cortex.2023.05.015 · Cited by 11
Self-citationPredicting and imagining language
Gambi, C., & Pickering, M. J. (2015) · Language Cognition and Neuroscience · doi:10.1080/23273798.2015.1049188 · Cited by 10
Speaker-induced Suppression in EEG during a Naturalistic Reading and Listening Task
Kurteff, G., Lester‐Smith, R. A., CCC-SLP, Martinez, A., Currens, N., Holder, J., Villarreal, C., Mercado, V. R., Truong, C., Huber, C., et al. (2023) · Journal of Cognitive Neuroscience · doi:10.1162/jocn_a_02037 · Cited by 9
Seghier, M. L., Hope, T. M. H., Prejawa, S., Jones, Ō. P., Vitkovitch, M., & Price, C. J. (2015) · Journal of Neuroscience · doi:10.1523/jneurosci.2292-14.2015 · Cited by 9
The Association Between Genetic Variation in FOXP2 and Sensorimotor Control of Speech Production
Zhang, S., Zhao, J.-L., Guo, Z., Jones, J. A., Liu, P., & Liu, H. (2018) · Frontiers in Neuroscience · doi:10.3389/fnins.2018.00666 · Cited by 10
Hilger, A., Cole, J., Kim, J. H., Lester‐Smith, R. A., & Larson, C. R. (2020) · Journal of Speech Language and Hearing Research · doi:10.1044/2020_jslhr-19-00043 · Cited by 9
Self-citationProcessing of self-initiated speech-sounds is different in musicians
Ott, C. G. M., & Jäncke, L. (2013) · Frontiers in Human Neuroscience · doi:10.3389/fnhum.2013.00041 · Cited by 9
Patel, S. A., Lodhavia, A., Frankford, S. A., Korzyukov, O. A., & Larson, C. R. (2015) · Journal of Voice · doi:10.1016/j.jvoice.2015.11.012 · Cited by 9
Self-citationAshjaei, S., Behroozmand, R., Fozdar, S., Farrar, R., & Arjmandi, M. K. (2024) · Hearing Research · doi:10.1016/j.heares.2024.109132 · Cited by 8
Self-citationZhang, W., Yang, F., & Tian, X. (2023) · Brain and Language · doi:10.1016/j.bandl.2023.105266 · Cited by 8
DIVA Meets EEG: Model Validation Using Formant-Shift Reflex
Cuadros, J., Rivera, L. Z., Castro, C., Whitaker, G., Otero, M., Weinstein, A., Martínez-Montes, E., Prado, P., & Zañartu, M. (2023) · Applied Sciences · doi:10.3390/app13137512 · Cited by 8
Metadata
- Authors
- Behroozmand, R., & Larson, C. R.
- Affiliations
- Northwestern University (US)
- Corresponding author
- Behroozmand, Roozbeh
- Venue
- BMC Neuroscience
- Published
- 2011-06-06
- Volume
- 12
- Issue
- 1
- Pages
- 54-54
- ISSN
- 1471-2202 (ISSN-L)
- PMC
- PMC3120724
- OpenAlex
- W2085269432
- Cited by
- 158
- References
- 41
- Citations by year
- 2026: 8 · 2025: 16 · 2024: 13 · 2023: 11 · 2022: 10 · 2021: 6 · 2020: 11 · 2019: 9 · 2018: 14 · 2017: 6 · 2016: 10 · 2015: 11 · 2014: 6 · 2013: 15 · 2012: 10
- FWCI
- 5.04
- Type
- journal article
- Language
- en
- Open access
- gold
- doi.org
- Licence
- Locations
- BMC Neuroscience (publishedVersion, cc-by)
- PubMed Central (publishedVersion, cc-by)
- PubMed (publishedVersion)
- DOAJ (DOAJ: Directory of Open Access Journals) (submittedVersion, cc-by-sa)
- Funders
- National Institutes of Health
- National Institute on Deafness and Other Communication Disorders (R01DC006243)
- Topics
- Life Sciences › Neuroscience › Cognitive Neuroscience › Neuroscience and Music Perception
- Life Sciences › Neuroscience › Cognitive Neuroscience › Neurobiology of Language and Bilingualism
- Social Sciences › Psychology › Experimental and Cognitive Psychology › Phonetics and Phonology Research
- Keywords
- efference copy, phonation, N1 component, event-related potentials
- MeSH terms
- Acoustic Stimulation, Adult, Brain Mapping, Electroencephalography, Evoked Potentials, Female, Humans, Male, Pitch Perception, Speech, Speech Acoustics, Feedback, Physiological
About these checks
Registry, retraction, Cites and statistics results are computed, not judged, with one exception: a printed reference that no index lists is read once by a model before it counts as a citation error. Claims are extracted by a model and kept only when their quote appears verbatim in the text; each cited source is then checked, with a model’s help, for whether it says what the claim relies on. Those verdicts can be wrong — read the claim’s quote and the cited source before relying on one.
Statistics and arithmetic are recomputed, not judged.
Confidence bands are shown only for fields calibrated on our annotated test set. None is calibrated yet, so no band is shown.
What counts as a claim ›How we measure confidence ›How we check this ›
Are you an author, or do you see a problem with this page? Request a review
