

The DOI matches its Crossref record; 42 of the 42 references it cites were found in a registry or an index.
RNA expression patterns in serum microvesicles from patients with glioblastoma multiforme and controls
Open accessAbstract
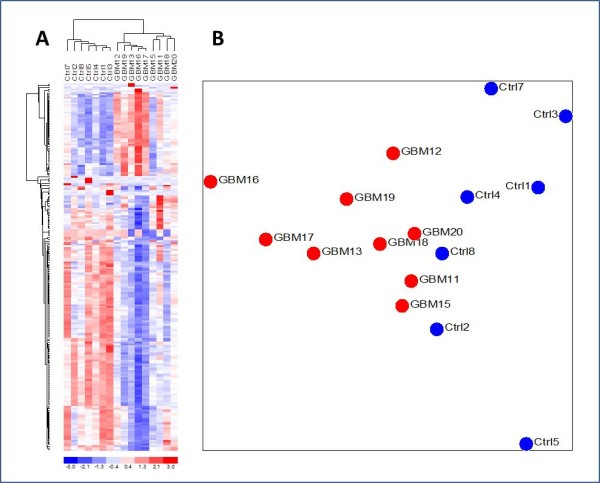
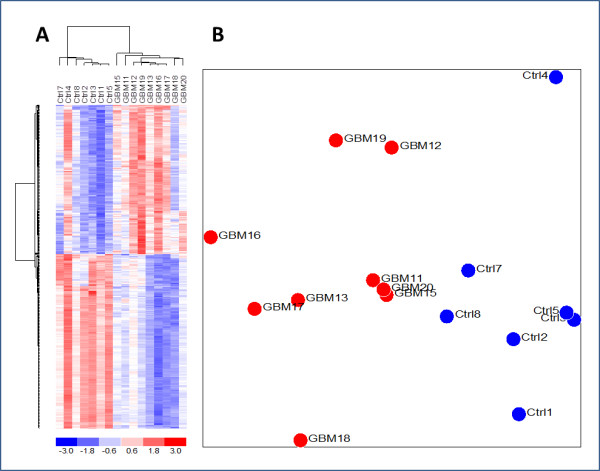
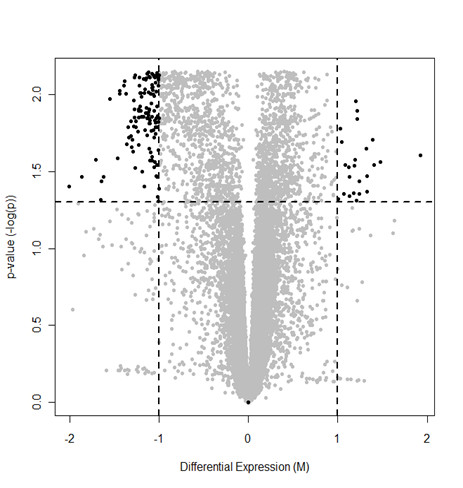
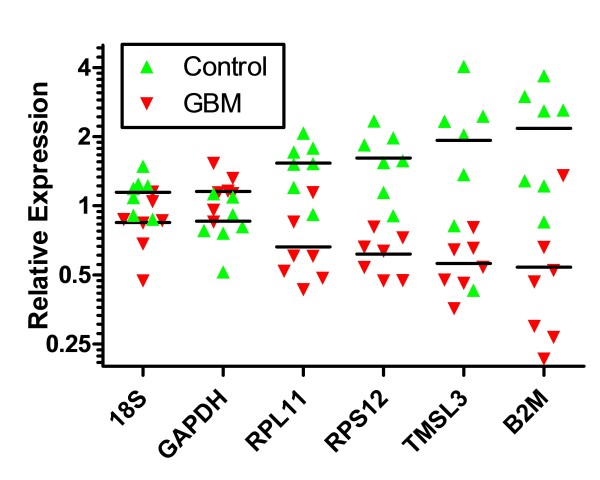
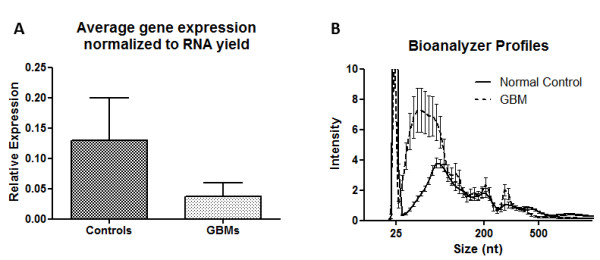
BACKGROUND: RNA from exosomes and other microvesicles contain transcripts of tumour origin. In this study we sought to identify biomarkers of glioblastoma multiforme in microvesicle RNA from serum of affected patients. METHODS: Microvesicle RNA from serum from patients with de-novo primary glioblastoma multiforme (N = 9) and normal controls (N = 7) were analyzed by microarray analysis. Samples were collected according to protocols approved by the Institutional Review Board. Differential expressions were validated by qRT-PCR in a separate set of samples (N = 10 in both groups). RESULTS: Expression profiles of microvesicle RNA correctly separated individuals in two groups by unsupervised clustering. The most significant differences pertained to down-regulated genes (121 genes > 2-fold down) in the glioblastoma multiforme patient microvesicle RNA, validated by qRT-PCR on several genes. Overall, yields of microvesicle RNA from patients was higher than from normal controls, but the additional RNA was primarily of size < 500 nt. Gene ontology of the down-regulated genes indicated these are coding for ribosomal proteins and genes related to ribosome production. CONCLUSIONS: Serum microvesicle RNA from patients with glioblastoma multiforme has significantly down-regulated levels of RNAs coding for ribosome production, compared to normal healthy controls, but a large overabundance of RNA of unknown origin with size < 500 nt.
Overview
The claims and statistics of this paper haven’t been checked yet.
Run the check — free, no account needed. It reads the open-access text and checks the sources it cites.
Integrity signals
Registry
Cites
Statistics
Figures
Verification
Claims the paper makes
The claims and statistics of this paper haven’t been checked yet.
Run the check — free, no account needed. It reads the open-access text and checks the sources it cites.
Claims other papers make about this one
Each is checked against this paper’s own text: does it say what the citing paper says it does?
The source backs part of the claim, not all of it — or backs it for a different population, condition or comparison.
In the citing paper
“Relative to this population, EVs derived from tumors remain a small minority of total EVs isolated in a given biofluid sample [118]. Thus, the sensitivity of detection remains a major challenge in tumor-specific biomarker development.”
From Biogenesis of extracellular vesicles (EV): exosomes, microvesicles, retrovirus-like vesicles, and apoptotic bodies (2013) · cites this paper as [118]
Experimental — accuracy not yet measuredThe cited source says what the claim attributes to it.
In the citing paper
“For example, mRNA profiling of serum derived EV contents can discriminate between healthy and glioblastoma bearing patients [118]. IDH-1 (isocitrate dehydrogenase 1) transcripts have been detected from EVs isolated from the blood of glioblastoma bearing patients using immunoisolations of EVs targeting CD63 [119].”
From Biogenesis of extracellular vesicles (EV): exosomes, microvesicles, retrovirus-like vesicles, and apoptotic bodies (2013) · cites this paper as [118]
Self-check
Percentages, sums and reported differences re-computed from the paper’s own numbers.
The self-check needs the paper’s full text.
Citations
Cites
1 retracted
RETRACTED: MicroRNA signatures of tumor-derived exosomes as diagnostic biomarkers of ovarian cancer
Taylor, D. D., & Gerçel-Taylor, Ç. (2008) · Gynecologic Oncology · doi:10.1016/j.ygyno.2008.04.033 · Cited by 2,333
RetractedControlling the False Discovery Rate: A Practical and Powerful Approach to Multiple Testing
Benjamini, Y., & Hochberg, Y. (1995) · Journal of the Royal Statistical Society Series B: Statistical Methodology · doi:10.1111/j.2517-6161.1995.tb02031.x · Cited by 109,482
Systematic and integrative analysis of large gene lists using DAVID bioinformatics resources
Huang, D. W., Sherman, B. T., & Lempicki, R. A. (2009) · Nature Protocols · doi:10.1038/nprot.2008.211 · Cited by 35,890
Comprehensive genomic characterization defines human glioblastoma genes and core pathways
The Cancer Genome Atlas Research Network (2008) · Nature · doi:10.1038/nature07385 · Cited by 7,735
Long non-coding RNAs: insights into functions
Mercer, T. R., Dinger, M. E., & Mattick, J. S. (2009) · Nature Reviews Genetics · doi:10.1038/nrg2521 · Cited by 5,654
Skog, J., Würdinger, T., van Rijn, S., Meijer, D. H., Gainche, L., Curry, W. T., Carter, B. S., Krichevsky, A. M., & Breakefield, X. O. (2008) · Nature Cell Biology · doi:10.1038/ncb1800 · Cited by 5,001
Self-citationMembrane vesicles as conveyors of immune responses
Théry, C., Ostrowski, M., & Segura, É. (2009) · Nature reviews. Immunology · doi:10.1038/nri2567 · Cited by 3,996
Arroyo, J. D., Chevillet, J. R., Kroh, E. M., Ruf, I. K., Pritchard, C. C., Gibson, D. F., Mitchell, P. S., Bennett, C. F., Pogosova-Agadjanyan, E. L., Stirewalt, D. L., et al. (2011) · Proceedings of the National Academy of Sciences · doi:10.1073/pnas.1019055108 · Cited by 3,294
Characterization of extracellular circulating microRNA
Turchinovich, A., Weiz, L., Langheinz, A., & Burwinkel, B. (2011) · Nucleic Acids Research · doi:10.1093/nar/gkr254 · Cited by 1,941
Shedding microvesicles: artefacts no more
Cocucci, E., Racchetti, G., & Meldolesi, J. (2009) · Trends in Cell Biology · doi:10.1016/j.tcb.2008.11.003 · Cited by 1,742
Research works printed but not linked: 1
- Stedman's Medical Dictionary. 2000, Lippincott Williams & Wilkins, 27
Cited by
Sorted by citations
Witwer, K. W., Buzás, E. I., Bemis, L., Bora, A., Lässer, C., Lötvall, J. O., Hoen, E. N. M. N., Piper, M. G., Sivaraman, S., Skog, J., et al. (2013) · Journal of Extracellular Vesicles · doi:10.3402/jev.v2i0.20360 · Cited by 2,513
Self-citationAkers, J. C., Gonda, D., Kim, R., Carter, B. S., & Chen, C. C. (2013) · Journal of Neuro-Oncology · doi:10.1007/s11060-013-1084-8 · Cited by 1,423
“Relative to this population, EVs derived from tumors remain a small minority of total EVs isolated in a given biofluid sample [118].”
Self-citationExosomes: Therapy delivery tools and biomarkers of diseases
Barile, L., & Vassalli, G. (2017) · Pharmacology & Therapeutics · doi:10.1016/j.pharmthera.2017.02.020 · Cited by 1,053
Exosomes and microvesicles: extracellular vesicles for genetic information transfer and gene therapy
Lee, Y., Andaloussi, S. E., & Wood, M. J. A. (2012) · Human Molecular Genetics · doi:10.1093/hmg/dds317 · Cited by 958
Exosomes: Vehicles of Intercellular Signaling, Biomarkers, and Vectors of Cell Therapy
Kourembanas, S. (2015) · Annual Review of Physiology · doi:10.1146/annurev-physiol-021014-071641 · Cited by 761
Metadata
- Authors
- Noerholm, M., Balaj, L., Limperg, T., Salehi, A., Zhu, L. D., Hochberg, F. H., Breakefield, X. O., Carter, B. S., & Skog, J.
- Affiliations
- Harvard University (US)
- Corresponding author
- Noerholm, Mikkel
- ORCID
- Venue
- BMC Cancer
- Published
- 2012-01-17
- Volume
- 12
- Issue
- 1
- Pages
- 22-22
- ISSN
- 1471-2407 (ISSN-L)
- PMC
- PMC3329625
- OpenAlex
- W2118369903
- Cited by
- 190
- References
- 42
- Citations by year
- 2026: 2 · 2025: 5 · 2024: 5 · 2023: 6 · 2022: 7 · 2021: 13 · 2020: 10 · 2019: 16 · 2018: 18 · 2017: 12 · 2016: 17 · 2015: 20 · 2014: 28 · 2013: 25 · 2012: 6
- FWCI
- 10.16
- Type
- journal article
- Language
- en
- Open access
- gold
- doi.org
- Licence
- Locations
- BMC Cancer (publishedVersion, cc-by)
- PubMed Central (publishedVersion, cc-by)
- PubMed (publishedVersion)
- Digital Access to Scholarship at Harvard (DASH) (Harvard University) (submittedVersion, cc-by)
- DOAJ (DOAJ: Directory of Open Access Journals) (submittedVersion, cc-by-sa)
- eScholarship (California Digital Library) (submittedVersion)
- Funders
- National Cancer Institute (R21CA156009, P01CA069246, CA069246, CA156009, R21CA141226, CA141226)
- National Institute of Neurological Disorders and Stroke (P30NS045776)
- National Center for Research Resources (UL1RR025758)
- Topics
- Life Sciences › Biochemistry, Genetics and Molecular Biology › Molecular Biology › Extracellular vesicles in disease
- Life Sciences › Biochemistry, Genetics and Molecular Biology › Cancer Research › MicroRNA in disease regulation
- Health Sciences › Medicine › Oncology › Glioma Diagnosis and Treatment
- Keywords
- glioblastoma, exosomes, tumour biomarkers, ribosomal proteins, ribosome biogenesis, gene expression profiling, differential gene expression, liquid biopsy
- MeSH terms
- Brain Neoplasms, Glioblastoma, Humans, RNA, Neoplasm, Subcellular Fractions, Biomarkers, Tumor, Reverse Transcriptase Polymerase Chain Reaction, Gene Expression Profiling, Microarray Analysis
About these checks
Registry, retraction, Cites and statistics results are computed, not judged, with one exception: a printed reference that no index lists is read once by a model before it counts as a citation error. Claims are extracted by a model and kept only when their quote appears verbatim in the text; each cited source is then checked, with a model’s help, for whether it says what the claim relies on. Those verdicts can be wrong — read the claim’s quote and the cited source before relying on one.
Statistics and arithmetic are recomputed, not judged.
Confidence bands are shown only for fields calibrated on our annotated test set. None is calibrated yet, so no band is shown.
What counts as a claim ›How we measure confidence ›How we check this ›
Are you an author, or do you see a problem with this page? Request a review
