

The DOI matches its Crossref record; 72 of the 72 references it cites were found in a registry or an index.
A malaria transmission-directed model of mosquito life cycle and ecology
Open accessAbstract
BACKGROUND: Malaria is a major public health issue in much of the world, and the mosquito vectors which drive transmission are key targets for interventions. Mathematical models for planning malaria eradication benefit from detailed representations of local mosquito populations, their natural dynamics and their response to campaign pressures. METHODS: A new model is presented for mosquito population dynamics, effects of weather, and impacts of multiple simultaneous interventions. This model is then embedded in a large-scale individual-based simulation and results for local elimination of malaria are discussed. Mosquito population behaviours, such as anthropophily and indoor feeding, are included to study their effect upon the efficacy of vector control-based elimination campaigns. RESULTS: Results for vector control tools, such as bed nets, indoor spraying, larval control and space spraying, both alone and in combination, are displayed for a single-location simulation with vector species and seasonality characteristic of central Tanzania, varying baseline transmission intensity and vector bionomics. The sensitivities to habitat type, anthropophily, indoor feeding, and baseline transmission intensity are explored. CONCLUSIONS: The ability to model a spectrum of local vector species with different ecologies and behaviours allows local customization of packages of interventions and exploration of the effect of proposed new tools.
Overview
The claims and statistics of this paper haven’t been checked yet.
Run the check — free, no account needed. It reads the open-access text and checks the sources it cites.
Integrity signals
Registry
Cites
Statistics
Figures
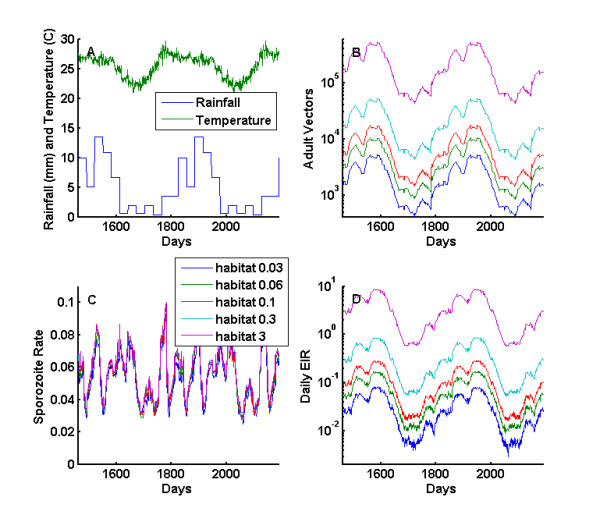
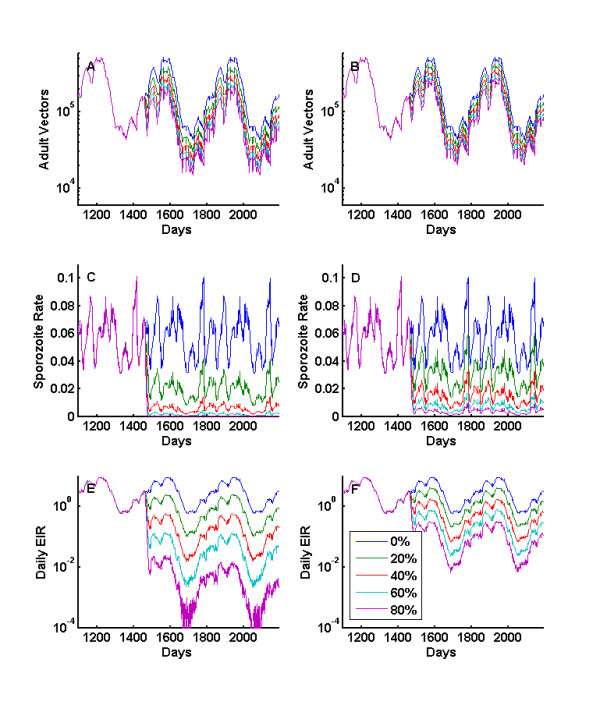
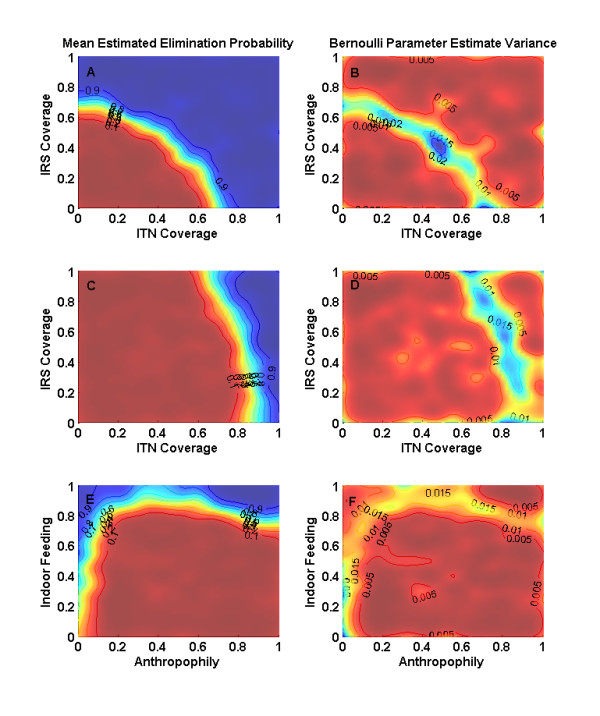
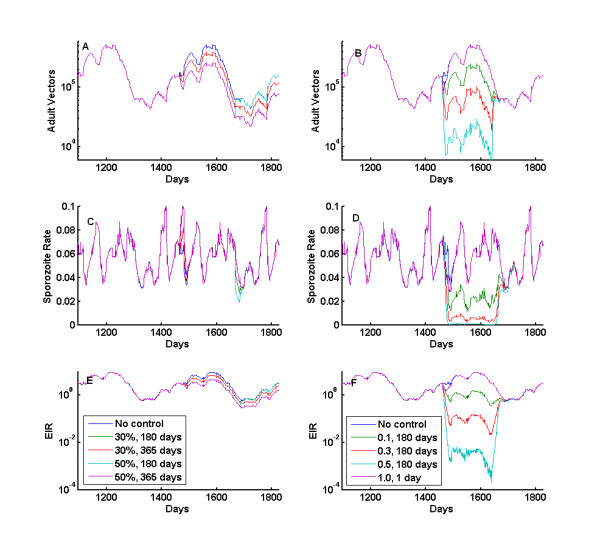
Verification
Claims the paper makes
The claims and statistics of this paper haven’t been checked yet.
Run the check — free, no account needed. It reads the open-access text and checks the sources it cites.
Claims other papers make about this one
Each is checked against this paper’s own text: does it say what the citing paper says it does?
The cited source doesn’t support the claim as written.
In the citing paper
“While investigating transmission dynamics is helpful, malaria models cannot be applied directly in irrigated regions as they typically rely only on rainfall as a source of water to quantify larval habitats.”
From Investigating the Impact of Irrigation on Malaria Vector Larval Habitats and Transmission Using a Hydrology‐Based Model (2023) · cites this paper as Eckhoff, 2011
Checked by a reasoning model — may be wrong.
Experimental — accuracy not yet measuredThe cited source doesn’t support the claim as written.
In the citing paper
“While widely used in malaria intervention studies (Galactionova et al., 2021), these models tend to neglect the larval habitat representation (Griffin et al., 2010; T. Smith et al., 2006) or rely only on rainfall to quantify larval habitats (Eckhoff, 2011).”
From Investigating the Impact of Irrigation on Malaria Vector Larval Habitats and Transmission Using a Hydrology‐Based Model (2023) · cites this paper as Eckhoff, 2011
Checked by a reasoning model — may be wrong.
Experimental — accuracy not yet measuredThe source backs part of the claim, not all of it — or backs it for a different population, condition or comparison.
In the citing paper
“The default habitat functions in EMOD are designed primarily to incorporate the variability of climate and the scaling factors and decay rates are usually calibrated to fit local data on vector abundance or entomological inoculation rate (EIR) rather than the habitat area per se (Eckhoff, 2011).”
From Investigating the Impact of Irrigation on Malaria Vector Larval Habitats and Transmission Using a Hydrology‐Based Model (2023) · cites this paper as Eckhoff, 2011
Experimental — accuracy not yet measured
Self-check
Percentages, sums and reported differences re-computed from the paper’s own numbers.
The self-check needs the paper’s full text.
Citations
Cites
The global distribution of clinical episodes of Plasmodium falciparum malaria
Snow, R. W., Guerra, C. A., Noor, A. M., Myint, H. Y., & Hay, S. I. (2005) · Nature · doi:10.1038/nature03342 · Cited by 2,758
The Epidemiology and Control of Malaria
(1960) · The Medical Journal of Australia · doi:10.5694/j.1326-5377.1960.tb105313.x · Cited by 1,316
A new world malaria map: Plasmodium falciparum endemicity in 2010
Gething, P. W., Patil, A. P., Smith, D. L., Guerra, C. A., Elyazar, I., Johnston, G. L., Tatem, A. J., & Hay, S. I. (2011) · Malaria Journal · doi:10.1186/1475-2875-10-378 · Cited by 1,169
Ross, R. (2010) · Cited by 940
A Climate-based Distribution Model of Malaria Transmission in Sub-Saharan Africa
Craig, M. H., Snow, R. W., & le Sueur, D. (1999) · Parasitology Today · doi:10.1016/s0169-4758(99)01396-4 · Cited by 854
The Biology of Mosquitoes, Volume 1: Development, Nutrition and Reproduction
Clements, A. N. (1992) · CABI eBooks · doi:10.1079/9780851993744.0000 · Cited by 715
A GLOBAL INDEX REPRESENTING THE STABILITY OF MALARIA TRANSMISSION
Kiszewski, A. E., Mellinger, A. D., Spielman, A., Malaney, P. N., Sachs, S. E., & Sachs, J. D. (2004) · American Journal of Tropical Medicine and Hygiene · doi:10.4269/ajtmh.2004.70.486 · Cited by 664
Griffin, J. T., Hollingsworth, T. D., Okell, L. C., Churcher, T. S., White, M., Hinsley, W., Bousema, T., Drakeley, C. J., Ferguson, N. M., Basáñez, M.-G., et al. (2010) · PLoS Medicine · doi:10.1371/journal.pmed.1000324 · Cited by 595
EPIDEMIOLOGY AND CONTROL OF MALARIA
Covell, G. (1957) · BMJ · doi:10.1136/bmj.2.5059.1477 · Cited by 542
A World Malaria Map: Plasmodium falciparum Endemicity in 2007
Hay, S. I., Guerra, C. A., Gething, P. W., Patil, A. P., Tatem, A. J., Noor, A. M., Kabaria, C. W., Manh, B. H., Elyazar, I., BROOKER, S. J., et al. (2009) · PLoS Medicine · doi:10.1371/journal.pmed.1000048 · Cited by 530
Research works printed but not linked: 1
- Gillies MT, De Meillon B: The Anophelinae of Africa, South of the Sahara. 1968, Johannesburg, South Africa: South African Institute for Medical Research
Cited by
Sorted by citations
Eckhoff, P. A., Wenger, E. A., Godfray, H. C. J., & Burt, A. (2016) · Proceedings of the National Academy of Sciences · doi:10.1073/pnas.1611064114 · Cited by 197
Self-citationHuho, B., Briët, O., Seyoum, A., Sikaala, C., Bayoh, N. M., Gimnig, J. E., Okumu, F. O., Diallo, D. A., Abdulla, S., Smith, T. A., et al. (2013) · International Journal of Epidemiology · doi:10.1093/ije/dys214 · Cited by 190
Tompkins, A. M., & Ermert, V. (2013) · Malaria Journal · doi:10.1186/1475-2875-12-65 · Cited by 155
Mathematical modeling of climate change and malaria transmission dynamics: a historical review
Eikenberry, S. E., & Gumel, A. B. (2018) · Journal of Mathematical Biology · doi:10.1007/s00285-018-1229-7 · Cited by 149
Heterogeneity, Mixing, and the Spatial Scales of Mosquito-Borne Pathogen Transmission
Perkins, T. A., Scott, T. W., Le Menach, A., & Smith, D. L. (2013) · PLoS Computational Biology · doi:10.1371/journal.pcbi.1003327 · Cited by 130
Agent-based models of malaria transmission: a systematic review
Smith, N. R., Trauer, J. M., Gambhir, M., Richards, J. S., Maude, R. J., Keith, J. M., & Flegg, J. A. (2018) · Malaria Journal · doi:10.1186/s12936-018-2442-y · Cited by 135
The Role of Vector Trait Variation in Vector-Borne Disease Dynamics
Cator, L. J., Johnson, L. R., Mordecai, E. A., Moustaid, F. E., Smallwood, T. R. C., LaDeau, S. L., Johansson, M. A., Hudson, P. J., Boots, M., Thomas, M. B., et al. (2020) · Frontiers in Ecology and Evolution · doi:10.3389/fevo.2020.00189 · Cited by 122
Implementation and applications of EMOD, an individual-based multi-disease modeling platform
Bershteyn, A., Gerardin, J., Bridenbecker, D., Lorton, C., Bloedow, J., Baker, R. S., Chabot‐Couture, G., Chen, Y., Fischle, T., Frey, K., et al. (2018) · Pathogens and Disease · doi:10.1093/femspd/fty059 · Cited by 111
A Periodically-Forced Mathematical Model for the Seasonal Dynamics of Malaria in Mosquitoes
Chitnis, N., Hardy, D., & Smith, T. A. (2012) · Bulletin of Mathematical Biology · doi:10.1007/s11538-011-9710-0 · Cited by 105
Killeen, G. F., Seyoum, A., Sikaala, C., Zomboko, A. S., Gimnig, J. E., Govella, N. J., & White, M. T. (2013) · Parasites & Vectors · doi:10.1186/1756-3305-6-172 · Cited by 100
Cameron, E., Battle, K. E., Bhatt, S., Weiss, D. J., Bisanzio, D., Mappin, B., Dalrymple, U., Hay, S. I., Smith, D. L., Griffin, J. T., et al. (2015) · Nature Communications · doi:10.1038/ncomms9170 · Cited by 95
Self-citationAchee, N. L., Youngblood, L. S., Bangs, M. J., Lavery, J. V., & James, S. L. (2015) · Vector-Borne and Zoonotic Diseases · doi:10.1089/vbz.2014.1628 · Cited by 92
Qualitative assessment of the role of temperature variations on malaria transmission dynamics
AGUSTO, F. B., GUMEL, A. B., & PARHAM, P. E. (2015) · Journal of Biological Systems · doi:10.1142/s0218339015500308 · Cited by 83
Methods and indicators for measuring patterns of human exposure to malaria vectors
Monroe, A. C., Moore, S., Okumu, F. O., Kiware, S. S., Lobo, N. F., Koenker, H. M., Sherrard-Smith, E., Gimnig, J. E., & Killeen, G. F. (2020) · Malaria Journal · doi:10.1186/s12936-020-03271-z · Cited by 84
Seasonality of Plasmodium falciparum transmission: a systematic review
Reiner, R. C., Geary, M., Atkinson, P. M., Smith, D. L., & Gething, P. W. (2015) · Malaria Journal · doi:10.1186/s12936-015-0849-2 · Cited by 82
Paaijmans, K. P., Cator, L. J., & Thomas, M. B. (2013) · PLoS ONE · doi:10.1371/journal.pone.0055777 · Cited by 79
Eckhoff, P. A. (2013) · American Journal of Tropical Medicine and Hygiene · doi:10.4269/ajtmh.12-0007 · Cited by 79
Self-citationC., H. M. S., Wu, S. L., Bennett, J. B., & Marshall, J. M. (2019) · Methods in Ecology and Evolution · doi:10.1111/2041-210x.13318 · Cited by 80
Antimalarial Transmission-Blocking Interventions: Past, Present, and Future
Delves, M. J., Angrisano, F., & Blagborough, A. M. (2018) · Trends in Parasitology · doi:10.1016/j.pt.2018.07.001 · Cited by 74
Selvaraj, P., Wenger, E. A., & Gerardin, J. (2018) · BMC Infectious Diseases · doi:10.1186/s12879-018-3319-y · Cited by 79
Sinka, M. E., Golding, N., Massey, N. C., Wiebe, A., Huang, Z., Hay, S. I., & Moyes, C. L. (2016) · Malaria Journal · doi:10.1186/s12936-016-1187-8 · Cited by 66
Gerardin, J., Eckhoff, P., & Wenger, E. A. (2015) · BMC Infectious Diseases · doi:10.1186/s12879-015-0887-y · Cited by 68
Self-citationReiker, T., Golumbeanu, M., Shattock, A. J., Burgert, L., Smith, T. A., Filippi, S., Cameron, E., & Penny, M. A. (2021) · Nature Communications · doi:10.1038/s41467-021-27486-z · Cited by 59
Johnston, G. L., Smith, D. L., & Fidock, D. A. (2013) · PLoS Computational Biology · doi:10.1371/journal.pcbi.1003025 · Cited by 60
Eckhoff, P. A. (2012) · PLoS ONE · doi:10.1371/journal.pone.0044950 · Cited by 61
Self-citationBiologically meaningful coverage indicators for eliminating malaria transmission
Kiware, S. S., Chitnis, N., Devine, G. J., Moore, S., Majambere, S., & Killeen, G. F. (2012) · Biology Letters · doi:10.1098/rsbl.2012.0352 · Cited by 60
Rejmánková, E., Grieco, J. P., Achee, N. L., & Roberts, D. R. (2013) · InTech eBooks · doi:10.5772/55229 · Cited by 59
Malaria and large dams in sub-Saharan Africa: future impacts in a changing climate
Kibret, S., Lautze, J., McCartney, M. P., Nhamo, L., & Wilson, G. G. (2016) · Malaria Journal · doi:10.1186/s12936-016-1498-9 · Cited by 61
Lunde, T. M., Korecha, D., Loha, E., Sorteberg, A., & Lindtjørn, B. (2013) · Malaria Journal · doi:10.1186/1475-2875-12-28 · Cited by 56
Modelling, T. M. R. C. P. O. C. I. A. (2017) · PLoS Medicine · doi:10.1371/journal.pmed.1002453 · Cited by 51
Gerardin, J., Ouédraogo, A. L., McCarthy, K. A., Eckhoff, P. A., & Wenger, E. A. (2015) · Malaria Journal · doi:10.1186/s12936-015-0751-y · Cited by 48
Self-citationKiware, S. S., Chitnis, N., Tatarsky, A., Wu, S. L., C., H. M. S., Gosling, R. D., Smith, D. L., & Marshall, J. M. (2017) · PLoS ONE · doi:10.1371/journal.pone.0187680 · Cited by 48
Eckhoff, P. A. (2012) · Malaria Journal · doi:10.1186/1475-2875-11-419 · Cited by 49
Self-citationGerardin, J., Bever, C. A., Bridenbecker, D., Hamainza, B., Silumbe, K., Miller, J. M., Eisele, T. P., Eckhoff, P. A., & Wenger, E. A. (2017) · Malaria Journal · doi:10.1186/s12936-017-1903-z · Cited by 45
Self-citationManore, C. A., Hickmann, K. S., Hyman, J. M., Foppa, I. M., Davis, J. K., Wesson, D. M., & Mores, C. N. (2015) · Journal of Biological Dynamics · doi:10.1080/17513758.2015.1005698 · Cited by 43
Adult vector control, mosquito ecology and malaria transmission
Brady, O. J., Godfray, H. C. J., Tatem, A. J., Gething, P. W., Cohen, J. M., McKenzie, F. E., Perkins, T. A., Reiner, R. C., Tusting, L. S., Scott, T. W., et al. (2015) · International Health · doi:10.1093/inthealth/ihv010 · Cited by 43
Application of mathematical modelling to inform national malaria intervention planning in Nigeria
Ozodiegwu, I. D., Ambrose, M. R., Galatas, B., Runge, M., Nandi, A., Okuneye, K., Dhanoa, N. P., Maikore, I., Uhomoibhi, P., Bever, C. A., et al. (2023) · Malaria Journal · doi:10.1186/s12936-023-04563-w · Cited by 41
Carlon, E., & Dominoni, D. M. (2024) · Journal of Urban Ecology · doi:10.1093/jue/juae015 · Cited by 40
A mathematical model of the impact of present and future malaria vaccines
Wenger, E. A., & Eckhoff, P. A. (2013) · Malaria Journal · doi:10.1186/1475-2875-12-126 · Cited by 41
Self-citationGerardin, J., Bever, C. A., Hamainza, B., Miller, J. M., Eckhoff, P. A., & Wenger, E. A. (2016) · PLoS Computational Biology · doi:10.1371/journal.pcbi.1004707 · Cited by 39
Self-citationInsecticide-resistant mosquitoes and malaria control
Blayneh, K. W., & Mohammed-Awel, J. (2014) · Mathematical Biosciences · doi:10.1016/j.mbs.2014.03.007 · Cited by 38
Species diversity and distribution of Anopheles mosquitoes in Bure district, Northwestern Ethiopia
Adugna, T., Getu, E., & Yewhalaw, D. (2020) · Heliyon · doi:10.1016/j.heliyon.2020.e05063 · Cited by 37
An agent-based model of the population dynamics of Anopheles gambiae
Arifin, S. N., Zhou, Y., Davis, G. J., Gentile, J. E., Madey, G. R., & Collins, F. H. (2014) · Malaria Journal · doi:10.1186/1475-2875-13-424 · Cited by 40
Assessing Strategies Against Gambiense Sleeping Sickness Through Mathematical Modeling
Rock, K. S., Ndeffo-Mbah, M. L., Castaño, S., Palmer, C., Pandey, A., Atkins, K. E., Ndung’u, J. M., Hollingsworth, T. D., Galvani, A. P., Bever, C. A., et al. (2018) · Clinical Infectious Diseases · doi:10.1093/cid/ciy018 · Cited by 38
Model-Informed Drug Development for Malaria Therapeutics
Andrews, K. A., WESCHE, D. L., McCarthy, J. S., Möhrle, J. J., Tärning, J., Phillips, L., Kern, S. E., & Grasela, T. H. (2017) · The Annual Review of Pharmacology and Toxicology · doi:10.1146/annurev-pharmtox-010715-103429 · Cited by 34
Association between meteorological factors and the prevalence dynamics of Japanese encephalitis
Tu, T., Xu, K., Xu, L., Gao, Y. J., Zhou, Y., He, Y., Liu, Y., Liu, Q., Ji, H., & Tang, W. (2021) · PLoS ONE · doi:10.1371/journal.pone.0247980 · Cited by 33
Estimating malaria transmission through mathematical models
Stuckey, E. M., Smith, T. A., & Chitnis, N. (2013) · Trends in Parasitology · doi:10.1016/j.pt.2013.08.001 · Cited by 34
Malaria Elimination Campaigns in the Lake Kariba Region of Zambia: A Spatial Dynamical Model
Nikolov, M., Bever, C. A., Upfill-Brown, A. M., Hamainza, B., Miller, J. M., Eckhoff, P. A., Wenger, E. A., & Gerardin, J. (2016) · PLoS Computational Biology · doi:10.1371/journal.pcbi.1005192 · Cited by 33
Self-citationMbouna, A. D., Tompkins, A. M., Lenouo, A., Asare, E. O., Yamba, E. I., & Tchawoua, C. (2019) · Malaria Journal · doi:10.1186/s12936-019-2991-8 · Cited by 32
Agent-based modeling of malaria vectors: the importance of spatial simulation
Bomblies, A. (2014) · Parasites & Vectors · doi:10.1186/1756-3305-7-308 · Cited by 32
Wallace, D. I., Southworth, B. S., Shi, X., Chipman, J., & Githeko, A. K. (2014) · Malaria Journal · doi:10.1186/1475-2875-13-268 · Cited by 36
A. Manore, C., S. Hickmann, K., M. Hyman, J., M. Foppa, I., K. Davis, J., M. Wesson, D., & N. Mores, C. (2015) · Figshare · doi:10.6084/m9.figshare.1301024 · Cited by 32
Projected impacts of climate change on malaria in Africa
Symons, T. L., Moran, A., Balzarolo, A., Vargas-Ruiz, C. A., Robertson, M., Lubinda, J., Saddler, A., McPhail, M., Harris, J., Rozier, J. A., et al. (2026) · Nature · doi:10.1038/s41586-025-10015-z · Cited by 32
Endectocide-treated cattle for malaria control: A coupled entomological-epidemiological model
Yakob, L. (2016) · Parasite Epidemiology and Control · doi:10.1016/j.parepi.2015.12.001 · Cited by 31
Modelling Anopheles gambiae s.s. Population Dynamics with Temperature- and Age-Dependent Survival
Christiansen-Jucht, C., Erguler, K., Shek, C. Y., Basáñez, M.-G., & Parham, P. E. (2015) · International Journal of Environmental Research and Public Health · doi:10.3390/ijerph120605975 · Cited by 32
Spatial Effects on the Multiplicity of Plasmodium falciparum Infections
Karl, S., White, M. T., Milne, G. J., Gurarie, D., Hay, S. I., Barry, A. E., Felger, I., & Müeller, I. (2016) · PLoS ONE · doi:10.1371/journal.pone.0164054 · Cited by 30
McCarthy, K. A., Wenger, E. A., Huynh, G. H., & Eckhoff, P. A. (2015) · Malaria Journal · doi:10.1186/1475-2875-14-6 · Cited by 30
Self-citationAdugna, T., Yewhelew, D., & Getu, E. (2021) · Parasites & Vectors · doi:10.1186/s13071-021-04669-7 · Cited by 29
Modelling the impact of climatic variables on malaria transmission
Abiodun, G. J., & Witbooi, P. J. (2017) · Hacettepe Journal of Mathematics and Statistics · doi:10.15672/hjms.2017.452 · Cited by 29
An Environmental Data Set for Vector-Borne Disease Modeling and Epidemiology
Chabot‐Couture, G., Nigmatulina, K. R., & Eckhoff, P. A. (2014) · PLoS ONE · doi:10.1371/journal.pone.0094741 · Cited by 29
Self-citationArifin, S. N., Madey, G. R., & Collins, F. H. (2013) · Malaria Journal · doi:10.1186/1475-2875-12-290 · Cited by 28
Selvaraj, P., Wenger, E. A., Bridenbecker, D., Windbichler, N., Russell, J. R., Gerardin, J., Bever, C. A., & Nikolov, M. (2020) · PLoS Computational Biology · doi:10.1371/journal.pcbi.1008121 · Cited by 27
Chaturvedi, S. K., & Dwivedi, S. (2021) · International Journal of Biometeorology · doi:10.1007/s00484-021-02097-x · Cited by 27
Inferring Plasmodium vivax Transmission Networks from Tempo-Spatial Surveillance Data
Shi, B., Liu, J., Zhou, X., & Yang, G.-J. (2014) · PLoS neglected tropical diseases · doi:10.1371/journal.pntd.0002682 · Cited by 27
Ren, Z., Wang, D., Hwang, J., Bennett, A. F., Sturrock, H. J. W., Ma, A., Huang, J., Xia, Z., Feng, X., & Wang, J. (2015) · PLoS ONE · doi:10.1371/journal.pone.0116932 · Cited by 26
Accessing the syndemic of COVID-19 and malaria intervention in Africa
Shi, B., Zheng, J., Xia, S., Lin, S., Wang, X., Liu, Y., Zhou, X.-N., & Liu, J. (2021) · Infectious Diseases of Poverty · doi:10.1186/s40249-020-00788-y · Cited by 25
Risk assessment of malaria transmission at the border area of China and Myanmar
Shi, B., Zheng, J., Qiu, H., Yang, G.-J., Xia, S., & Zhou, X.-N. (2017) · Infectious Diseases of Poverty · doi:10.1186/s40249-017-0322-2 · Cited by 25
Ng’habi, K. R., Viana, M., Matthiopoulos, J., Lyimo, I. N., Killeen, G. F., & Ferguson, H. M. (2018) · Scientific Reports · doi:10.1038/s41598-018-31805-8 · Cited by 27
Leung, S., Windbichler, N., Wenger, E. A., Bever, C. A., & Selvaraj, P. (2022) · Malaria Journal · doi:10.1186/s12936-022-04242-2 · Cited by 24
Spatial dynamics of malaria transmission
Wu, S. L., Henry, J. M., Citron, D., Ssebuliba, D. M., Nakakawa, J. N., C., H. M. S., Brady, O. J., Guerra, C. A., García, G. A., Carter, A. R., et al. (2023) · PLoS Computational Biology · doi:10.1371/journal.pcbi.1010684 · Cited by 24
Alam, M. Z., Arifin, S. M. N., Al‐Amin, H. M., Alam, M. S., & Rahman, M. S. (2017) · Malaria Journal · doi:10.1186/s12936-017-2075-6 · Cited by 25
New insight-guided approaches to detect, cure, prevent and eliminate malaria
Kumar, S., Kumari, R., & Pandey, R. (2014) · PROTOPLASMA · doi:10.1007/s00709-014-0697-x · Cited by 23
Shcherbacheva, A., Haario, H., & Killeen, G. F. (2017) · Mathematical Biosciences · doi:10.1016/j.mbs.2017.10.005 · Cited by 22
Metchanun, N., Borgemeister, C., Amzati, G., von Braun, J., Nikolov, M., Selvaraj, P., & Gerardin, J. (2021) · Evolutionary Applications · doi:10.1111/eva.13331 · Cited by 21
Incorporating ecology into gene drive modelling
Kim, J., Harris, K. D., Kim, I. K., Shemesh, S., Messer, P. W., & Greenbaum, G. (2023) · Ecology Letters · doi:10.1111/ele.14194 · Cited by 21
ANOSPEX: A Stochastic, Spatially Explicit Model for Studying Anopheles Metapopulation Dynamics
Oluwagbemi, O. O., Fornadel, C. M., Adebiyi, E. F., Norris, D. E., & Rasgon, J. L. (2013) · PLoS ONE · doi:10.1371/journal.pone.0068040 · Cited by 21
Optimal Seasonal Timing of Oral Azithromycin for Malaria
Gao, D., Amza, A., Nassirou, B., Kadri, B., Sippl-Swezey, N., Liu, F., Ackley, S. F., Lietman, T. M., & Porco, T. C. (2014) · American Journal of Tropical Medicine and Hygiene · doi:10.4269/ajtmh.13-0474 · Cited by 21
Analysis of the Model on the Effect of Seasonal Factors on Malaria Transmission Dynamics
Yiga, V., Nampala, H., & Tumwiine, J. (2020) · Journal of Applied Mathematics · doi:10.1155/2020/8885558 · Cited by 20
Landscape Epidemiology Modeling Using an Agent-Based Model and a Geographic Information System
Arifin, S. M. N., Arifin, R. R., Pitts, D. A. D. A., Rahman, M. A., Nowreen, S., Madey, G. R., & Collins, F. (2015) · Land · doi:10.3390/land4020378 · Cited by 22
Parham, P. E., & Hughes, D. A. (2015) · Philosophical Transactions of the Royal Society B Biological Sciences · doi:10.1098/rstb.2013.0557 · Cited by 21
Majambere, S., Massue, D. J., Mlacha, Y. P., Govella, N. J., Magesa, S. M., & Killeen, G. F. (2013) · Parasites & Vectors · doi:10.1186/1756-3305-6-53 · Cited by 20
Evaluation of different deployment strategies for larviciding to control malaria: a simulation study
Runge, M., Mapua, S. A., Nambunga, I. H., Smith, T. A., Chitnis, N., Okumu, F. O., & Pothin, E. (2021) · Malaria Journal · doi:10.1186/s12936-021-03854-4 · Cited by 19
Needs for Monitoring Mosquito Transmission of Malaria in a Pre-Elimination World
James, S. L., Takken, W., Collins, F. H., & Gottlieb, M. (2013) · American Journal of Tropical Medicine and Hygiene · doi:10.4269/ajtmh.13-0175 · Cited by 19
Malaria Modeling in the Era of EradicationPreprint
Smith, T. A., Chitnis, N., Penny, M. A., & Tanner, M. (2016) · Cold Spring Harbor Perspectives in Medicine · doi:10.1101/cshperspect.a025460 · Cited by 21
Okafor, C., & Ogbonnaya, N. P. (2020) · European Journal of Midwifery · doi:10.18332/ejm/130591 · Cited by 18
Selvaraj, P., Suresh, J., Wenger, E. A., Bever, C. A., & Gerardin, J. (2019) · Malaria Journal · doi:10.1186/s12936-019-2942-4 · Cited by 17
Moore, S. M., ten Bosch, Q. A., Siraj, A. S., Soda, K., España, G., Campo, A., Gómez, S., Salas, D., Raybaud, B., Wenger, E. A., et al. (2018) · BMC Medicine · doi:10.1186/s12916-018-1127-2 · Cited by 15
Mining geographic variations of Plasmodium vivax for active surveillance: a case study in China
Shi, B., Tan, Q., Zhou, X., & Liu, J. (2015) · Malaria Journal · doi:10.1186/s12936-015-0719-y · Cited by 15
Lutambi, A. M., Chitnis, N., Briët, O., Smith, T. A., & Penny, M. A. (2014) · PLoS ONE · doi:10.1371/journal.pone.0097065 · Cited by 15
Collins, K. A., Ouédraogo, A., Guelbeogo, M. W., Awandu, S. S., Stone, W. J., Soulama, I., Ouattara, M. S., Nombré, A., Diarra, A., Bradley, J., et al. (2019) · BMJ Open · doi:10.1136/bmjopen-2019-030598 · Cited by 15
Modelling the implications of stopping vector control for malaria control and elimination
Yukich, J. O., & Chitnis, N. (2017) · Malaria Journal · doi:10.1186/s12936-017-2051-1 · Cited by 14
Arifin, S. M. N., & Madey, G. R. (2015) · Simulation foundations, methods and applications · doi:10.1007/978-3-319-15096-3_10 · Cited by 14
Tompkins, A. M., Larsen, L., McCreesh, N., & Taylor, D. M. (2016) · Geospatial health · doi:10.4081/gh.2016.407 · Cited by 14
Ukawuba, I., & Shaman, J. L. (2022) · PLoS Computational Biology · doi:10.1371/journal.pcbi.1010161 · Cited by 15
Impact of mass drug administration campaigns depends on interaction with seasonal human movement
Gerardin, J., Bertozzi-Villa, A., Eckhoff, P. A., & Wenger, E. A. (2018) · International Health · doi:10.1093/inthealth/ihy025 · Cited by 13
Self-citationRising Pediatric Morbidity and Mortality in the Developing World
Ali, H., & Aziz, S. (2021) · Cureus · doi:10.7759/cureus.14728 · Cited by 13
Inference and prediction of malaria transmission dynamics using time series data
Shi, B., Lin, S., Tan, Q., Cao, J., Zhou, X., Xia, S., Zhou, X.-N., & Liu, J. (2020) · Infectious Diseases of Poverty · doi:10.1186/s40249-020-00696-1 · Cited by 12
Description of the EMOD-HIV Model v0.7Preprint
Bershteyn, A., Klein, D. J., Wenger, E. A., & Eckhoff, P. A. (2012) · arXiv (Cornell University) · doi:10.48550/arxiv.1206.3720 · Cited by 12
Self-citationSpatial modelling for population replacement of mosquito vectors at continental scale
Beeton, N. J., Wilkins, A., Ickowicz, A., Hayes, K. R., & Hosack, G. R. (2022) · PLoS Computational Biology · doi:10.1371/journal.pcbi.1009526 · Cited by 11
A minimal 3D model of mosquito flight behaviour around the human baited bed net
Jones, J., Murray, G. P. D., & McCall, P. J. (2021) · Malaria Journal · doi:10.1186/s12936-020-03546-5 · Cited by 11
Metadata
- Authors
- Eckhoff, P. A.
- Affiliations
- Intellectual Ventures (United States) (US)
- Corresponding author
- Eckhoff, Philip A
- ORCID
- Eckhoff, Philip A
- Venue
- Malaria Journal
- Published
- 2011-10-17
- Volume
- 10
- Issue
- 1
- Pages
- 303-303
- ISSN
- 1475-2875 (ISSN-L)
- PMC
- PMC3224385
- OpenAlex
- W2136547339
- Cited by
- 191
- References
- 72
- Citations by year
- 2026: 6 · 2025: 8 · 2024: 11 · 2023: 13 · 2022: 11 · 2021: 19 · 2020: 12 · 2019: 10 · 2018: 14 · 2017: 12 · 2016: 17 · 2015: 20 · 2014: 13 · 2013: 19 · 2012: 6
- FWCI
- 11.95
- Type
- journal article
- Language
- en
- Open access
- gold
- doi.org
- Licence
- Locations
- Malaria Journal (publishedVersion, cc-by)
- PubMed Central (publishedVersion, cc-by)
- PubMed (publishedVersion)
- DOAJ (DOAJ: Directory of Open Access Journals) (submittedVersion, cc-by-sa)
- Funders
- Bill and Melinda Gates Foundation
- Topics
- Health Sciences › Medicine › Public Health, Environmental and Occupational Health › Malaria Research and Control
- Physical Sciences › Mathematics › Applied Mathematics › Mathematical and Theoretical Epidemiology and Ecology Models
- Health Sciences › Medicine › Public Health, Environmental and Occupational Health › Mosquito-borne diseases and control
- Keywords
- malaria transmission, mosquito population dynamics, mosquito life cycle, vector control, malaria elimination, anthropophily, indoor feeding, bed nets, indoor residual spraying, larval source management, space spraying, agent-based modeling, vector bionomics
- MeSH terms
- Animals, Computer Simulation, Disease Vectors, Female, Humans, Life Cycle Stages, Malaria, Mosquito Control, Culicidae, Population Dynamics, Tanzania, Weather, Ecosystem
About these checks
Registry, retraction, Cites and statistics results are computed, not judged, with one exception: a printed reference that no index lists is read once by a model before it counts as a citation error. Claims are extracted by a model and kept only when their quote appears verbatim in the text; each cited source is then checked, with a model’s help, for whether it says what the claim relies on. Those verdicts can be wrong — read the claim’s quote and the cited source before relying on one.
Statistics and arithmetic are recomputed, not judged.
Confidence bands are shown only for fields calibrated on our annotated test set. None is calibrated yet, so no band is shown.
What counts as a claim ›How we measure confidence ›How we check this ›
Are you an author, or do you see a problem with this page? Request a review
