

The DOI matches its Crossref record; 47 of the 48 references it cites were found in a registry or an index.
Conjugated linoleic acid or omega 3 fatty acids increase mitochondrial biosynthesis and metabolism in skeletal muscle cells
Open accessAbstract
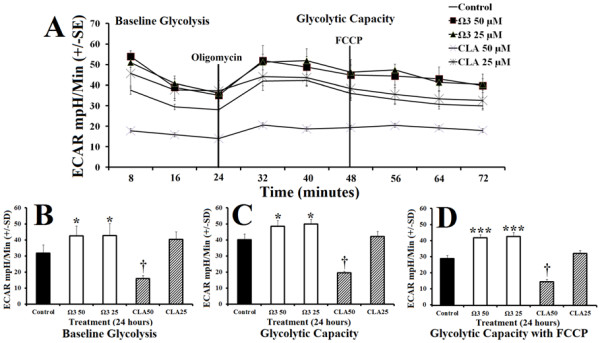
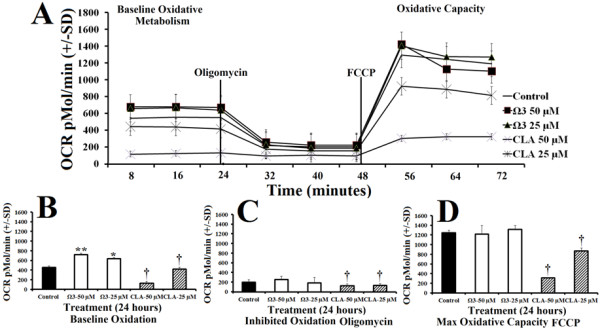
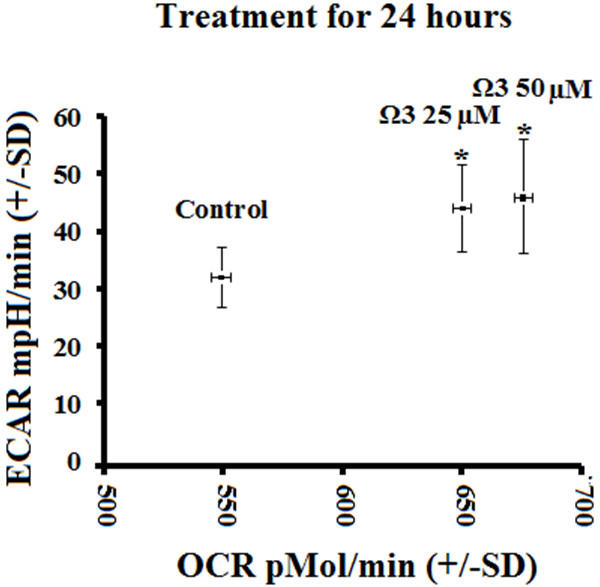
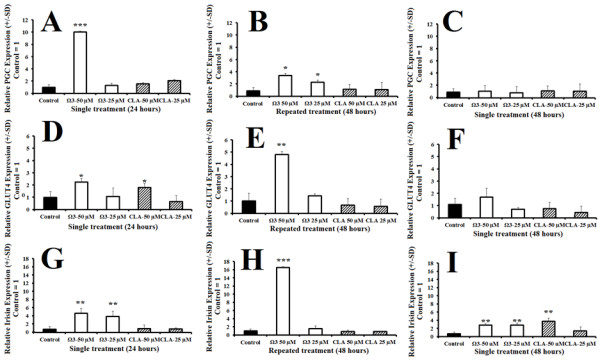
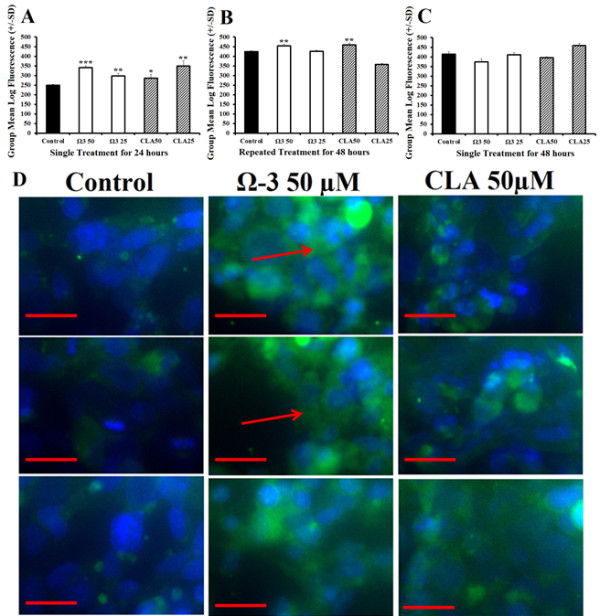
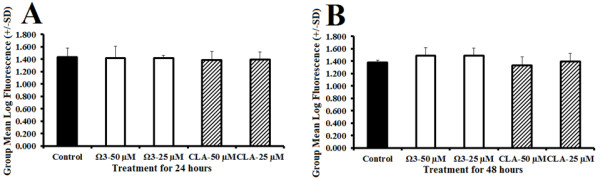
BACKGROUND: Polyunsaturated fatty acids are popular dietary supplements advertised to contribute to weight loss by increasing fat metabolism in liver, but the effects on overall muscle metabolism are less established. We evaluated the effects of conjugated linoleic acid (CLA) or combination omega 3 on metabolic characteristics in muscle cells. METHODS: Human rhabdomyosarcoma cells were treated with either DMSO control, or CLA or combination omega 3 for 24 or 48 hours. RNA was determined using quantitative reverse transcriptase polymerase chain reaction (qRT-PCR). Mitochondrial content was determined using flow cytometry and immunohistochemistry. Metabolism was quantified by measuring extracellular acidification and oxygen consumption rates. RESULTS: Omega 3 significantly induced metabolic genes as well as oxidative metabolism (oxygen consumption), glycolytic capacity (extracellular acidification), and metabolic rate compared with control. Both treatments significantly increased mitochondrial content. CONCLUSION: Omega 3 fatty acids appear to enhance glycolytic, oxidative, and total metabolism. Moreover, both omega 3 and CLA treatment significantly increase mitochondrial content compared with control.
Overview
The claims and statistics of this paper haven’t been checked yet.
Run the check — free, no account needed. It reads the open-access text and checks the sources it cites.
Integrity signals
Registry
Cites
Statistics
Figures
Verification
Claims the paper makes
The claims and statistics of this paper haven’t been checked yet.
Run the check — free, no account needed. It reads the open-access text and checks the sources it cites.
Claims other papers make about this one
Each is checked against this paper’s own text: does it say what the citing paper says it does?
In the citing paper
“Similarly, a human cell line study also reported that omega-3 treatment significantly induced both glycolytic and oxidative metabolism and increased mitochondrial content [92].”
From Mitochondrial Adaptation in Skeletal Muscle: Impact of Obesity, Caloric Restriction, and Dietary Compounds (2024) · cites this paper as [92]
In the citing paper
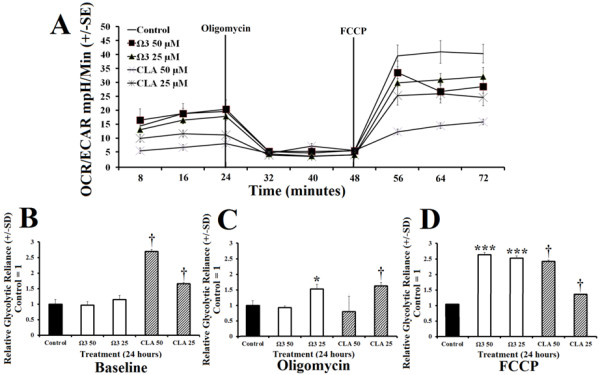
“Furthermore, a combination of EPA and DHA in rhabdomyosarcoma cells reduced the ratio between the oxygen consumption rate: extracellular acidification rate indicating a shift towards an increase on glycolytic reliance [94].”
From Omega-3 Fatty Acids and Skeletal Muscle Health (2015) · cites this paper as [94]
In the citing paper
“Multiple studies have observed an increase in GLUT4 expression [93,94]”
From Omega-3 Fatty Acids and Skeletal Muscle Health (2015) · cites this paper as [94]
Self-check
Percentages, sums and reported differences re-computed from the paper’s own numbers.
The self-check needs the paper’s full text.
Citations
Cites
A new mathematical model for relative quantification in real-time RT-PCR
Pfaffl, M. W. (2001) · Nucleic Acids Research · doi:10.1093/nar/29.9.e45 · Cited by 34,610
A PGC1-α-dependent myokine that drives brown-fat-like development of white fat and thermogenesis
Boström, P., Wu, J., Jedrychowski, M. P., Korde, A., Ye, L., Lo, J. C., Rasbach, K. A., Boström, E. A., Choi, J. H., Long, J. Z., et al. (2012) · Nature · doi:10.1038/nature10777 · Cited by 4,810
Wu, Z., Puigserver, P., Andersson, U., Zhang, C., Adelmant, G., Mootha, V., Troy, A., Cinti, S., Lowell, B., Scarpulla, R. C., et al. (1999) · Cell · doi:10.1016/s0092-8674(00)80611-x · Cited by 4,139
Patti, M. E., Butte, A. J., Crunkhorn, S., Cusi, K., Berria, R., Kashyap, S., Miyazaki, Y., Kohane, I., Costello, M., Saccone, R., et al. (2003) · Proceedings of the National Academy of Sciences · doi:10.1073/pnas.1032913100 · Cited by 1,952
Control of hepatic gluconeogenesis through the transcriptional coactivator PGC-1
Yoon, J. C., Puigserver, P., Chen, G., Donovan, J., Wu, Z., Rhee, J., Adelmant, G., Stafford, J., Kahn, C. R., Granner, D. K., et al. (2001) · Nature · doi:10.1038/35093050 · Cited by 1,821
Insulin-regulated hepatic gluconeogenesis through FOXO1–PGC-1α interaction
Puigserver, P., Rhee, J., Donovan, J., Walkey, C. J., Yoon, J. C., Oriente, F., Kitamura, Y., Altomonte, J., Dong, H., Accili, D., et al. (2003) · Nature · doi:10.1038/nature01667 · Cited by 1,487
Vega, R. B., Huss, J. M., & Kelly, D. P. (2000) · Molecular and Cellular Biology · doi:10.1128/mcb.20.5.1868-1876.2000 · Cited by 1,195
Omega-3 Fatty Acids and Inflammatory Processes
Calder, P. C. (2010) · Nutrients · doi:10.3390/nu2030355 · Cited by 1,116
Mootha, V. K., Handschin, C., Arlow, D., Xie, X., St. Pierre, J., Sihag, S., Yang, W., Altshuler, D., Puigserver, P., Patterson, N., et al. (2004) · Proceedings of the National Academy of Sciences · doi:10.1073/pnas.0401401101 · Cited by 688
Regulation of mitochondrial biogenesis in skeletal muscle by CaMK
Wu, H., Kanatous, S. B., Thurmond, F. A., Gallardo, T., Isotani, E., Bassel-Duby, R., & Williams, R. S. (2002) · Science · doi:10.1126/science.1071163 · Cited by 684
Schreiber, S., Emter, R., Hock, M. B., Knutti, D., Cardenas, J., Podvinec, M., Oakeley, E. J., & Kralli, A. (2004) · Proceedings of the National Academy of Sciences · doi:10.1073/pnas.0308686101 · Cited by 678
Fatty acids and inflammation: The cutting edge between food and pharma
Calder, P. C. (2011) · European Journal of Pharmacology · doi:10.1016/j.ejphar.2011.05.085 · Cited by 533
Effects of conjugated linoleic acid on body fat and energy metabolism in the mouse
West, D. B., DeLany, J. P., Camet, P. M., Blohm, F., Truett, A. A., & Scimeca, J. A. (1998) · American Journal of Physiology-Regulatory, Integrative and Comparative Physiology · doi:10.1152/ajpregu.1998.275.3.r667 · Cited by 468
Phytochemicals and regulation of the adipocyte life cycle
Rayalam, S., Della‐Fera, M. A., & Baile, C. A. (2008) · The Journal of Nutritional Biochemistry · doi:10.1016/j.jnutbio.2007.12.007 · Cited by 454
Flachs, P., Horakova, O., Brauner, P., Rossmeisl, M., Pecina, P., Franssen-van Hal, N., Ruzickova, J., Sponarova, J., Drahota, Z., Vlcek, C., et al. (2005) · Diabetologia · doi:10.1007/s00125-005-1944-7 · Cited by 388
Polyunsaturated fatty acids of marine origin induce adiponectin in mice fed a high-fat diet
Flachs, P., Mohamed‐Ali, V., Horakova, O., Rossmeisl, M., Hosseinzadeh‐Attar, M. J., Hensler, M., Ruzickova, J., & Kopecký, J. (2006) · Diabetologia · doi:10.1007/s00125-005-0053-y · Cited by 362
Choi, Y., Kim, Y., Han, Y.-B., Park, Y., Pariza, M. W., & Ntambi, J. M. (2000) · Journal of Nutrition · doi:10.1093/jn/130.8.1920 · Cited by 297
Flachs, P., Rossmeisl, M., Bryhn, M., & Kopecký, J. (2008) · Clinical Science · doi:10.1042/cs20070456 · Cited by 293
A Tissue-Specific Coactivator of Steroid Receptors, Identified in a Functional Genetic Screen
Knutti, D., Kaul, A., & Kralli, A. (2000) · Molecular and Cellular Biology · doi:10.1128/mcb.20.7.2411-2422.2000 · Cited by 286
Randomized trial of weight-loss-diets for young adults varying in fish and fish oil content
Þórsdóttir, I., Tómasson, H., Gunnarsdóttir, I., Gisladottir, E. U., Kiely, M. E., Parra, M. D., Bandarra, N. M., Schaafsma, G., & Martínez, J. A. (2007) · International Journal of Obesity · doi:10.1038/sj.ijo.0803643 · Cited by 265
Prevention of insulin resistance by n-3 polyunsaturated fatty acids
Fedor, D. M., & Kelley, D. S. (2009) · Current Opinion in Clinical Nutrition & Metabolic Care · doi:10.1097/mco.0b013e3283218299 · Cited by 229
Krebs, J. D., Browning, L. M., McLean, N., Rothwell, J. L., Mishra, G. D., Moore, C. S., & Jebb, S. A. (2006) · International Journal of Obesity · doi:10.1038/sj.ijo.0803309 · Cited by 228
Efficacy and safety of dietary supplements containing CLA for the treatment of obesity
Larsen, T. M., Toubro, S., & Astrup, A. V. (2003) · Journal of Lipid Research · doi:10.1194/jlr.r300011-jlr200 · Cited by 206
Esterbauer, H., Oberkofler, H., Krempler, F., & Patsch, W. (1999) · Genomics · doi:10.1006/geno.1999.5977 · Cited by 206
Plasman-3 polyunsaturated fatty acids are negatively associated with obesity
Micallef, M. A., Munro, I., Phang, M., & Garg, M. L. (2009) · British Journal Of Nutrition · doi:10.1017/s0007114509382173 · Cited by 204
Semple, R. K., Crowley, V. C., Sewter, C. P., Laudes, M., Christodoulides, C., Considine, R. V., Vidal-Puig, A., & O'Rahilly, S. (2004) · International Journal of Obesity · doi:10.1038/sj.ijo.0802482 · Cited by 203
Anti‐obesity effects of conjugated linoleic acid, docosahexaenoic acid, and eicosapentaenoic acid
Li, J., Huang, C. J., & Xie, D. (2008) · Molecular Nutrition & Food Research · doi:10.1002/mnfr.200700399 · Cited by 157
Takahashi, Y., Kushiro, M., Shinohara, K., & Ide, T. (2003) · Biochimica et Biophysica Acta (BBA) - Molecular and Cell Biology of Lipids · doi:10.1016/s1388-1981(03)00038-6 · Cited by 154
Reduced Expression of FOXC2 and Brown Adipogenic Genes in Human Subjects with Insulin Resistance
Yang, X., Enerbäck, S., & Smith, U. (2003) · Obesity Research · doi:10.1038/oby.2003.163 · Cited by 150
Adiponectin translation is increased by the PPARγ agonists pioglitazone and ω-3 fatty acids
Banga, A., Ünal, R., Tripathi, P., Pokrovskaya, I. D., Owens, R. J., Kern, P. A., & Ranganathan, G. (2008) · American Journal of Physiology-Endocrinology and Metabolism · doi:10.1152/ajpendo.90892.2008 · Cited by 142
n-3 PUFA: bioavailability and modulation of adipose tissue function
Kopecký, J., Rossmeisl, M., Flachs, P., Kuda, O., Brauner, P., Jílková, Z. M., Staňková, B., TVRZICKÁ, E., & Bryhn, M. (2009) · Proceedings of The Nutrition Society · doi:10.1017/s0029665109990231 · Cited by 138
Chung, S., Brown, J. M., Sandberg, M. B., & McIntosh, M. (2005) · Journal of Lipid Research · doi:10.1194/jlr.m400476-jlr200 · Cited by 92
Chowdhury, S. K. R., Dobrowsky, R. T., & Fernyhough, P. (2011) · Mitochondrion · doi:10.1016/j.mito.2011.06.007 · Cited by 82
Inclusion of fish or fish oil in weight-loss diets for young adults: Effects on blood lipids
Gunnarsdottir, I., Tomasson, H., Kiely, M., Martinéz, J. A., Bandarra, N. M., Morais, M. G., & Thorsdottir, I. (2008) · International Journal of Obesity · doi:10.1038/ijo.2008.64 · Cited by 79
Anti-Obesity Effect of Fish Oil and Fish Oil-Fenofibrate Combination in Female KK Mice
Arai, T., Kim, H.-J., Chiba, H., & Matsumoto, A. (2009) · Journal of Atherosclerosis and Thrombosis · doi:10.5551/jat.1313 · Cited by 75
Omega-3 polyunsaturated fatty acids
Hull, M. A. (2011) · Best Practice & Research Clinical Gastroenterology · doi:10.1016/j.bpg.2011.08.001 · Cited by 73
Hassanali, Z., Ametaj, B. N., Field, C. J., Proctor, S. D., & Vine, D. F. (2009) · Diabetes Obesity and Metabolism · doi:10.1111/j.1463-1326.2009.01130.x · Cited by 72
Lam, Y. Y., Hatzinikolas, G., Weir, J. M., Janovská, A., McAinch, A. J., Game, P. A., Meikle, P. J., & Wittert, G. (2011) · Biochimica et Biophysica Acta (BBA) - Molecular and Cell Biology of Lipids · doi:10.1016/j.bbalip.2011.04.011 · Cited by 60
Ramel, A., Parra, D., Martinez, J., Kiely, M., & Thorsdottir, I. (2009) · European Journal of Nutrition · doi:10.1007/s00394-008-0769-9 · Cited by 49
Vemuri, M., Kelley, D. S., Mackey, B. E., Rasooly, R., & Bartolini, G. (2007) · Metabolic Syndrome and Related Disorders · doi:10.1089/met.2007.0007 · Cited by 46
Yanagita, T., Wang, Y., Nagao, K., Ujino, Y., & Inoue, N. (2005) · Journal of Agricultural and Food Chemistry · doi:10.1021/jf052203i · Cited by 44
The PGC-1α-related coactivator promotes mitochondrial and myogenic adaptations in C2C12 myotubes
Philp, A., Belew, M. Y., Evans, A., Pham, D., Sivia, I., Chen, A., Schenk, S., & Baar, K. (2011) · American Journal of Physiology-Regulatory, Integrative and Comparative Physiology · doi:10.1152/ajpregu.00232.2011 · Cited by 42
Zaima, N., Sugawara, T., Goto, D., & Hirata, T. (2006) · Journal of Lipid Research · doi:10.1194/jlr.m600273-jlr200 · Cited by 33
Zhai, J., Liu, Z., Li, J.-M., Chen, J., Jiang, L. H., Wang, D., Yuan, J., Shen, J., Yang, D., & Chen, J. (2010) · The Journal of Nutritional Biochemistry · doi:10.1016/j.jnutbio.2009.09.007 · Cited by 33
Armoni, M., Quon, M. J., Maor, G., Avigad, S., Shapiro, D. N., Harel, C., Esposito, D. L., Goshen, Y., Yaniv, I., & Karnieli, E. (2002) · The Journal of Clinical Endocrinology & Metabolism · doi:10.1210/jc.2002-020318 · Cited by 30
Omega-3 Fatty Acid Ethyl Esters (Omacor®) For The Treatment Of Hypertriglyceridemia
Bhatnagar, D., & Hussain, F. (2007) · Future Lipidology · doi:10.2217/17460875.2.3.263 · Cited by 6
(2005) · Proceedings of the National Academy of Sciences · doi:10.1073/pnas.0505010102 · Cited by 2
Research works printed but not linked: 1
- Duda MK, Xu WH, Tintinu A, O'Shea KM, Stanley WC: Eicosapentaenoic Acid (EPA) and Docosahexaenoic Acid (DHA) Supplementation, but not alpha-Linolenic Acid, Elevates Plasma Adiponectin Concentration and Prevents Pressure Overload Induced Ventricular Dysfunction and Remodeling. Circulation. 2008, 118: S542-S542.
Cited by
Sorted by citations
Fish oil–derived n−3 PUFA therapy increases muscle mass and function in healthy older adults
Smith, G. I., Julliand, S., Reeds, D. N., Sinacore, D. R., Klein, S., & Mittendorfer, B. (2015) · The American Journal of Clinical Nutrition · doi:10.3945/ajcn.114.105833 · Cited by 507
Omega-3 Polyunsaturated Fatty Acids: Benefits and Endpoints in Sport
Gammone, M. A., Riccioni, G., Parrinello, G., & D’Orazio, N. (2018) · Nutrients · doi:10.3390/nu11010046 · Cited by 326
Conjugated Linoleic Acid: Potential Health Benefits as a Functional Food Ingredient
Kim, J. H., Kim, Y., Kim, Y. J., & Park, Y. (2016) · Annual Review of Food Science and Technology · doi:10.1146/annurev-food-041715-033028 · Cited by 244
Omega-3 Fatty Acids and Skeletal Muscle Health
Jeromson, S., Gallagher, I., Galloway, S., & Hamilton, D. (2015) · Marine Drugs · doi:10.3390/md13116977 · Cited by 203
Lehnen, T. E., da Silva, M. R., Camacho, A., Marcadenti, A., & Lehnen, A. M. (2015) · Journal of the International Society of Sports Nutrition · doi:10.1186/s12970-015-0097-4 · Cited by 167
Metadata
- Authors
- Vaughan, R. A., Garcia-Smith, R., Bisoffi, M., Conn, C. A., & Trujillo, K. A.
- Affiliations
- University of New Mexico (US)
- Corresponding author
- Vaughan, Roger A
- Venue
- Lipids in Health and Disease
- Published
- 2012-10-30
- Volume
- 11
- Issue
- 1
- Pages
- 142-142
- ISSN
- 1476-511X (ISSN-L)
- PMC
- PMC3515476
- OpenAlex
- W2117258334
- Cited by
- 112
- References
- 48
- Citations by year
- 2026: 1 · 2025: 7 · 2024: 4 · 2023: 9 · 2022: 8 · 2021: 6 · 2020: 11 · 2019: 5 · 2018: 9 · 2017: 10 · 2016: 13 · 2015: 12 · 2014: 10 · 2013: 6 · 2012: 1
- FWCI
- 8.66
- Type
- journal article
- Language
- en
- Open access
- gold
- doi.org
- Licence
- Locations
- Lipids in Health and Disease (publishedVersion, cc-by)
- PubMed Central (publishedVersion, cc-by)
- PubMed (publishedVersion)
- DOAJ (DOAJ: Directory of Open Access Journals) (submittedVersion)
- Topics
- Health Sciences › Nursing › Nutrition and Dietetics › Fatty Acid Research and Health
- Health Sciences › Medicine › Physiology (medical) › Adipose Tissue and Metabolism
- Life Sciences › Biochemistry, Genetics and Molecular Biology › Molecular Biology › Mitochondrial Function and Pathology
- Keywords
- conjugated linoleic acid, omega-3 fatty acids, mitochondrial biogenesis, skeletal muscle metabolism, rhabdomyosarcoma cells, glycolysis, oxidative metabolism, extracellular acidification, oxygen consumption, polyunsaturated fatty acids, dietary supplements
- MeSH terms
- Peroxisome Proliferator-Activated Receptor Gamma Coactivator 1-alpha, Base Sequence, DNA, Fibronectins, Glycolysis, Heat-Shock Proteins, Humans, Mitochondria, Muscle, Oxygen Consumption, Transcription Factors, Tumor Cells, Cultured, Fatty Acids, Omega-3, Gene Expression, Muscle Fibers, Skeletal, Dietary Supplements, Linoleic Acids, Conjugated, Glucose Transporter Type 4
About these checks
Registry, retraction, Cites and statistics results are computed, not judged, with one exception: a printed reference that no index lists is read once by a model before it counts as a citation error. Claims are extracted by a model and kept only when their quote appears verbatim in the text; each cited source is then checked, with a model’s help, for whether it says what the claim relies on. Those verdicts can be wrong — read the claim’s quote and the cited source before relying on one.
Statistics and arithmetic are recomputed, not judged.
Confidence bands are shown only for fields calibrated on our annotated test set. None is calibrated yet, so no band is shown.
What counts as a claim ›How we measure confidence ›How we check this ›
Are you an author, or do you see a problem with this page? Request a review
