

The DOI matches its Crossref record; 53 of the 54 references it cites were found in a registry or an index.
The resistance of intracellular mediators to doxorubicin and cisplatin are distinct in 3D and 2D endometrial cancer
Open accessAbstract
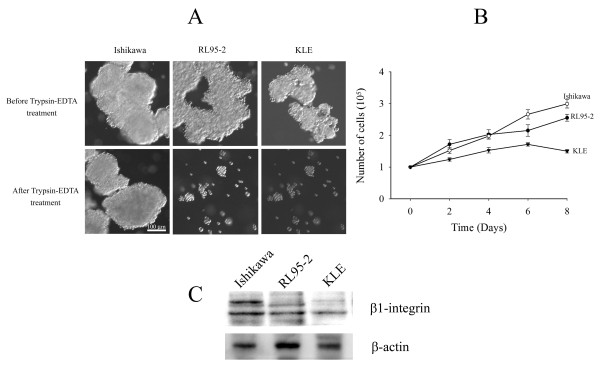
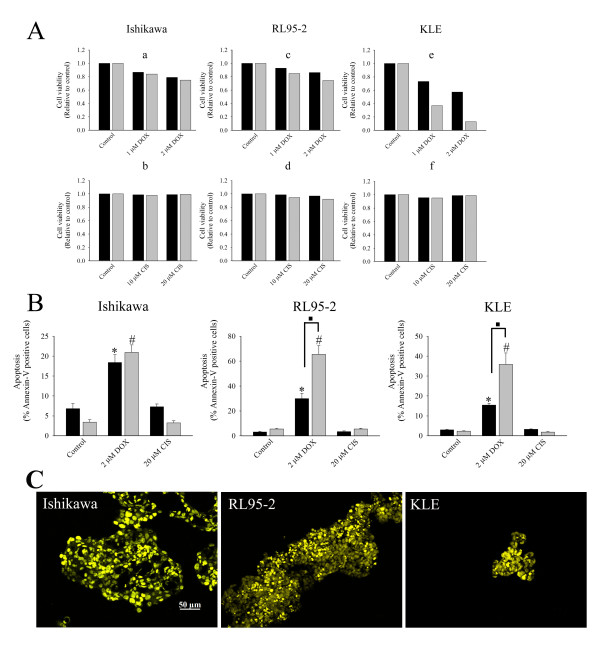
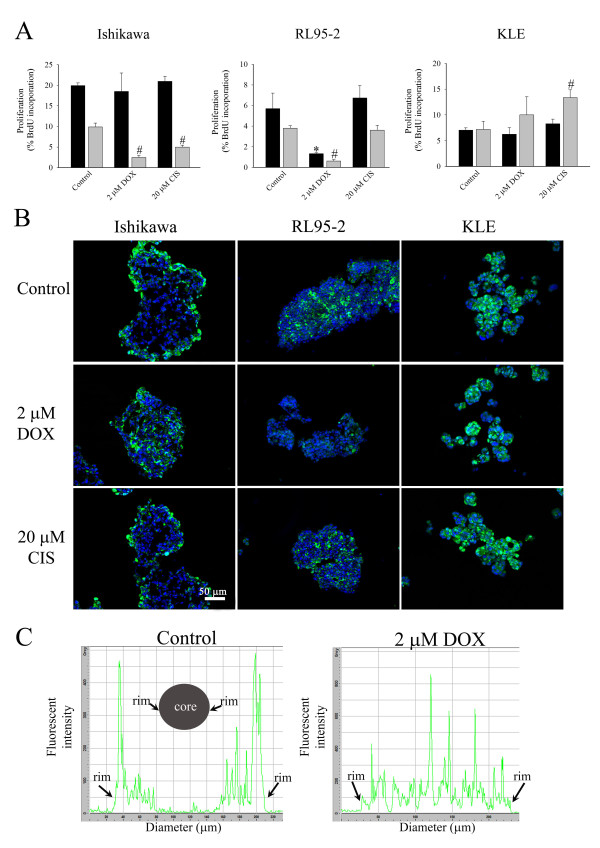
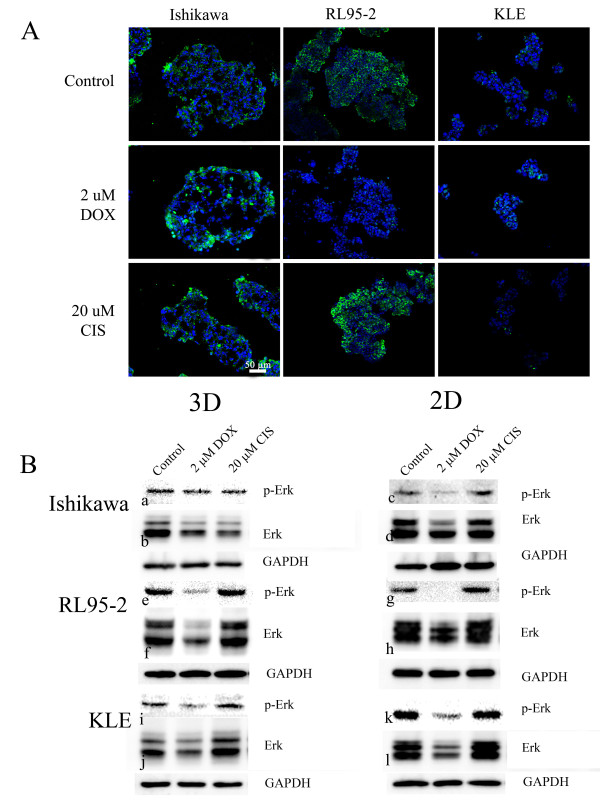
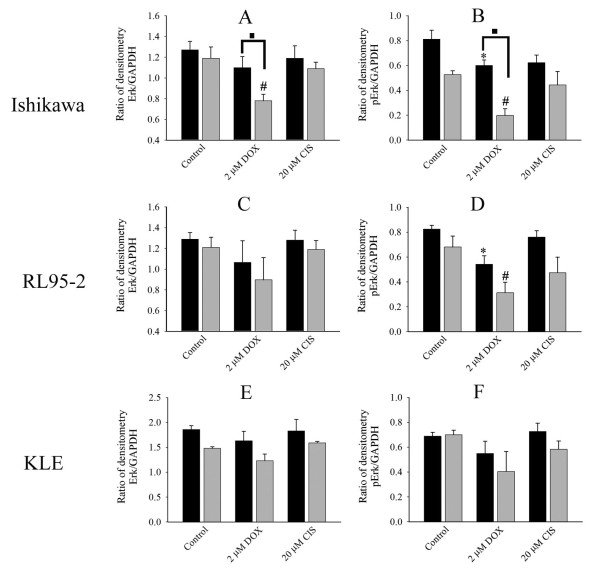
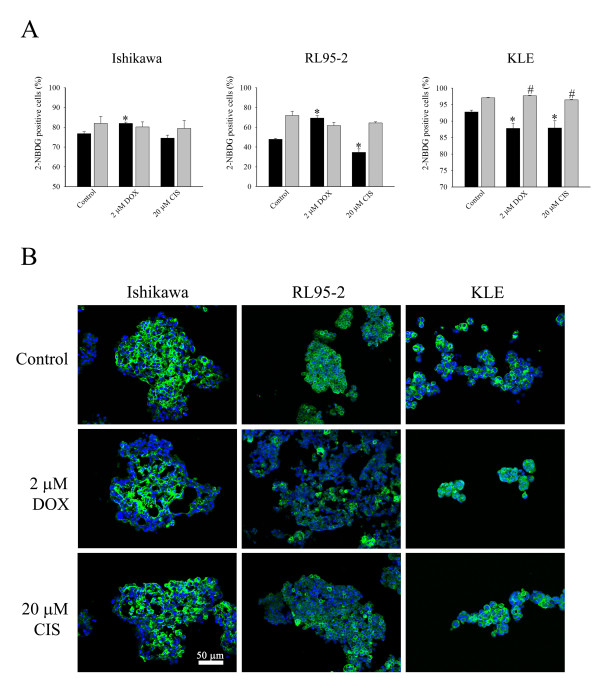
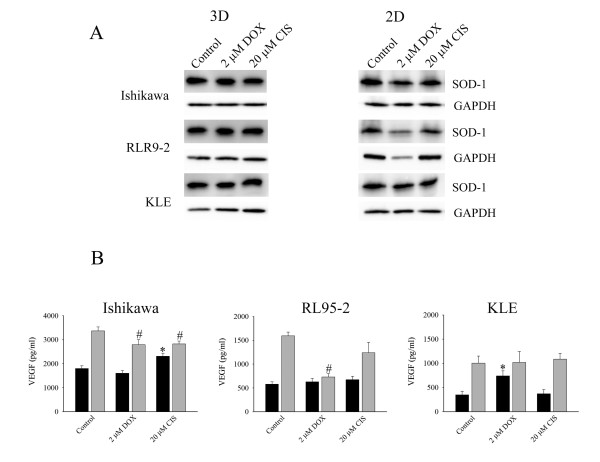
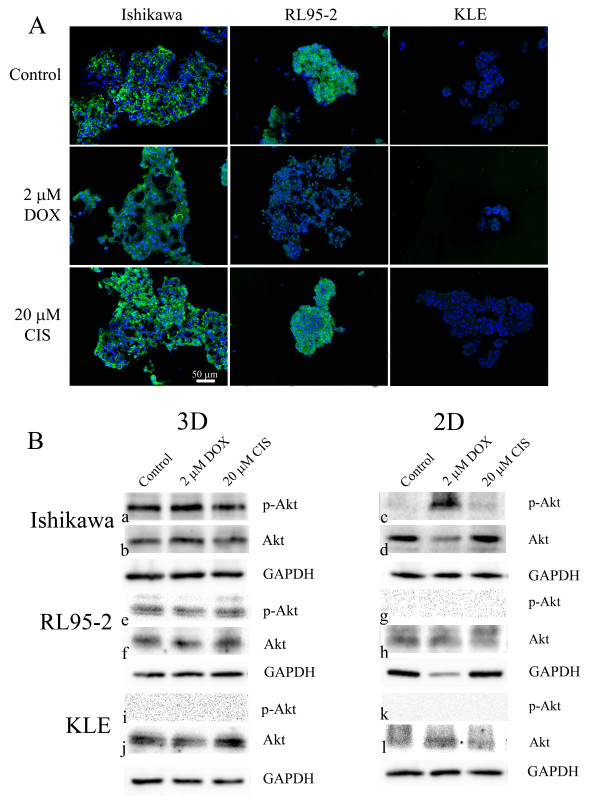
BACKGROUND: Advanced endometrial cancer often shows resistance to clinical chemotherapy although potencies of anticancer drugs in vitro are promising. The disparity suggests that in vivo microenvironments are not recapitulated by in vitro models used for preclinical testing. However, spheroids replicate some important properties of tumours in vivo. Therefore, for the first time, we compared effects of doxorubicin and cisplatin on 3D multicellular structures and 2D cell monolayers of endometrial cancer cells. METHODS: 3D multicellular structures were generated by culturing cancer cells on non-adherent surfaces; and for comparison cell monolayers were cultured on adherent culture plates. Ishikawa, RL95-2, and KLE cell lines were studied. Morphologies of 3D multicellular structures were examined. After 48 hours treatment with anticancer drugs, apoptosis, proliferation, glucose metabolism and vascular endothelial growth factor (VEGF) were analysed. Immunostaining of PCNA, Glut-1, p-Erk1/2, SOD-1 and p-Akt1/2/3 was also performed. RESULTS: Distinct 3D multicellular morphologies were formed by three different endometrial cancer cell lines. Doxorubicin induced less apoptosis in 3D multicellular structures of high grade cancer cells (RL95-2 and KLE cell lines) than in cell monolayers. Parallel alterations in Erk1/2 phosphorylation and cell proliferation might suggest they were linked and again doxorubicin had less effect on 3D multicellular structures than cell monolayers. On the other hand, there was no correlation between altered glucose metabolism and proliferation. The responses depended on cancer cell lines and were apparently not mediated by altered Glut-1 levels. The level of SOD-1 was high in 3D cell cultures. The effects on VEGF secretion were various and cancer cell line dependent. Importantly, both doxorubicin and cisplatin had selective paradoxical stimulatory effects on VEGF secretion. The microenvironment within 3D multicellular structures sustained Akt phosphorylation, consistent with it having a role in anchorage-independent pathways. CONCLUSIONS: The cancer cells responded to microenvironments in a distinctive manner. 3D multicellular structures exhibited greater resistance to the agents than 2D monolayers, and the differences between the culture formats were dependent on cancer cell lines. The effects of anticancer drugs on the intracellular mediators were not similar in 3D and 2D cultures. Therefore, using 3D cell models may have a significant impact on conclusions derived from screening drugs for endometrial carcinomas.
Overview
The claims and statistics of this paper haven’t been checked yet.
Run the check — free, no account needed. It reads the open-access text and checks the sources it cites.
Integrity signals
Registry
Cites
Statistics
Figures
Verification
Claims the paper makes
The claims and statistics of this paper haven’t been checked yet.
Run the check — free, no account needed. It reads the open-access text and checks the sources it cites.
Claims other papers make about this one
Each is checked against this paper’s own text: does it say what the citing paper says it does?
The source backs part of the claim, not all of it — or backs it for a different population, condition or comparison.
In the citing paper
“The proliferation rates of cells cultured in 3D and 2D are usually different, and are cell line and matrix dependent.”
From Three-dimensional cell culture systems and their applications in drug discovery and cell-based biosensors (2014) · cites this paper as [27]
Experimental — accuracy not yet measuredThe source backs part of the claim, not all of it — or backs it for a different population, condition or comparison.
In the citing paper
“Chitcholtan et al . found that regions of hypoxia may exist due to lack of a transport system to remove waste from the center of the spheroid. 27”
From Three-dimensional cell culture systems and their applications in drug discovery and cell-based biosensors (2014) · cites this paper as [27]
Experimental — accuracy not yet measuredThe cited source says what the claim attributes to it.
In the citing paper
“Chitcholtan et al . observed the same pattern to a lesser degree with doxorubicin and KLE endometrial cells. 27”
From Three-dimensional cell culture systems and their applications in drug discovery and cell-based biosensors (2014) · cites this paper as [27]
The check wasn’t confident either way, so it gives no verdict — never disputed.
In the citing paper
“A variety of cell lines showed reduced proliferation rate in 3D cultures compared to those cultured in 2D. 17,27-31”
From Three-dimensional cell culture systems and their applications in drug discovery and cell-based biosensors (2014) · cites this paper as [27]
Experimental — accuracy not yet measured
Self-check
Percentages, sums and reported differences re-computed from the paper’s own numbers.
The self-check needs the paper’s full text.
Citations
Cites
1 retracted
Retraction: TGFbeta1 activates c-Jun and Erk1 via alphaVbeta6 integrin.
Luettich, K., & Schmidt, C. (2004) · Molecular Cancer · doi:10.1186/1476-4598-3-1 · Cited by 70
RetractedDrug penetration in solid tumours
Minchinton, A. I., & Tannock, I. F. (2006) · Nature reviews. Cancer · doi:10.1038/nrc1893 · Cited by 2,805
Majumder, P. K., Febbo, P. G., Bikoff, R., Berger, R., Xue, Q., McMahon, L. M., Manola, J., Brugarolas, J., McDonnell, T. J., Golub, T. R., et al. (2004) · Nature Medicine · doi:10.1038/nm1052 · Cited by 964
Engineering tumors with 3D scaffolds
Fischbach, C., Chen, R., Matsumoto, T., Schmelzle, T., Brugge, J. S., Polverini, P. J., & Mooney, D. J. (2007) · Nature Methods · doi:10.1038/nmeth1085 · Cited by 834
Rapid Generation of Single-Tumor Spheroids for High-Throughput Cell Function and Toxicity Analysis
Ivascu, A., & Kubbies, M. (2006) · SLAS DISCOVERY · doi:10.1177/1087057106292763 · Cited by 618
Epidemiology of Endometrial Cancer 2
Elwood, M., Cole, P. T., Rothman, K. J., & Kaplan, S. D. (1977) · JNCI Journal of the National Cancer Institute · doi:10.1093/jnci/59.4.1055 · Cited by 430
The epidemiology of endometrial cancer
Parazzini, F., Vecchia, C. L., Bocciolone, L., & Franceschi, S. (1991) · Gynecologic Oncology · doi:10.1016/0090-8258(91)90246-2 · Cited by 399
Dynamic analysis of hepatoma spheroid formation: roles of E-cadherin and β1-integrin
Lin, R.-Z., Chou, L.-F., Chien, C.-C. M., & Chang, H.-Y. (2006) · Cell and Tissue Research · doi:10.1007/s00441-005-0148-2 · Cited by 305
Sodek, K. L., Ringuette, M. J., & Brown, T. J. (2009) · International Journal of Cancer · doi:10.1002/ijc.24188 · Cited by 248
Oxygenation and differentiation in multicellular spheroids of human colon carcinoma.
Sutherland, R. M., Sordat, B., Bamat, J., Gabbert, H. E., Bourrat, B., & Mueller‐Klieser, W. (1986) · PubMed · Cited by 237
Cited by
Sorted by citations
Items 101–148 of 148
High-content morphological profiling by Cell Painting in 3D spheroids
Ringers, C., Holmberg, D., Larsson, A., Jung, B., Jarvius, M., Łuchniak, A., Rosén, D., Johansson, M., Georgiev, P., Seashore-Ludlow, B. A., et al. (2026) · Nature Communications · doi:10.1038/s41467-026-78596-5 · Cited by 7
Koshkin, V., de Oliveira, M. B., Peng, C., Ailles, L., Liu, G., Covens, A. L., & Krylov, S. N. (2020) · Analytical Chemistry · doi:10.1021/acs.analchem.0c01667 · Cited by 5
Almutary, A. G., Alnuqaydan, A. M., Almatroodi, S. A., Bakshi, H. A., Chellappan, D. K., & Tambuwala, M. M. (2023) · Biomimetics · doi:10.3390/biomimetics8010041 · Cited by 5
Habibi, E., Sepehrara, A., Arabnozari, H., Sharifianjazi, F., Enderami, S. E., Sarker, S. D., Hassannia, H., & Nahar, L. (2024) · Journal of Agriculture and Food Research · doi:10.1016/j.jafr.2024.101438 · Cited by 5
Savic, L. J., Schobert, I. T., Hamm, C. A., Adam, L. C., Hyder, F., & Coman, D. (2020) · NMR in Biomedicine · doi:10.1002/nbm.4465 · Cited by 5
A multidimensional biosensor system to guide LUAD individualized treatment
Jiang, D., Shi, Y., Qiu, Y. L., Liu, X., Zhu, Y., Liu, J., Pan, Y., Wan, H., Ying, K., & Wang, P. (2021) · Journal of Materials Chemistry B · doi:10.1039/d1tb00731a · Cited by 5
Cadena, I., Rowlands, C. E., Buchanan, M. R., Jenne, M., Keefe, B., Almer, A., Obasi, N., Harris, C. G., Rochefort, W. E., Givens, B. E., et al. (2024) · bioRxiv (Cold Spring Harbor Laboratory) · doi:10.1101/2024.02.20.581239 · Cited by 5
Three-dimensional tumor model and their implication in drug screening for tackling chemoresistance
Priyadarshini, M., Mohanty, S., Mahapatra, T., Mohapatra, P., & Dash, R. (2020) · Elsevier eBooks · doi:10.1016/b978-0-12-818128-7.00020-4 · Cited by 3
Mammalian Cell Culture in Three Dimensions: Basic Guidelines
Malik, P., & Mukherjee, T. K. (2023) · Springer eBooks · doi:10.1007/978-981-19-1731-8_13-1 · Cited by 3
Kiełbasiński, R., Kieszkowski, P., Grabarek, B. O., & Boroń, D. (2020) · Current Pharmaceutical Biotechnology · doi:10.2174/1389201021666200506074523 · Cited by 2
Sumer‐Bayraktar, Z., Fife, C. M., Byrne, F. L., Kavallaris, M., & Packer, N. H. (2022) · Glycobiology · doi:10.1093/glycob/cwac016 · Cited by 2
Ferretti, L., Moccia, V., Centelleghe, C., Venerando, A., Dettin, M., Sieni, E., Zamuner, A., Caicci, F., Castagnaro, M., Zappulli, V., et al. (2024) · PLoS ONE · doi:10.1371/journal.pone.0304992 · Cited by 2
Cancer diagnosis and therapy by electrospun nanofibers: Opportunities and challenges
Nazarnezhad, S., Gorgani, S., & Kargozar, S. (2024) · Elsevier eBooks · doi:10.1016/b978-0-323-85661-4.00013-5 · Cited by 2
Culture and Co-culture of Cells for Multi-organ on a Chip
Arathi, A., Joseph, X., Megha, K. B., Akhil, V., & Mohanan, P. V. (2022) · Springer eBooks · doi:10.1007/978-981-19-1379-2_9 · Cited by 2
Comparison of the Effect of Platinum (IV) Complexes on Spheroids and Monolayer Culture of HeLa Cells
Trigub, М. М., Filatova, N. V., Areshidze, D. A., Sen', V. D., & Terentiev, A. A. (2020) · Bulletin of Experimental Biology and Medicine · doi:10.1007/s10517-020-04757-1 · Cited by 2
Spatial and nonspatial evolutionary games and their applications
You, Y. (2018) · doi:10.26481/dis.20180207yl · Cited by 2
Using Tumor-Like Spheroids to Study the Effect of Anti-Cancer Drugs In Vitro
Alam, Y., Borowicz, P., Vetter, S. W., & Leclerc, E. (2023) · Biochemistry · doi:10.5772/intechopen.113857 · Cited by 1
Applications of cell culture studies in pharmaceutical technology
Tekarslan-Sahin, S. H., Mesut, B., & Özsoy, Y. (2017) · ACTA Pharmaceutica Sciencia · doi:10.23893/1307-2080.aps.05519 · Cited by 1
Blood–Brain Barrier in Disease States
Dadas, A., Washington, J., Marchi, N., & Janigro, D. (2019) · Elsevier eBooks · doi:10.1016/b978-0-12-813997-4.00002-5 · Cited by 1
Gelatin Sponge as an Anchorage for Three-dimensional Culture of Colorectal Cancer Cells
Koyama, M., Osada, E., TAKEMURA, Y., Saito, H., Kikuchi, E., Nomura, M., Sugimitsu, K., Akiyama, N., Kuwata, G., Ikeda, K., et al. (2021) · Anticancer Research · doi:10.21873/anticanres.15230 · Cited by 1
Culturing Mouse Tumor CellsPreprint
Rhim, A. D., Jechlinger, M., & Rustgi, A. K. (2015) · Cold Spring Harbor Protocols · doi:10.1101/pdb.top069989 · Cited by 1
An investigation of the antifungal and antitumor activity of ajoene
Yang, M. (2013) · UC Research Repository (University of Canterbury) · doi:10.26021/6476
Effects of the Physical Microenvironment on Endometrial Cancer Cells (Ishikawa)
Tan, L. H. (2016) · Otago University Research Archive (University of Otago)
The role of receptor tyrosine kinase EphB4 in the tumorigenesis of endometrial cancer
Lin, C. (2016) · The University of Queensland · doi:10.14264/uql.2016.973
Three-Dimensional Cell Culture at the Frontiers of in Vitro Cancer Research: Present Perspectives
Soo, L. L., Zainal, A. A., Hidetsugu, T., Takabatake, K., Nakano, K., Chai, W. L., Nagatsuka, H., & Siar, C. H. (2016) · Annals of Dentistry · doi:10.22452/adum.vol23no1.1
Single and Multiphoton Responsive Nanomaterials for the Investigation of Cancer Microenvironment
Li, Y., Lee, C., Wang, Y.-C., Huang, C.-C., & Liu, T. (2018) · Elsevier eBooks · doi:10.1016/b978-0-12-813339-2.00003-7
Development of 3D cancer models and targeted fluorescent gold nanoclusters
Dashtarzheneh, A. K. (2018) · UCL Discovery (University College London)
A Doctrine of Ovarian Cancer Translational Research Needs Revisiting
Sarwar, M., Sykes, P. H., & Evans, J. J. (2020) · International Journal of Cancer Management · doi:10.5812/ijcm.105436
Self-citationdo Amaral, R. L. F. (2020) · Digital Library of Theses and Dissertations (Universidade de São Paulo) · doi:10.11606/t.60.2020.tde-21092021-055958
Simplified One-stop Protocols to Extract Collagen from Various Animal Tissues for 3D Cell CulturesPreprint
Terrell, J. A., & Chen, C. (2020) · ChemRxiv · doi:10.26434/chemrxiv.13011536.v1
Krylov, S. N., Koshkin, V., de Oliveira, M. B., Peng, C., Ailles, L., Liu, G., & Covens, A. L. (2020) · ChemRxiv · doi:10.26434/chemrxiv.12152016
Simplified One-stop Protocols to Extract Collagen from Various Animal Tissues for 3D Cell CulturesPreprint
Terrell, J. A., & Chen, C. (2020) · ChemRxiv · doi:10.26434/chemrxiv.13011536
(2018) · Translational Sports Medicine · doi:10.1002/tsm2.17
Uterine Tumors and the Environment
Yang, S., Parra-Forero, L. Y., Andrus, A. R., Sexton, C. N., Kuang, D., & Nowak, R. A. (2025) · Elsevier eBooks · doi:10.1016/b978-0-323-95488-4.00256-4
TRIM19 enhances the chemosensitivity of endometrial cancer by regulating the TBX2/NRF2 axis
Ding, N., Li, Y., & Yu, X. (2025) · Discover Oncology · doi:10.1007/s12672-025-02717-7
3D bioprinting technology in cancer management: Applications, challenges, and future perspectives
Nandy, B. C., Dutta, S., Banerjee, B., & Mondal, A. (2025) · Elsevier eBooks · doi:10.1016/b978-0-443-26518-1.00010-0
Magnetic Nanoparticle-Induced Cell 3D Magnetic Levitation Culture and Drug Evaluation Study
Zhao, T., Yan, M., Wu, Y., Wang, F., Wu, H., Ma, M., & Zhang, Y. (2025) · ACS Applied Nano Materials · doi:10.1021/acsanm.5c02554
Additional file 3 of Scaffold-mediated switching of lymphoma metabolism in culture
Bhatt, R., Ravi, D., Evens, A. M., & Parekkadan, B. (2022) · Figshare · doi:10.6084/m9.figshare.21321439
Additional file 2 of Scaffold-mediated switching of lymphoma metabolism in culture
Bhatt, R., Ravi, D., Evens, A. M., & Parekkadan, B. (2022) · Figshare · doi:10.6084/m9.figshare.21321436
Additional file 1 of Scaffold-mediated switching of lymphoma metabolism in culture
Bhatt, R., Ravi, D., Evens, A. M., & Parekkadan, B. (2022) · Figshare · doi:10.6084/m9.figshare.21321433
3D-Cell Culture Systems: Current State
Ivashchenko, I. A., Wasielewski, W., Fedotova, O. S., Слаутин, В. Н., & Semenov, А. V. (2025) · Applied Biochemistry and Microbiology · doi:10.1134/s0003683825700449
The Use of Organoids in Dentistry: An Overview of New Research Approaches
Wadan, A. S., El‑Sadek, M. Z., Shaaban, A. H., Abdeldayem, K. N. E., Ahmed, A. H., Ahmed, M. A., Elsonpaty, H. S. A., Tawfik, A., Nabih, M. T., Elmesalamy, N., et al. (2026) · Regenerative Engineering and Translational Medicine · doi:10.1007/s40883-025-00541-7
Dubois, C. (2018) · theses.fr (ABES) · doi:10.70675/b6bf4c88z2782z442eza7fbz5facbc90936e
Martin, E., Bessaguet, F., & Clere, N. (2026) · Pharmacological Research · doi:10.1016/j.phrs.2026.108465
Organoids: Current Applications and Future Directions
Leng, Y., Wang, Y., Cao, C., Deng, F., Lian, W., Chen, X., Lin, M., Zeng, Z., Mo, D., Li, S., et al. (2026) · MedComm · doi:10.1002/mco2.70965
Metadata
- Authors
- Chitcholtan, K., Sykes, P. H., & Evans, J. J.
- Affiliations
- University of Otago (NZ)
- Christchurch Hospital (NZ)
- Corresponding author
- Chitcholtan, Kenny
- Venue
- Journal of Translational Medicine
- Published
- 2012-03-06
- Volume
- 10
- Issue
- 1
- Pages
- 38-38
- ISSN
- 1479-5876 (ISSN-L)
- PMC
- PMC3316127
- OpenAlex
- W2169461456
- Cited by
- 148
- References
- 54
- Citations by year
- 2026: 4 · 2025: 8 · 2024: 6 · 2023: 7 · 2022: 16 · 2021: 7 · 2020: 16 · 2019: 11 · 2018: 14 · 2017: 16 · 2016: 13 · 2015: 7 · 2014: 8 · 2013: 13 · 2012: 2
- FWCI
- 4.74
- Type
- journal article
- Language
- en
- Open access
- gold
- doi.org
- Licence
- Locations
- Journal of Translational Medicine (publishedVersion, cc-by)
- Europe PMC (PubMed Central) (publishedVersion, cc-by)
- PubMed Central (publishedVersion, cc-by)
- PubMed (publishedVersion)
- DOAJ (DOAJ: Directory of Open Access Journals) (submittedVersion)
- Topics
- Health Sciences › Medicine › Oncology › Cancer Cells and Metastasis
- Life Sciences › Biochemistry, Genetics and Molecular Biology › Cancer Research › Cancer, Hypoxia, and Metabolism
- Health Sciences › Medicine › Obstetrics and Gynecology › Endometrial and Cervical Cancer Treatments
- Keywords
- endometrial cancer, doxorubicin, cisplatin, chemoresistance, multicellular spheroids, tumor microenvironment, apoptosis, glucose metabolism, VEGF secretion, Akt phosphorylation, ERK1/2 phosphorylation, SOD1, anchorage-independent growth, cancer cell lines, Ishikawa
- MeSH terms
- Antioxidants, Cell Survival, Cisplatin, Densitometry, Deoxyglucose, Doxorubicin, Female, Glucose, Humans, 4-Chloro-7-nitrobenzofurazan, Phosphorylation, Superoxide Dismutase, Tumor Cells, Cultured, Endometrial Neoplasms, Apoptosis, Spheroids, Cellular, Drug Resistance, Neoplasm, Integrin beta1, Vascular Endothelial Growth Factor A, Intracellular Space, Tissue Culture Techniques, Extracellular Signal-Regulated MAP Kinases, Cell Proliferation, Proto-Oncogene Proteins c-akt, Glucose Transporter Type 1
About these checks
Registry, retraction, Cites and statistics results are computed, not judged, with one exception: a printed reference that no index lists is read once by a model before it counts as a citation error. Claims are extracted by a model and kept only when their quote appears verbatim in the text; each cited source is then checked, with a model’s help, for whether it says what the claim relies on. Those verdicts can be wrong — read the claim’s quote and the cited source before relying on one.
Statistics and arithmetic are recomputed, not judged.
Confidence bands are shown only for fields calibrated on our annotated test set. None is calibrated yet, so no band is shown.
What counts as a claim ›How we measure confidence ›How we check this ›
Are you an author, or do you see a problem with this page? Request a review
