

The DOI matches its Crossref record; 69 of the 70 references it cites were found in a registry or an index.
Poly(ADP-ribose)polymerase-1 modulates microglial responses to amyloid β
Open accessAbstract
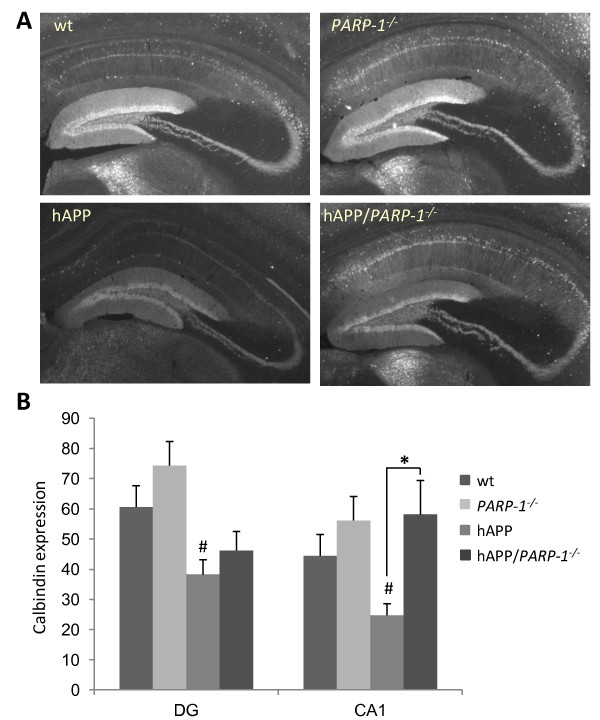
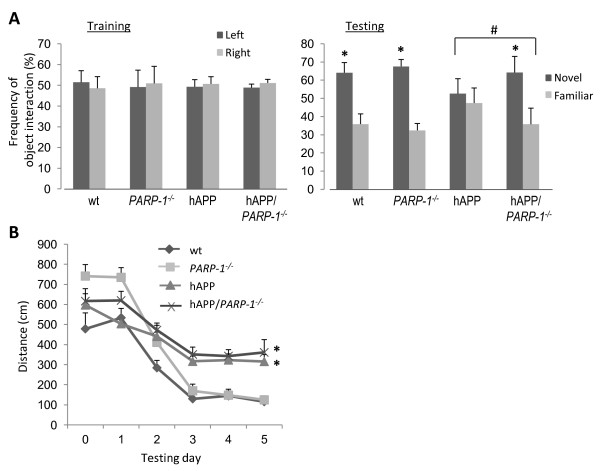
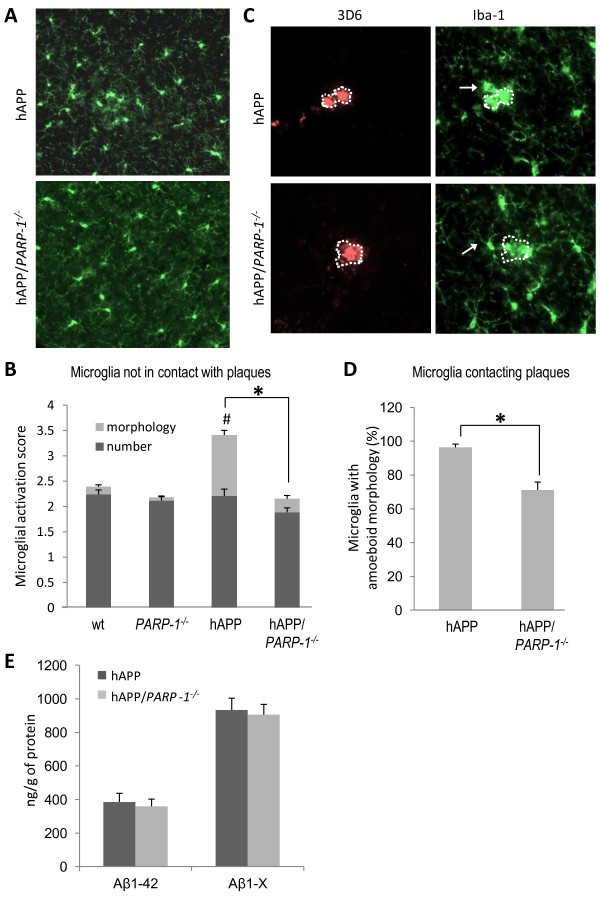
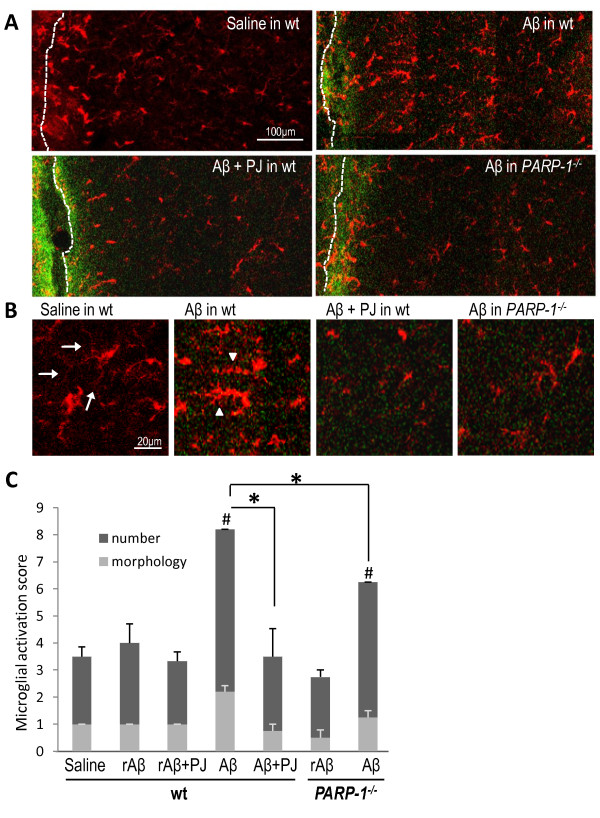
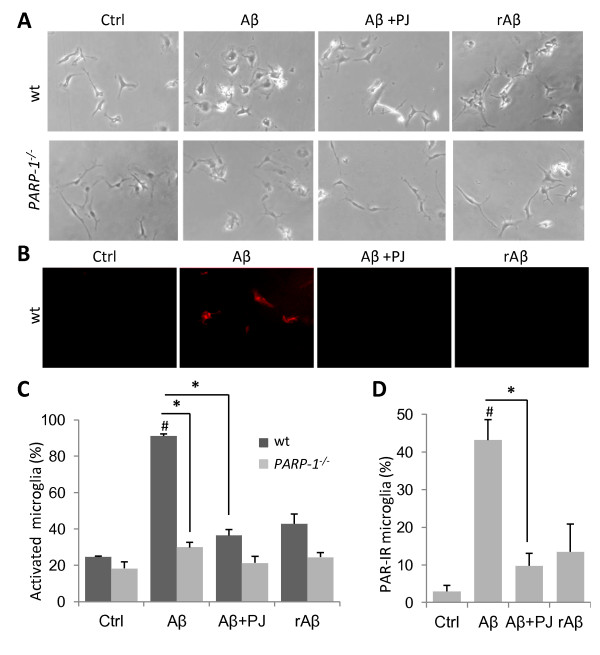
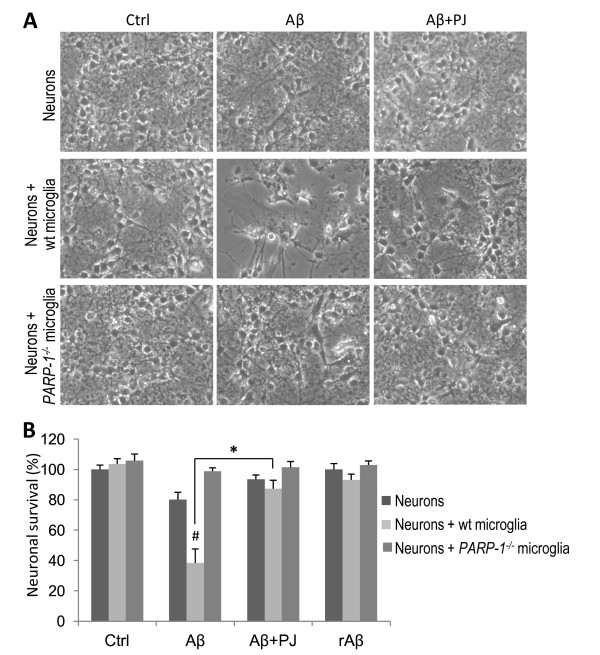
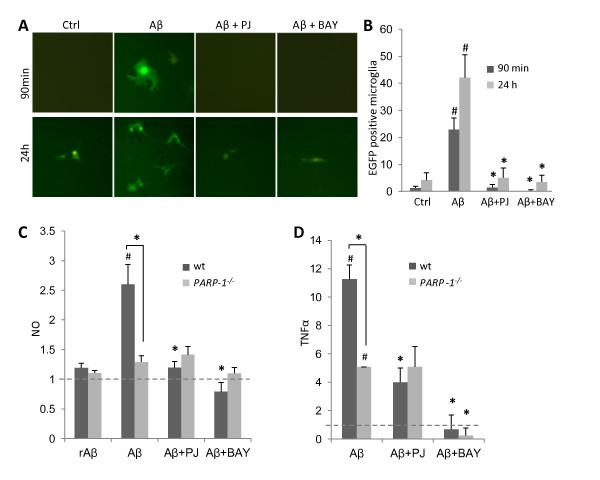
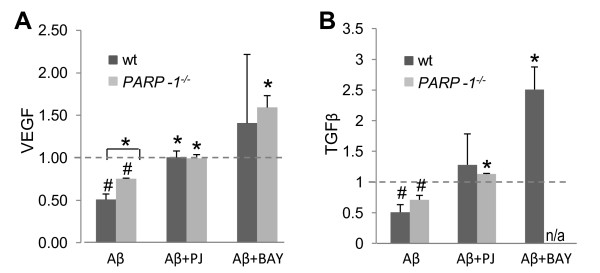
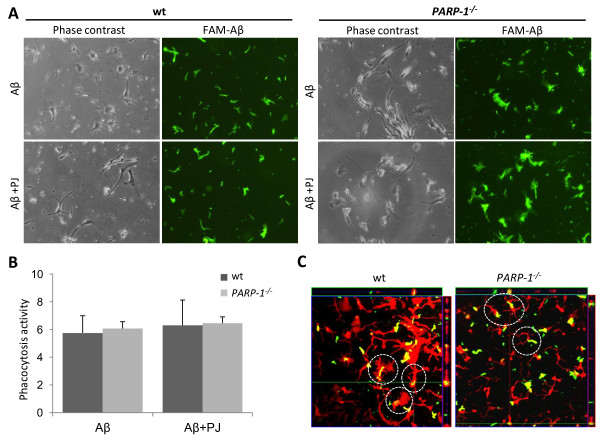
BACKGROUND: Amyloid β (Aβ) accumulates in Alzheimer's disease (AD) brain. Microglial activation also occurs in AD, and this inflammatory response may contribute to disease progression. Microglial activation can be induced by Aβ, but the mechanisms by which this occurs have not been defined. The nuclear enzyme poly(ADP-ribose) polymerase-1 (PARP-1) regulates microglial activation in response to several stimuli through its interactions with the transcription factor, NF-κB. The purpose of this study was to evaluate whether PARP-1 activation is involved in Aβ-induced microglial activation, and whether PARP-1 inhibition can modify microglial responses to Aβ. METHODS: hAPP(J20) mice, which accumulate Aβ with ageing, were crossed with PARP-1(-/-) mice to assess the effects of PARP-1 depletion on microglial activation, hippocampal synaptic integrity, and cognitive function. Aβ peptide was also injected into brain of wt and PARP-1(-/-) mice to directly determine the effects of PARP-1 on Aβ-induced microglial activation. The effect of PARP-1 on Aβ-induced microglial cytokine production and neurotoxicity was evaluated in primary microglia cultures and in microglia-neuron co-cultures, utilizing PARP-1(-/-) cells and a PARP-1 inhibitor. NF-κB activation was evaluated in microglia infected with a lentivirus reporter gene. RESULTS: The hAPP(J20) mice developed microglial activation, reduced hippocampal CA1 calbindin expression, and impaired novel object recognition by age 6 months. All of these features were attenuated in hAPP(J20)/PARP-1(-/-) mice. Similarly, Aβ(1-42) injected into mouse brain produced a robust microglial response in wild-type mice, and this was blocked in mice lacking PARP-1 expression or activity. Studies using microglial cultures showed that PARP-1 activity was required for Aβ-induced NF-κB activation, morphological transformation, NO release, TNFα release, and neurotoxicity. Conversely, PARP-1 inhibition increased release of the neurotrophic factors TGFβ and VEGF, and did not impair microglial phagocytosis of Aβ peptide. CONCLUSIONS: These results identify PARP-1 as a requisite and previously unrecognized factor in Aβ-induced microglial activation, and suggest that the effects of PARP-1 are mediated, at least in part, by its interactions with NF-κB. The suppression of Aβ-induced microglial activation and neurotoxicity by PARP-1 inhibition suggests this approach could be useful in AD and other disorders in which microglial neurotoxicity may contribute.
Overview
The claims and statistics of this paper haven’t been checked yet.
Run the check — free, no account needed. It reads the open-access text and checks the sources it cites.
Integrity signals
Registry
Cites
Statistics
Figures
Verification
Claims the paper makes
The claims and statistics of this paper haven’t been checked yet.
Run the check — free, no account needed. It reads the open-access text and checks the sources it cites.
Claims other papers make about this one
Each is checked against this paper’s own text: does it say what the citing paper says it does?
In the citing paper
“In vivo studies using various Alzheimer disease and Parkinson disease models have shown that loss of PARP1 protects from brain dysfunctions and cognitive decline170–174.”
From NAD+ metabolism and its roles in cellular processes during ageing (2021) · cites this paper as [170]
In the citing paper
“PARP1 activation is also associated with Alzheimer disease170,171 and Parkinson disease172,173 pathogenesis.”
From NAD+ metabolism and its roles in cellular processes during ageing (2021) · cites this paper as [170]
In the citing paper
“can mediate neuroinflammatory activity in AD (Kauppinen et al, 2011)”
From Mechanisms of DNA damage-mediated neurotoxicity in neurodegenerative disease (2022) · cites this paper as Kauppinen et al, 2011
Self-check
Percentages, sums and reported differences re-computed from the paper’s own numbers.
The self-check needs the paper’s full text.
Citations
Cites
Measurement of protein using bicinchoninic acid
Smith, P. K., Krohn, R. I., Hermanson, G. T., Mallia, A. K., Gartner, F. H., Provenzano, M. D., Fujimoto, E. K., Goeke, N. M., Olson, B. J., & Klenk, D. C. (1985) · Analytical Biochemistry · doi:10.1016/0003-2697(85)90442-7 · Cited by 18,482
The Amyloid Hypothesis of Alzheimer’s Disease: Progress and Problems on the Road to Therapeutics
Hardy, J., & Selkoe, D. J. (2002) · Science · doi:10.1126/science.1072994 · Cited by 13,864
Function and Activation of NF-kappaB in the Immune System
Baeuerle, P. A., & Henkel, T. (1994) · Annual Review of Immunology · doi:10.1146/annurev.iy.12.040194.001041 · Cited by 4,745
Inflammation and Alzheimer’s disease
Akiyama, H. (2000) · Neurobiology of Aging · doi:10.1016/s0197-4580(00)00124-x · Cited by 4,514
Microglia: a sensor for pathological events in the CNS
Kreutzberg, G. W. (1996) · Trends in Neurosciences · doi:10.1016/0166-2236(96)10049-7 · Cited by 4,396
NF-κB regulation in the immune system
Li, Q., & Verma, I. M. (2002) · Nature Reviews Immunology · doi:10.1038/nri910 · Cited by 4,007
Microglial physiology: unique stimuli, specialized responses
Ransohoff, R. M., & Perry, V. H. (2009) · Annual Review of Immunology · doi:10.1146/annurev.immunol.021908.132528 · Cited by 1,858
Mucke, L., Masliah, E., Yu, G.-Q., Mallory, M., Rockenstein, E. M., Tatsuno, G., Hu, K., Kholodenko, D., Johnson-Wood, K., & McConlogue, L. (2000) · The Journal of Neuroscience · doi:10.1523/jneurosci.20-11-04050.2000 · Cited by 1,856
Amyloid-β–induced neuronal dysfunction in Alzheimer's disease: from synapses toward neural networks
Palop, J. J., & Mucke, L. (2010) · Nature Neuroscience · doi:10.1038/nn.2583 · Cited by 1,651
Simard, A. R., Soulet, D., Gowing, G., Julien, J.-P., & Rivest, S. (2006) · Neuron · doi:10.1016/j.neuron.2006.01.022 · Cited by 1,265
Cited by
Sorted by citations
Items 101–113 of 113
The interaction between microglial dysfunction and mitochondrial impairment in Alzheimer’s disease
Luo, Q., Noh, J. H., & Sima, J. (2023) · Aging Research · doi:10.26599/agr.2023.9340020 · Cited by 1
Recent advances in neurodegenerative disease research
Singh, E., & Dilawari, R. (2024) · Elsevier eBooks · doi:10.1016/b978-0-443-28822-7.00014-3 · Cited by 1
Daryani, S., Farzaei, A., Hosseinmardi, N., Bahrami, F., & Janahmadi, M. (2016)
Spinocerebellar Ataxia Type 7: From Mechanistic Pathways to Therapeutic Opportunities
Switonski, P. M., & Spada, A. R. L. (2023) · Contemporary clinical neuroscience · doi:10.1007/978-3-031-24345-5_17
Recent progress in the pathology, diagnosis, and treatment of Alzheimer’s disease
Yu, X. (2023) · Theoretical and Natural Science · doi:10.54254/2753-8818/21/20230827
Multifactorial microbial networks shape aging and neurodegeneration
Kara, N. Z., Savaliya, J. H., & Blacher, E. (2024) · Elsevier eBooks · doi:10.1016/b978-0-443-18979-1.00002-2
Necroptosis, Autophagy and Parthanatos in the Pathogenesis of Brain Diseases
Golushko, N. I., Martynov, D. D., Lebedev, A. S., Ilyin, N. P., Galstyan, D. S., & Kalueff, A. V. (2025) · Journal of Evolutionary Biochemistry and Physiology · doi:10.1134/s0022093025020085
Role and relation of cell death in Alzheimer’s disease
Hoang, D. A., Le, D. A., Do, T. M. H., & Than, V. T. (2025) · Progress in molecular biology and translational science · doi:10.1016/bs.pmbts.2025.06.024
Banjare, P., & Patel, R. (2026) · DNA repair · doi:10.1016/j.dnarep.2026.103940
Denaro, S., D’Aprile, S., Gervasi, A., Russo, V., Bellia, F., Giallongo, S., Lavoro, A., Candido, S., Braga, A., Gourine, A. V., et al. (2026) · Redox Biology · doi:10.1016/j.redox.2026.104268
Sun, C., Zhang, T., Fan, B., 张宪亮, & Zhao, N. (2026) · Frontiers in Immunology · doi:10.3389/fimmu.2026.1876444
Li, G., Antunes, I. F., Ming, Z., Wu, C., Cornelissen, B., & de Vries, E. F. J. (2026) · Neurotherapeutics · doi:10.1016/j.neurot.2026.e01044
Investigation of BACE1 as a stress-induced regulator of neuronal metabolism
Findlay, J. A. (2014) · Discovery Research Portal (University of Dundee)
Metadata
- Authors
- Kauppinen, T. M., Suh, S., Higashi, Y., Berman, A. E., Escartin, C., Won, S., Wang, C., Cho, S.-H., Gan, L., & Swanson, R. A.
- Affiliations
- San Francisco VA Medical Center (US)
- University of California, San Francisco (US)
- Corresponding author
- Kauppinen, Tiina M
- ORCID
- Venue
- Journal of Neuroinflammation
- Published
- 2011
- Volume
- 8
- Issue
- 1
- Pages
- 152
- ISSN
- 1742-2094 (ISSN-L)
- PMC
- PMC3247192
- OpenAlex
- W2147930131
- Cited by
- 112
- References
- 70
- Citations by year
- 2026: 7 · 2025: 6 · 2024: 10 · 2023: 11 · 2022: 9 · 2021: 13 · 2020: 8 · 2019: 3 · 2018: 9 · 2017: 8 · 2016: 5 · 2015: 6 · 2014: 6 · 2013: 6 · 2012: 4
- FWCI
- 3.01
- Type
- journal article
- Language
- en
- Open access
- gold
- doi.org
- Licence
- cc-by
- Locations
- Journal of Neuroinflammation (publishedVersion, cc-by)
- Europe PMC (PubMed Central) (publishedVersion, cc-by)
- PubMed Central (publishedVersion, cc-by)
- PubMed (publishedVersion)
- HAL (submittedVersion)
- DOAJ (DOAJ: Directory of Open Access Journals) (submittedVersion)
- Funders
- U.S. Department of Veterans Affairs
- American Heart Association (SDG 0835222N)
- National Institutes of Health
- University of California, San Francisco
- National Institute on Aging (R01AG030207, AG030207-A2, R21AG029483, AG029483)
- National Institute of Neurological Disorders and Stroke (NS 041421, R01NS041421)
- Topics
- Life Sciences › Neuroscience › Neurology › Neuroinflammation and Neurodegeneration Mechanisms
- Life Sciences › Neuroscience › Cellular and Molecular Neuroscience › Alzheimer's disease research and treatments
- Life Sciences › Neuroscience › Neurology › Neurological Disease Mechanisms and Treatments
- Keywords
- PARP1, amyloid-beta, microglial activation, Alzheimer's disease, NF-κB, PARP1 inhibition, neuroinflammation, neurotoxicity, cognitive impairment, TNF-α, nitric oxide, TGF-beta, vascular endothelial growth factor, microglia-neuron co-culture
- MeSH terms
- Poly (ADP-Ribose) Polymerase-1, Animals, Behavior, Animal, Cells, Cultured, Hippocampus, Memory, Mice, Inbred C57BL, Neurons, Phagocytosis, Poly(ADP-ribose) Polymerases, Cytokines, Amyloid beta-Peptides, NF-kappa B, Microglia, Mice, Knockout, Coculture Techniques, Mice, Calbindins, S100 Calcium Binding Protein G
About these checks
Registry, retraction, Cites and statistics results are computed, not judged, with one exception: a printed reference that no index lists is read once by a model before it counts as a citation error. Claims are extracted by a model and kept only when their quote appears verbatim in the text; each cited source is then checked, with a model’s help, for whether it says what the claim relies on. Those verdicts can be wrong — read the claim’s quote and the cited source before relying on one.
Statistics and arithmetic are recomputed, not judged.
Confidence bands are shown only for fields calibrated on our annotated test set. None is calibrated yet, so no band is shown.
What counts as a claim ›How we measure confidence ›How we check this ›
Are you an author, or do you see a problem with this page? Request a review
