

The DOI matches its Crossref record; 86 of the 86 references it cites were found in a registry or an index.
Classically and alternatively activated bone marrow derived macrophages differ in cytoskeletal functions and migration towards specific CNS cell types
Open accessAbstract
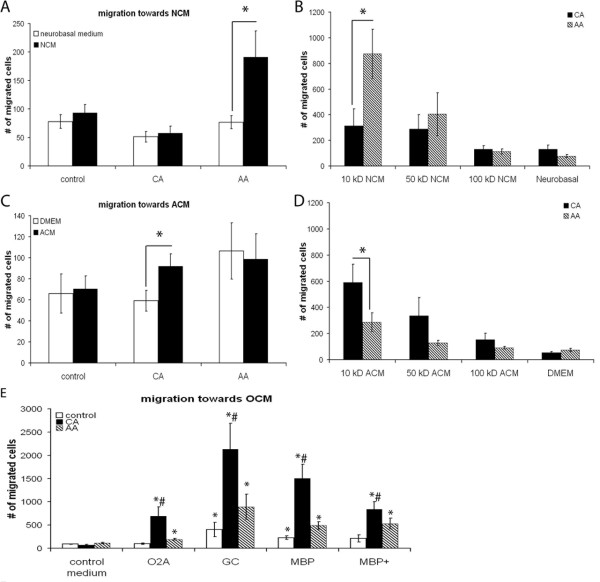
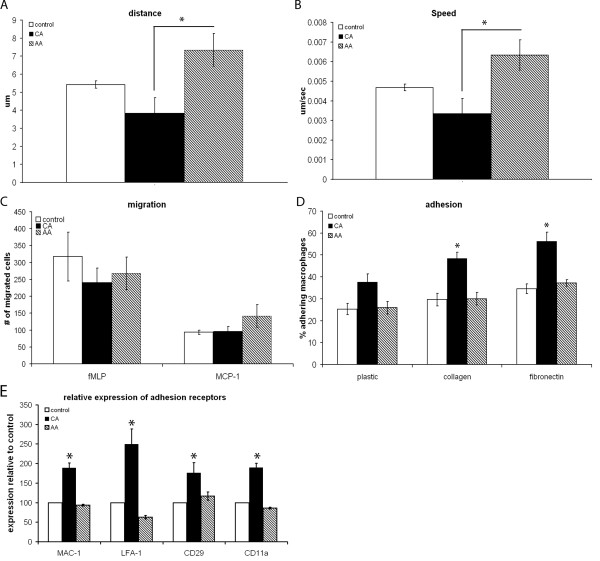
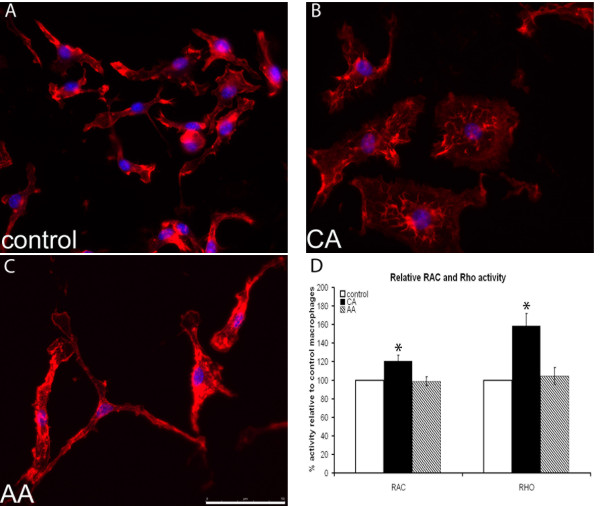
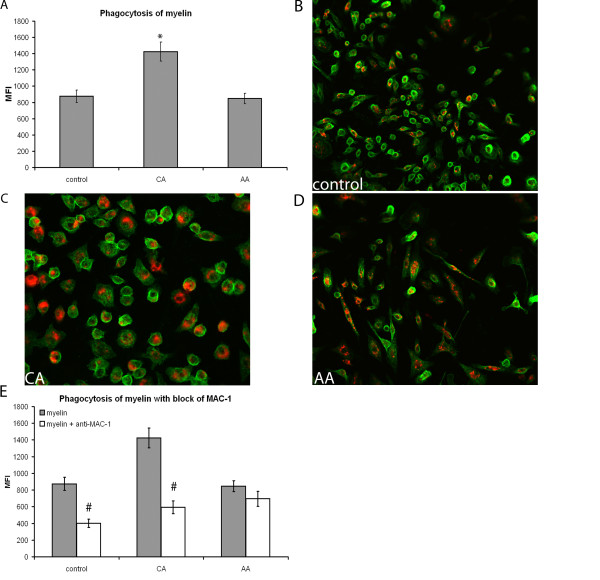
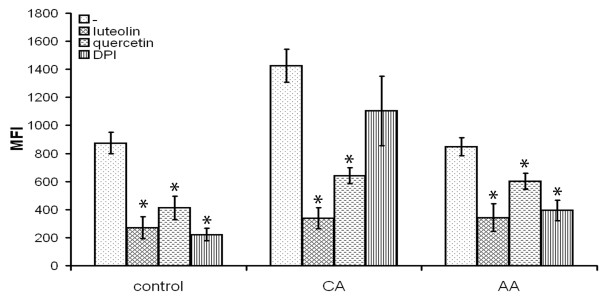
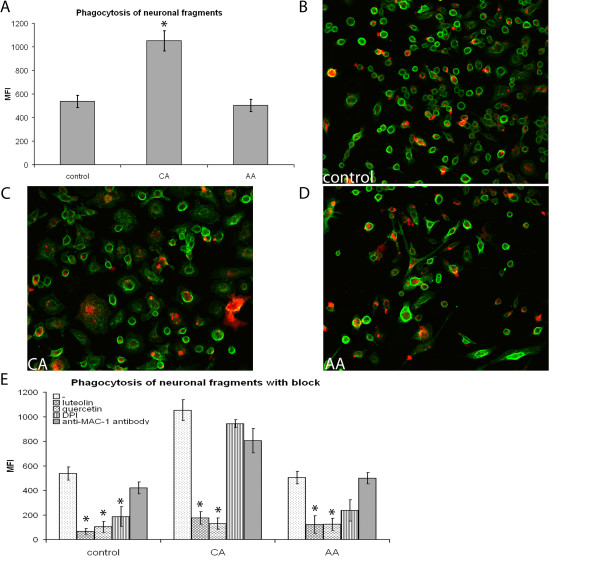
Background: Macrophages play an important role in neuroinflammatory diseases such as multiple sclerosis (MS) and spinal cord injury (SCI), being involved in both damage and repair. The divergent effects of macrophages might be explained by their different activation status: classically activated (CA/M1), pro-inflammatory, macrophages and alternatively activated (AA/M2), growth promoting, macrophages. Little is known about the effect of macrophages with these phenotypes in the central nervous system (CNS) and how they influence pathogenesis. The aim of this study was therefore to determine the characteristics of these phenotypically different macrophages in the context of the CNS in an in vitro setting. Results: Here we show that bone marrow derived CA and AA macrophages have a distinct migratory capacity towards medium conditioned by various cell types of the CNS. AA macrophages were preferentially attracted by the low weight (< 10 kD) fraction of neuronal conditioned medium, while CA macrophages were attracted in higher numbers by astrocyte- and oligodendrocyte conditioned medium. Intrinsic motility was twice as high in AA macrophages compared to CA macrophages. The adhesion to extracellular matrix molecules (ECM) was significantly enhanced in CA macrophages compared to control and AA macrophages. The actin cytoskeleton was differentially organized between CA and AA macrophages, possibly due to greater activity of the GTPases RhoA and Rac in CA macrophages. Phagocytosis of myelin and neuronal fragments was increased in CA macrophages compared to AA macrophages. The increase in myelin phagocytosis was associated with higher expression of CR3/MAC-1 in CA macrophages. Conclusion: In conclusion, since AA macrophages are more motile and are attracted by NCM, they are prone to migrate towards neurons in the CNS. CA macrophages have a lower motility and a stronger adhesion to ECM. In neuroinflammatory diseases the restricted migration and motility of CA macrophages might limit lesion size due to bystander damage.
Overview
The claims and statistics of this paper haven’t been checked yet.
Run the check — free, no account needed. It reads the open-access text and checks the sources it cites.
Integrity signals
Registry
Cites
Statistics
Figures
Verification
Claims the paper makes
The claims and statistics of this paper haven’t been checked yet.
Run the check — free, no account needed. It reads the open-access text and checks the sources it cites.
Claims other papers make about this one
Each is checked against this paper’s own text: does it say what the citing paper says it does?
The source backs part of the claim, not all of it — or backs it for a different population, condition or comparison.
In the citing paper
“Previous studies indicated that pro-inflammatory M1 macrophages appeared large, round-shape morphology, while anti-inflammatory M2 macrophages showed elongated shape [49, 50].”
From A tailored bioactive 3D porous poly(lactic-acid)-exosome scaffold with osteo-immunomodulatory and osteogenic differentiation properties (2022) · cites this paper as [50]
Experimental — accuracy not yet measured
Self-check
Percentages, sums and reported differences re-computed from the paper’s own numbers.
The self-check needs the paper’s full text.
Citations
Cites
Exploring the full spectrum of macrophage activation
Mosser, D. M., & Edwards, J. P. (2008) · Nature Reviews Immunology · doi:10.1038/nri2448 · Cited by 9,144 · cited 5×
“Together these features determine the wound healing and growth promoting phenotype of AA macrophages [1,2].”
BackgroundInfluentialAxonal transection in the lesions of multiple sclerosis
Trapp, B. D., Peterson, J., Ransohoff, R. M., Rudick, R., Mörk, S., & Bö, L. (1998) · New England Journal of Medicine · doi:10.1056/nejm199801293380502 · Cited by 4,029 · cited 2×
“A correlation was found between location and amount of axonal damage and loss and cellular infiltrates containing macrophages [25-27].”
BackgroundMonocyte Chemoattractant Protein-1 (MCP-1): An Overview
Deshmane, S. L., Kremlev, S., Amini, S., & Sawaya, B. E. (2009) · Journal of Interferon & Cytokine Research · doi:10.1089/jir.2008.0027 · Cited by 3,889 · cited 1×
“Both fMLP and MCP-1 are potent chemoattractants [57,58].”
BackgroundKigerl, K. A., Gensel, J. C., Ankeny, D. P., Alexander, J. K., Donnelly, D. J., & Popovich, P. G. (2009) · The Journal of Neuroscience · doi:10.1523/jneurosci.3257-09.2009 · Cited by 2,130 · cited 2×
“found that conditioned medium from CA macrophages was toxic to neurons, while conditioned medium from AA macrophages was not and could even induce axonal outgrowth across a gradient of inhibitory substrate [39].”
BackgroundMartinez, F. O., Gordon, S., Locati, M., & Mantovani, A. (2006) · The Journal of Immunology · doi:10.4049/jimmunol.177.10.7303 · Cited by 2,125 · cited 1×
“Interestingly, human AA macrophages have increased expression levels of CXCR4, the receptor for CXCL12 which is expressed in cultured neurons [52] and in normal brain [53], while CA macrophages have higher expression levels of CCR7 [54].”
BackgroundStein, M., Keshav, S., Harris, N., & Gordon, S. (1992) · The Journal of experimental medicine · doi:10.1084/jem.176.1.287 · Cited by 1,960 · cited 3×
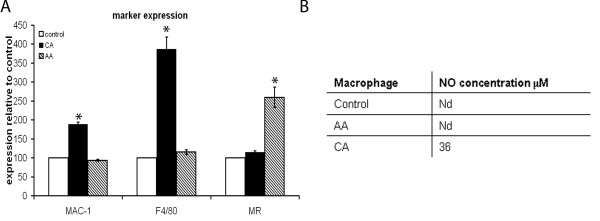
“MR is a longstanding marker for the AA phenotype [3].”
BackgroundMethodNathan, C., & Shiloh, M. U. (2000) · Proceedings of the National Academy of Sciences · doi:10.1073/pnas.97.16.8841 · Cited by 1,469 · cited 1×
“The CA macrophages produce nitric oxide (NO) and reactive oxygen species (ROS) making them cytotoxic [1,4].”
BackgroundTumor necrosis factor mediates myelin and oligodendrocyte damage in vitro
Selmaj, K., & Raine, C. S. (1988) · Annals of Neurology · doi:10.1002/ana.410230405 · Cited by 1,417 · cited 1×
“Activated macrophages secrete many products that could contribute to axonal and oligodendrocyte damage seen in MS lesions, such as matrix metalloproteinases (MMPs) [15], NO and glutamate, [16-22].”
BackgroundKerschensteiner, M., Gallmeier, E., Behrens, L., Vargas-Leal, V., Misgeld, T., Klinkert, W. E. F., Kolbeck, R., Hoppe, E., Oropeza-Wekerle, R. L., Bartke, I., et al. (1999) · The Journal of Experimental Medicine · doi:10.1084/jem.189.5.865 · Cited by 1,019 · cited 2×
“Moreover, activated macrophages/microglia are found to be sources of neurotrophins and growth factors, such as brain derived neurotrophic factor (BDNF) in MS lesions [30,31] and elimination of infiltrating macrophages reduced remyelination in demyelinating models [32].”
BackgroundButovsky, O., Ziv, Y., Schwartz, A., Landa, G., Talpalar, A. E., Pluchino, S., Martino, G., & Schwartz, M. (2006) · Molecular and Cellular Neuroscience · doi:10.1016/j.mcn.2005.10.006 · Cited by 923
Research works printed but not linked: 1
- van der Laan LJ, Ruuls SR, Weber KS, Lodder IJ, Dopp EA, Dijkstra CD: Macrophage phagocytosis of myelin in vitro determined by flow cytometry: phagocytosis is mediated by CR3 and induces production of tumor necrosis factor-alpha and nitric oxide. J Neuroimmunol. 1996, 70: 145-152. 10.1016/S0165-5728(96)00110-5. · DOI
Cited by
Sorted by citations
Human macrophage polarization in vitro: maturation and activation methods compared.
Vogel, D., Glim, J. E., Stavenuiter, A. W., Breur, M., Heijnen, P., Amor, S., Dijkstra, C., & Beelen, R. (2014) · Immunobiology · doi:10.1016/j.imbio.2014.05.002 · Cited by 431
Self-citationPhysical and mechanical regulation of macrophage phenotype and function
McWhorter, F. Y., Davis, C. T., & Liu, W. F. (2015) · Cellular and Molecular Life Sciences · doi:10.1007/s00018-014-1796-8 · Cited by 437
“LPS or M1-like activation has been demonstrated to enhance cell adhesion in both human and murine macrophages [49, 64, 67].”
BackgroundResultInfluentialMacrophage biology in the peripheral nervous system after injury
Zigmond, R. E., & Echevarría, F. D. (2018) · Progress in Neurobiology · doi:10.1016/j.pneurobio.2018.12.001 · Cited by 383
“With respect to Wallerian degeneration, Vereyken et al. (2011) showed that M(LPS-IFNγ) macrophages consumed a greater amount of fluorescent myelin than M(IL-4) macrophages, suggesting that M(LPS-IFNγ) have a greater propensity for myelin phagocytosis.”
Function of microglia and macrophages in secondary damage after spinal cord injury
Ren, Y., Zhou, X., & He, X. (2014) · Neural Regeneration Research · doi:10.4103/1673-5374.143423 · Cited by 328
“Several macrophage subsets have been classified based on the expression of cell surface markers, intracellular enzymes, and secreted molecules, including M1 (classical activation), M2 (alternative activation), regulatory macrophages, tumor-associated macrophages (TAM), myeloid-derived suppressor cells (MDSC), and so f…”
Natrajan, M. S., de la Fuente, A. G., Crawford, A. H., Linehan, E., Núñez, V., Johnson, K. R., Wu, T., Fitzgerald, D. C., Ricote, M., Bielekova, B., et al. (2015) · Brain · doi:10.1093/brain/awv289 · Cited by 225
Differential regulation of macrophage inflammatory activation by fibrin and fibrinogen
Hsieh, J. Y., Smith, T. D., Meli, V. S., Tran, T. N., Botvinick, E. L., & Liu, W. F. (2016) · Acta Biomaterialia · doi:10.1016/j.actbio.2016.09.024 · Cited by 218
Macrophage polarization in response to epigenetic modifiers during infection and inflammation
Patel, U., Rajasingh, S., Samanta, S., Cao, T., Dawn, B., & Rajasingh, J. (2016) · Drug Discovery Today · doi:10.1016/j.drudis.2016.08.006 · Cited by 223
“During lung inflammation, the M1 and M2 macrophages are two distinct phenotypes with important roles in producing inflammatory and anti-inflammatory factors, respectively, to combat the injury [74,75].”
BackgroundMa, S., Chen, Y.-J., Zhang, J., Shen, L., Wang, R., Zhou, J.-S., Hu, J., & Lü, H. (2014) · Brain Behavior and Immunity · doi:10.1016/j.bbi.2014.11.007 · Cited by 201
“IL-6, NO, and TNF-a levels were markedly higher in M1 than in M0 and M2 cell cultures (P 0.01), whereas M2 cells produced higher levels of IL-10 and TGF-b than the other macrophage subtypes (P < 0.01) (Fig.”
InfluentialQian, Y., Lin, H., Yan, Z., Shi, J., & Fan, C. (2021) · Materials Today · doi:10.1016/j.mattod.2021.09.014 · Cited by 194
Image based Machine Learning for identification of macrophage subsets
Rostam, H. M., Reynolds, P. M., Alexander, M. R., Gadegaard, N., & Ghaemmaghami, A. M. (2017) · Scientific Reports · doi:10.1038/s41598-017-03780-z · Cited by 196
“Their data suggested that M1 macrophages appeared large, rounded and flat while M2 macrophages were stretched and elongated cells 36 .”
BackgroundMicroglia in central nervous system repair after injury
Jin, X., & Yamashita, T. (2016) · The Journal of Biochemistry · doi:10.1093/jb/mvw009 · Cited by 191
Macrophages migrate in an activation-dependent manner to chemokines involved in neuroinflammation
Vogel, D. Y. S., Heijnen, P. D. A. M., Breur, M., de Vries, H. E., Tool, A. T. J., Amor, S., & Dijkstra, C. D. (2014) · Journal of Neuroinflammation · doi:10.1186/1742-2094-11-23 · Cited by 186
Self-citationElectric fields are novel determinants of human macrophage functions
Hoare, J. I., Rajnicek, A. M., McCaig, C., Barker, R. N., & Wilson, H. M. (2015) · Journal of Leukocyte Biology · doi:10.1189/jlb.3a0815-390r · Cited by 169
Acidity promotes tumour progression by altering macrophage phenotype in prostate cancer
El-Kenawi, A., Gatenbee, C., Robertson‐Tessi, M., Bravo, R., Dhillon, J., Balagurunathan, Y., Berglund, A., Vishvakarma, N. K., Ibrahim‐Hashim, A., Choi, J. W., et al. (2019) · British Journal of Cancer · doi:10.1038/s41416-019-0542-2 · Cited by 150
Bannon, P., Wood, S., Restivo, T., Campbell, L., Hardman, M., & Mace, K. (2013) · Disease Models & Mechanisms · doi:10.1242/dmm.012237 · Cited by 154
“Pro-inflammatory, classically activated macrophages have been shown to be more adherent than alternatively activated macrophages in a variety of assays (Gordon, 2003; Vereyken et al., 2011).”
BackgroundCougoule, C., Goethem, E. V., Cabec, V. L., Lafouresse, F., Dupré, L., Mehraj, V., Mège, J., Lastrucci, C., & Maridonneau‐Parini, I. (2012) · European Journal of Cell Biology · doi:10.1016/j.ejcb.2012.07.002 · Cited by 130
The Thyroid Hormone Triiodothyronine Controls Macrophage Maturation and Functions
Perrotta, C., Buldorini, M., Assi, E., Cazzato, D., Palma, C. D., Clementi, E., & Cervia, D. (2013) · American Journal Of Pathology · doi:10.1016/j.ajpath.2013.10.006 · Cited by 135
Díez-Tercero, L., Delgado, L. M., Bosch-Rué, È., & Pérez, R. A. (2021) · Scientific Reports · doi:10.1038/s41598-021-91070-0 · Cited by 129
Macrophage-Derived Cholesterol Contributes to Therapeutic Resistance in Prostate Cancer
El-Kenawi, A., Dominguez‐Viqueira, W., Liu, M., Awasthi, S., Abraham-Miranda, J., Keske, A., Steiner, K. K., Noel, L. C., Serna, A. N., Dhillon, J., et al. (2021) · Cancer Research · doi:10.1158/0008-5472.can-20-4028 · Cited by 116
“Primary cells: Bone marrow-derived macrophages (BMDMs) were generated as described previously (15,16).”
MethodHeinrich, F., Lehmbecker, A., Raddatz, B. B., Kegler, K., Tipold, A., Stein, V. M., Kalkuhl, A., Deschl, U., Baumgärtner, W., Ulrich, R., et al. (2017) · PLoS ONE · doi:10.1371/journal.pone.0183572 · Cited by 111
Immunoregulation of macrophages by dynamic ligand presentation via ligand–cation coordination
Kang, H., Yang, B., Zhang, K., Pan, Q., Yuan, W., Li, G., & Bian, L. (2019) · Nature Communications · doi:10.1038/s41467-019-09733-6 · Cited by 107
The roles of microglia and astrocytes in myelin phagocytosis in the central nervous system
Xu, T., Liu, C., Deng, S., Gan, L., Zhang, Z., Yang, G., Tian, H., & Tang, Y. (2022) · Journal of Cerebral Blood Flow & Metabolism · doi:10.1177/0271678x221137762 · Cited by 110
Activation of pial and dural macrophages and dendritic cells by cortical spreading depression
Schain, A. J., Melo‐Carrillo, A., Borsook, D., Grutzendler, J., Strassman, A. M., & Burstein, R. (2018) · Annals of Neurology · doi:10.1002/ana.25169 · Cited by 108
“Existing literature supports the notion that macrophages adopt a rounded shape when activated.(37,38) Based on this body of evidence and on our observation that exposure to LPS also caused the meningeal macrophages to retract their processes, we interpret the findings as suggesting that CSD activates pial macrophages…”
ResultChuquimia, O. D., Petursdottír, D. H., Períolo, N., & Fernández, C. (2012) · Infection and Immunity · doi:10.1128/iai.00950-12 · Cited by 102
Kang, H., Kim, S., Wong, D. S. H., Jung, H. J., Lin, S., Zou, K., Li, R., Li, G., Dravid, V. P., & Bian, L. (2017) · Nano Letters · doi:10.1021/acs.nanolett.7b03405 · Cited by 94
Kang, H., Jung, H. J., Kim, S., Wong, S. H. D., Lin, S., Li, G., Dravid, V. P., & Bian, L. (2018) · ACS Nano · doi:10.1021/acsnano.8b02226 · Cited by 86
Glial hemichannels and their involvement in aging and neurodegenerative diseases
Orellana, J. A., Rommy von Bernhardi, M., Giaume, C., & Sáez, J. C. (2012) · Reviews in the Neurosciences · doi:10.1515/revneuro-2011-0065 · Cited by 88
Chen, K.-H. E., Lainez, N. M., & Coss, D. (2020) · The Journal of Immunology · doi:10.4049/jimmunol.2000490 · Cited by 72
Macrophages in microgravity: the impact of space on immune cells
Ludtka, C., Silberman, J., Moore, E., & Allen, J. B. (2021) · npj Microgravity · doi:10.1038/s41526-021-00141-z · Cited by 73
Cell engineering: Biophysical regulation of the nucleus
Song, Y., Soto, J., Chen, B., Yang, L., & Li, S. (2020) · Biomaterials · doi:10.1016/j.biomaterials.2019.119743 · Cited by 71
Singleton, H., Graham, S. P., Bodman-Smith, K. B., Frossard, J., & Steinbach, F. (2016) · Frontiers in Microbiology · doi:10.3389/fmicb.2016.00832 · Cited by 66
Cathepsin Inhibition Modulates Metabolism and Polarization of Tumor-Associated Macrophages
Oelschlägel, D., Sadan, T. W., Salpeter, S. J., Krug, S., Blum, G., Schmitz, W., Schulze, A., & Michl, P. (2020) · Cancers · doi:10.3390/cancers12092579 · Cited by 63
“This correlates with differences in actin organization between M1 and M2 macrophages [56,59].”
BackgroundKartikasari, N., Yamada, M., Watanabe, J., Tiskratok, W., He, X., Kamano, Y., & Egusa, H. (2021) · Acta Biomaterialia · doi:10.1016/j.actbio.2021.10.019 · Cited by 65
Sikkema, A. H., Stoffels, J. M. J., Wang, P., Basedow, F. J., Bulsink, R., Bajramovic, J. J., & Baron, W. (2018) · Journal of Neuroinflammation · doi:10.1186/s12974-018-1238-x · Cited by 60
Self-citationThe shift in macrophages polarisation after tendon injury: A systematic review
Xu, H.-T., Lee, C., Li, R. M. Y., Wang, Y.-F., Yung, P. S., & Lee, O. K. (2019) · Journal of Orthopaedic Translation · doi:10.1016/j.jot.2019.11.009 · Cited by 56
“Previous studies have demonstrated that the migration speed of Mφs is inversely correlated to intracellular tensions [76], andM2 primaryMφs has been shown to be muchmore shifting than M1 Mφs in the absence of chemoattractant in murine [77].”
BackgroundMoran, C. S., Jose, R. J., Moxon, J. V., Roomberg, A., Norman, P. E., Rush, C. M., Körner, H., & Golledge, J. (2013) · Arteriosclerosis Thrombosis and Vascular Biology · doi:10.1161/atvbaha.112.301006 · Cited by 56
“Increased production of superoxide anions, and oxygen and nitrogen radicals is characteristic of classical activation and M1 differentiation, whereas CD206 (mannose receptor) is a signature marker for alternative activation and the M2 phenotype.(40) In vitro, an M1 phenotype can be induced in macrophages by exposure t…”
BackgroundTaniguchi, K., Hikiji, H., Okinaga, T., Hashidate‐Yoshida, T., Shindou, H., Ariyoshi, W., Shimizu, T., Tominaga, K., & Nishihara, T. (2015) · Journal of Cellular Biochemistry · doi:10.1002/jcb.25230 · Cited by 51
“JOURNAL OF CELLULAR BIOCHEMISTRY LPCAT3 REGULATES M1M2-MACROPHAGE POLARIZATION 2845 2015], surface antigen presentation, production of chemokines and cytokines [Biswas et al., 2006; Umemura et al., 2008], and phagocytic activity [Vereyken et al., 2011].”
BackgroundShin, T., Ahn, M., Moon, C., Kim, S., & Sim, K. (2013) · Molecular Neurobiology · doi:10.1007/s12035-013-8398-6 · Cited by 48
Tyteca, D., Nishino, T., Debaix, H., Smissen, P. V. D., N’Kuli, F., Hoffmann, D., Cnops, Y., Rabolli, V., Loo, G., Beyaert, R., et al. (2015) · PLoS ONE · doi:10.1371/journal.pone.0117398 · Cited by 45
“Among these features for M2 are: cell elongation [27], formation of lamellipodia [48,49], and increased migration [26].”
BackgroundZhang, Y., Huo, M., Wang, Y., Xiao, L., Wu, J., Ma, Y., Zhang, D., Lang, X., & Wang, X. (2022) · Journal of Biological Engineering · doi:10.1186/s13036-022-00301-z · Cited by 47
“macrophages showed elongated shape [49, 50].”
Lang, J., Cheng, Y., Rolfe, A. J., Hammack, C., Vera, D. L., Kyle, K. E., Wang, J., Meissner, T. B., Ren, Y., Cowan, C. A., et al. (2018) · Stem Cell Reports · doi:10.1016/j.stemcr.2018.06.006 · Cited by 40
CSF-1R Signaling in Health and Disease: A Focus on the Mammary Gland
Dwyer, A. R., & Pixley, F. J. (2014) · Journal of Mammary Gland Biology and Neoplasia · doi:10.1007/s10911-014-9320-1 · Cited by 40
“In addition, an IL-4-induced M2 phenotype is a necessary element of the paracrine interaction and IL-4 treated macrophages move significantly faster than control macrophages [23,110].”
BackgroundLi, Q., Zhou, L., Wang, L., Li, S., Xu, G., Gu, H., Li, D., Liu, M., Fang, L., Wang, Z., et al. (2020) · European Journal of Immunology · doi:10.1002/eji.201948299 · Cited by 38
SDF-1/CXCL12: Its role in spinal cord injury
Järve, A., Bosse, F., & Müller, H. W. (2011) · The International Journal of Biochemistry & Cell Biology · doi:10.1016/j.biocel.2011.11.023 · Cited by 36
Patel, D. K., Ganguly, K., Dutta, S. D., Patil, T. V., & Lim, K. (2022) · Carbohydrate Polymers · doi:10.1016/j.carbpol.2022.120464 · Cited by 34
Herrmann, I., Gotovina, J., Fazekas, J., Fischer, M. B., Hufnagl, K., Bianchini, R., & Jensen‐Jarolim, E. (2018) · Developmental & Comparative Immunology · doi:10.1016/j.dci.2018.01.005 · Cited by 31
Macrophages undergo a behavioural switch during wound healing in zebrafish
Sipka, T., Park, S. A., Özbilgiç, R., Balas, L., Durand, T., Mikula, K., Lutfalla, G., & Chi, M. N. (2022) · Free Radical Biology and Medicine · doi:10.1016/j.freeradbiomed.2022.09.021 · Cited by 30
Tan, H., Zhong, Y., Shen, X. P., Cheng, Y., Qin, J., & Deng, L. (2012) · Neuropharmacology · doi:10.1016/j.neuropharm.2012.06.037 · Cited by 28
Modulation of actin dynamics as potential macrophage subtype-targeting anti-tumour strategy
Pergola, C., Schubert, K., Pace, S., Ziereisen, J., Nikels, F., Scherer, O., Hüttel, S., Zahler, S., Vollmar, A. M., Weinigel, C., et al. (2017) · Scientific Reports · doi:10.1038/srep41434 · Cited by 29
“Note that mouse bone-marrow-derived M2 possess a higher intrinsic motility than M1, seemingly related to different cytoskeletal functions 39 .”
The Effects of Simulated Microgravity on Macrophage Phenotype
Ludtka, C., Moore, E., & Allen, J. B. (2021) · Biomedicines · doi:10.3390/biomedicines9091205 · Cited by 26
“Work has shown that cytoskeletal actin arrangement enables both M1 and M2 functionalities [52].”
BackgroundMicroenvironments‐Modulated Biomaterials Enhance Spinal Cord Injury Therapy
Li, Y., Zhang, Q., Liu, Z., Fu, C., & Ding, J. (2024) · Advanced Functional Materials · doi:10.1002/adfm.202403900 · Cited by 26
Sex-specific impact of maternal obesity on fetal placental macrophages and cord blood triglycerides
Shook, L. L., James, K. E., Roberts, D. J., Powe, C. E., Perlis, R. H., Thornburg, K. L. R., O’Tierney-Ginn, P. F., & Edlow, A. G. (2023) · Placenta · doi:10.1016/j.placenta.2023.08.001 · Cited by 26
Hotter, G., Mastora, C., Jung, M., Brüne, B., Carbonell, T., Josa‐Laorden, C., Pérez‐Calvo, J. I., Cruzado, J. M., Guiteras, R., & Solà, A. (2020) · Scientific Reports · doi:10.1038/s41598-020-72342-7 · Cited by 23
Computational modeling of cytokine signaling in microglia
Anderson, W. D., Makadia, H. K., Greenhalgh, A. D., Schwaber, J. S., David, S., & Vadigepalli, R. (2015) · Molecular BioSystems · doi:10.1039/c5mb00488h · Cited by 25
Polypharmacologic Reprogramming of Tumor-Associated Macrophages toward an Inflammatory Phenotype
Nishida‐Aoki, N., & Gujral, T. S. (2021) · Cancer Research · doi:10.1158/0008-5472.can-21-1428 · Cited by 24
The Topography of Silica Films Modulates Primary Macrophage Morphology and Function
Makaremi, S., Luu, H., Boyle, J. P., Zhu, Y., Cerson, C., Bowdish, D. M. E., & Moran-Mirabal, J. M. (2019) · Advanced Materials Interfaces · doi:10.1002/admi.201900677 · Cited by 23
Boghdadi, A. G., Spurrier, J. M., Teo, L., Li, M., Škarica, M., Cao, B., Kwan, W. C., Merson, T. D., Nilsson, S. K., Šestan, N., et al. (2021) · Nature Communications · doi:10.1038/s41467-021-27245-0 · Cited by 25
Agmatine Modulates the Phenotype of Macrophage Acute Phase after Spinal Cord Injury in Rats
Kim, J. Y., Kim, J. Y., Mun, C. H., Suh, M., & Lee, J. E. (2017) · Experimental Neurobiology · doi:10.5607/en.2017.26.5.278 · Cited by 20
“3F) and it was reported that M1-to-M2 switch is promoted by IL10 [5, 22, 23].”
BackgroundWang, X., Cheng, Z., Tai, W., Shi, M., Ayazi, M., Liu, Y., Sun, L. J., Yu, C., Fan, Z., Bin, G., et al. (2024) · Brain Behavior and Immunity · doi:10.1016/j.bbi.2024.04.013 · Cited by 19
“4 A ), consistent with the characteristic features of M1 M ϕ activation (McWhorter et al., 2013; Vereyken et al., 2011).”
BackgroundImprinting of maternal thyroid hormones in the offspring
Opazo, M. C., Haensgen, H., Böhmwald, K., Venegas, L. F., Boudin, H., Elorza, Á. A., Simón, F., Fardella, C., Bueno, S. M., Kalergis, A. M., et al. (2017) · International Reviews of Immunology · doi:10.1080/08830185.2016.1277216 · Cited by 20
“Furthermore, addition of T3 to cultures inhibits the migratory capacity of macrophages, which is consistent with previous observations in murine M1 macrophages [140].”
ResultP2Y6 Receptors Regulate CXCL10 Expression and Secretion in Mouse Intestinal Epithelial Cells
Salem, M., Tremblay, A., Pelletier, J., Robaye, B., & Sévigny, J. (2018) · Frontiers in Pharmacology · doi:10.3389/fphar.2018.00149 · Cited by 19
“The migrated macrophages were collected from the bottom chambers and counted with a hemocytometer, as detailed in previous studies (Vereyken et al., 2011; Unver et al., 2015).”
MethodChung, E., Choi, H., Lim, J. E., & Son, Y. (2014) · Tissue Engineering and Regenerative Medicine · doi:10.1007/s13770-013-1113-x · Cited by 19
Schain, A. J., Melo‐Carrillo, A., Ashina, S., Strassman, A. M., & Burstein, R. (2019) · Pain · doi:10.1097/j.pain.0000000000001789 · Cited by 18
“recently that CSD causes pial and dural macrophages, which are present mainly around blood vessels, to retract their podia (cytoplasmic processes), and interpreted this behavior as an indication of activation.(37,50,51) Timewise, we noted that although pial macrophages became activated minutes after occurrence of CSD,…”
BackgroundPark, Y., Zhang, Q., Wiegertjes, G. F., Fernandes, J. M. O., & Kiron, V. (2020) · Frontiers in Cell and Developmental Biology · doi:10.3389/fcell.2020.580848 · Cited by 17
Divergent results induced by different types of septic shock in transglutaminase 2 knockout mice
Yoo, H. J., Ahn, E.-R., Kim, S.-J., Lee, S.-H., Oh, S. H., & Kim, S. (2012) · Amino Acids · doi:10.1007/s00726-012-1412-x · Cited by 17
Wang, Y., Sun, L., Song, Z., Wang, D., Bao, Y., & Li, Y. (2017) · Molecular Immunology · doi:10.1016/j.molimm.2016.12.021 · Cited by 16
“Likely, decreased hagocytosis is protective because the respiratory burst caused by hagocytosis may produce ROS that harm the tumor microenvironent (Vernon and Tang, 2013).”
BackgroundLi, Q., Feng, C., Li, L., Xu, G., Gu, H., Li, S., Li, D., Liu, M., Han, S., & Zheng, B. Q. (2021) · The Journal of Immunology · doi:10.4049/jimmunol.2000231 · Cited by 16
Czapla, J., Cichoń, T., Pilny, E., Jarosz–Biej, M., Matuszczak, S., Drzyzga, A., Krakowczyk, Ł., & Smolarczyk, R. (2020) · European Journal of Pharmacology · doi:10.1016/j.ejphar.2020.173354 · Cited by 13
ATF2 orchestrates macrophage differentiation and activation to promote antibacterial responses
Rajabalee, N., Siushansian, H., Weerapura, M., Berton, S., Berbatovci, F., Hooks, B. G., Geoffrion, M., Yang, D., Harper, M., Rayner, K. J., et al. (2023) · Journal of Leukocyte Biology · doi:10.1093/jleuko/qiad076 · Cited by 12
Bowman, R. L., Wang, D., & Eom, D. S. (2022) · Cell Reports · doi:10.1016/j.celrep.2023.112818 · Cited by 12
Petursdottír, D. H., Chuquimia, O. D., Freidl, R., & Fernández, C. (2014) · PLoS ONE · doi:10.1371/journal.pone.0103411 · Cited by 12
“[7,12,13].”
Achita, A. B. P. (2015) · Journal of Clinical & Cellular Immunology · doi:10.4172/2155-9899.1000318 · Cited by 13
“1 cell line [27], and in human M(IFNγ+LPS) and M(IL-4) macrophages [31,32].”
BackgroundBertola, L., Pellizzoni, B., Giudice, C., Grieco, V., Ferrari, R., Chiti, L. E., Stefanello, D., Manfredi, M., Zani, D. D., & Recordati, C. (2024) · Veterinary Pathology · doi:10.1177/03009858241244851 · Cited by 10
Luo, Y., Qu, J., He, Z., Zhang, M., Zou, Z., Li, L., Zhang, Y., & Ye, J. (2023) · Cell Transplantation · doi:10.1177/09636897231210069 · Cited by 9
“Although immune infiltration is critical for removal of harmful cells and myelin debris 40 , inflammatory consequences may exacerbate secondary neuronal cell death.”
Drab, D., Santocki, M., Opydo‐Chanek, M., & Kołaczkowska, E. (2023) · Cell and Tissue Research · doi:10.1007/s00441-023-03832-z · Cited by 9
“Although at this point, we do not know why flow cytometric analyses indicated lower expression of F4/80 than immunocy-tochemical one, the surface presence of LFA-1 confirmed the expected differentiation and is in line with literature on BMDMs (Vereyken et al. 2011).”
ResultCreatine promotes the repair of peripheral nerve injury by affecting macrophage polarization
Li, Y., Jin, X., Yang, X., Zhang, L., & Qi, Z. (2022) · Biochemical and Biophysical Research Communications · doi:10.1016/j.bbrc.2022.03.047 · Cited by 8
Navrátilová, P., Emmer, J., Tomas, T., Ryba, L., Burda, J., Loja, T., Veverková, J., Válková, L., & Goldbergová, M. P. (2023) · Environmental Science and Pollution Research · doi:10.1007/s11356-023-31430-7 · Cited by 8
“Thanks to this, we can confirm the theory that the round morphology of the cells could actually correspond to the M1 phenotype, which is in accordance with other studies (Vereyken et al. 2011; McWhorter et al. 2013; Tarique et al. 2015).”
Tan, H., Kang, X., Zhong, Y., Shen, X. P., Cheng, Y., Qin, J., & Deng, L. (2012) · Europe PMC (PubMed Central) · doi:10.3969/j.issn.1673-5374.2012.04.010 · Cited by 8
“Activated macrophages secrete numerous factors that are neuroprotective for RGCs and which promote axonal regeneration [42-43] .”
BackgroundEngineering physical microenvironments to study innate immune cell biophysics
Kalashnikov, N., & Moraes, C. (2022) · APL Bioengineering · doi:10.1063/5.0098578 · Cited by 8
Single-nucleus RNA-seq dissection of choroid plexus tumor cell heterogeneity
Hill, A. D., Okonechnikov, K., Herr, M., Thomas, C., Thongjuea, S., Hasselblatt, M., & Patrizi, A. (2024) · The EMBO Journal · doi:10.1038/s44318-024-00283-2 · Cited by 7
“This morphology suggests a wound healing/anti-in fl ammatory bias (Costa et al, 2023; Donadon et al, 2020; McWhorter et al, 2013; Rostam et al, 2017; Vereyken et al, 2011).”
Escarrat, V., Pérez-Sánchez, J., Waly, B. E., Collazos-Castro, J. E., & Debarbieux, F. C. (2023) · Cells · doi:10.3390/cells12060839 · Cited by 6
“Ramified morphology is associated with pro-healing activated microglia and round morphology with pro-inflammatory phagocytic microglia, consistent with the need for cell debris clearance prior to the stimulation of axonal regeneration [37,38].”
BackgroundPrimate-specific response of astrocytes to stroke limits peripheral macrophage infiltrationPreprint
Boghdadi, A. G., Spurrier, J. M., Teo, L., Li, M., Škarica, M., Cao, B., Kwan, W. C., Merson, T. D., Nilsson, S. K., Šestan, N., et al. (2020) · bioRxiv (Cold Spring Harbor Laboratory) · doi:10.1101/2020.05.08.083501 · Cited by 6
Exogenous Ubiquitin Differentially Modulates the Phenotype and Function of M1 and M2 Macrophages
Shook, P. L., Wang‐Heaton, H., Casteel, J. L., Dalal, S., Singh, M., Yakubenko, V. P., & Singh, K. (2025) · Cells · doi:10.3390/cells14120879 · Cited by 5
“Macrophages, which are known to be heterogeneous cells, are capable of changing their morphology depending on environmental and molecular cues [20].”
Rahim, M. I., Baseer, S., Paasch, D., Steglich, M., Waqas, S. F., Lachmann, N., Falk, C. S., & Stiesch, M. (2026) · Acta Biomaterialia · doi:10.1016/j.actbio.2026.01.017 · Cited by 5
Kasica, N., & Kaleczyc, J. (2024) · Toxicology and Applied Pharmacology · doi:10.1016/j.taap.2024.116809 · Cited by 6
The significance of M1 macrophage should be highlighted in peripheral nerve regeneration.
Feng, R., & Zhang, P. (2023) · PubMed · doi:10.14670/hh-18-591 · Cited by 5
OnabotulinumtoxinA alters pro- and anti-inflammatory dural macrophage response to CSD in female mice
Schain, A. J., Fajardo, D. D., Strassman, A. M., Kulkarni, S., Broide, R. S., Brideau-Andersen, A. D., Adams, A. M., Brin, M. F., & Burstein, R. (2025) · Cephalalgia · doi:10.1177/03331024251378730 · Cited by 4
“Macrophages in their non-activated state (M0) can be polarized into the pro-in fl ammatory “ classically ” activated M1 pathway, which can be associated with a contracting shape change (49 – 51), and secretion of multiple pro-nociceptive molecules such as IL6, IL12, TNF-α , and IL1 β (21,25 – 27).”
Pu, Z., Luo, D., Shuai, B., Xu, Y., Liu, M., & Zhao, J. (2025) · Neurochemical Research · doi:10.1007/s11064-025-04347-5 · Cited by 2
“IL-10, notably, catalyzes the trans - differentiation from an M1 to an M2 phenotype [49 ].”
Isolation of Human Osteal Macrophages
Bousch, J. F., Lichtenberg, S., Schnitker, M., Schlösser, J., Suschek, C. V., Maus, U. M., & Beyersdorf, C. (2026) · Life · doi:10.3390/life16030376 · Cited by 1
Kizhakkanoodan, K. S., Inigo, V. J., Laxminarayana, S. L. K., Seetharam, R. N., Guruprasad, K. P., & Guru, B. R. (2026) · Clinical and Experimental Medicine · doi:10.1007/s10238-026-02190-8 · Cited by 1
“While IFN-γ/LPS-treated M1 cells often adopt a “fried-egg” appearance with perinuclear actin clus - tering, IL-4-treated M2 types display spindle-shaped forms with actin localized at the cell periphery [ 13].”
Polypharmacological Re-programming of Tumor-associated Macrophages Restores Antitumor ImmunityPreprint
Nishida‐Aoki, N., & Gujral, T. S. (2021) · bioRxiv (Cold Spring Harbor Laboratory) · doi:10.1101/2021.04.10.439265 · Cited by 1
“strongly with pro-tumor phenotypes (Benner et al., 2019; Cabanel et al., 2015; Chen et al., 2017; Hollmen et al., 2015; Hu et al., 2021; Porcheray et al., 2005; Su et al., 2014; Vereyken et al., 2011), we adopted cellular elongation quantified by live-cell imaging as an indicator of TAM polarization (Figure 1A).”
MethodData from Macrophage-Derived Cholesterol Contributes to Therapeutic Resistance in Prostate Cancer
El-Kenawi, A., Dominguez‐Viqueira, W., Liu, M., Awasthi, S., Abraham-Miranda, J., Keske, A., Steiner, K. K., Noel, L. C., Serna, A. N., Dhillon, J., et al. (2023) · doi:10.1158/0008-5472.c.6513003 · Cited by 1
Modelling Multiple Sclerosis In Vitro and the Influence of Activated Macrophages
Vereyken, E. J. F., Dijkstra, C. D., & Teunisse, C. E. (2011) · InTech eBooks · doi:10.5772/30525
“Our studies have shown that macrophage migration towards CNS cell types differs upon skewing [Vereyken et al., 2011] and that migration of macrophages in spheroids is limited and varies with skewing of the macrophages (Figure 4E).”
BackgroundMethodResultInfluentialSelf-citationEffects of Macrophages and Monocytes in Remyelination of the CNS
Natrajan, M. S., Bielekova, B., & Franklin, R. J. M. (2015) · Wiley eBooks · doi:10.1002/9781118732748.ch13
The role of syndecan-1 in the resolution of chronic inflammatory responses
Angsana, J. (2013) · SMARTech Repository (Georgia Institute of Technology)
ПОЛЯРИЗАЦИЯ МАКРОФАГОВ В СОВРЕМЕННОЙ КОНЦЕПЦИИ ФОРМИРОВАНИЯ ИММУННОГО ОТВЕТА
Lyamina, S., Malyshev, I. Y., & Evdokimov, A. I. (2014) · CyberLeninK (CyberLeninka)
Macrophage Polarization and Function in Cystic Fibrosis
Tarique, A. A. (2016) · The University of Queensland · doi:10.14264/uql.2016.680 · Cited by 1
“C57BL/6 mice were mostly used for macrophage polarization studies (41, 85-87).”
MethodRole of alveolar epithelial cells in macrophage responses against mycobacterial infections
Flores, C., & Daniela, O. (2013)
On the role of macrophages, microglia and the extracellular matrix in remyelination
Wang, P. (2018) · University of Groningen research database (University of Groningen / Centre for Information Technology)
Regulation of inflammation in canine species: a role for macrophages and Hsp70
Lyu, Q. (2021) · Utrecht University Repository (Utrecht University) · doi:10.33540/882
Metadata
- Authors
- Vereyken, E. J., Heijnen, P. D., Baron, W., de Vries, E. H., Dijkstra, C. D., & Teunissen, C. E.
- Affiliations
- Amsterdam UMC Location Vrije Universiteit Amsterdam (NL)
- University Medical Center Groningen (NL)
- Corresponding author
- Dijkstra, Christine D
- Venue
- Journal of Neuroinflammation
- Published
- 2011-05-26
- Volume
- 8
- Issue
- 1
- Pages
- 58-58
- ISSN
- 1742-2094 (ISSN-L)
- PMC
- PMC3123187
- OpenAlex
- W2165155335
- Cited by
- 108
- References
- 85
- Citations by year
- 2026: 6 · 2025: 5 · 2024: 5 · 2023: 11 · 2022: 6 · 2021: 11 · 2020: 8 · 2019: 5 · 2018: 8 · 2017: 7 · 2016: 5 · 2015: 7 · 2014: 9 · 2013: 6 · 2012: 6
- FWCI
- 4.06
- Type
- journal article
- Language
- en
- Open access
- gold
- doi.org
- Licence
- cc-by
- Locations
- Journal of Neuroinflammation (publishedVersion, cc-by)
- PubMed Central (publishedVersion, cc-by)
- PubMed (publishedVersion)
- Amsterdam UMC (VU Amsterdam) - Institutional Repository (publishedVersion, other-oa)
- University of Groningen research database (University of Groningen / Centre for Information Technology) (publishedVersion, cc-by)
- Digital Academic REpository of VU University Amsterdam (Vrije Universiteit Amsterdam) (submittedVersion)
- DOAJ (DOAJ: Directory of Open Access Journals) (submittedVersion, cc-by-sa)
- Pure Amsterdam UMC (submittedVersion, other-oa)
- University of Groningen research database (University of Groningen / Centre for Information Technology) (submittedVersion, cc-by)
- Data Archiving and Networked Services (DANS) (submittedVersion, other-oa)
- Funders
- Nederlandse Organisatie voor Wetenschappelijk Onderzoek (016.056.024)
- Topics
- Life Sciences › Neuroscience › Neurology › Neuroinflammation and Neurodegeneration Mechanisms
- Health Sciences › Medicine › Clinical Neurology › Multiple Sclerosis Research Studies
- Life Sciences › Immunology and Microbiology › Immunology › Immune cells in cancer
- Keywords
- macrophage polarization, M1 macrophages, M2 macrophages, bone marrow-derived macrophages, macrophage migration, conditioned medium, actin cytoskeleton, RhoA, Rac GTPase, extracellular matrix adhesion, phagocytosis, myelin phagocytosis, astrocytes, oligodendrocytes, neurons, neuroinflammation, multiple sclerosis, spinal cord injury
- MeSH terms
- Actins, Animals, Cell Movement, Cells, Cultured, Central Nervous System, Cytoskeleton, Flavonoids, Macrophages, Mice, Inbred C57BL, Myelin Sheath, Neuroglia, Neurons, Phagocytosis, Phenotype, Culture Media, Conditioned, Mice
About these checks
Registry, retraction, Cites and statistics results are computed, not judged, with one exception: a printed reference that no index lists is read once by a model before it counts as a citation error. Claims are extracted by a model and kept only when their quote appears verbatim in the text; each cited source is then checked, with a model’s help, for whether it says what the claim relies on. Those verdicts can be wrong — read the claim’s quote and the cited source before relying on one.
Statistics and arithmetic are recomputed, not judged.
Confidence bands are shown only for fields calibrated on our annotated test set. None is calibrated yet, so no band is shown.
What counts as a claim ›How we measure confidence ›How we check this ›
Are you an author, or do you see a problem with this page? Request a review
