

The DOI matches its Crossref record; 15 of the 15 references it cites were found in a registry or an index.
Interferon regulatory factor 8/interferon consensus sequence binding protein is a critical transcription factor for the physiological phenotype of microglia
Overview
The claims and statistics of this paper haven’t been checked yet.
Run the check — free, no account needed. It reads the open-access text and checks the sources it cites.
Integrity signals
Registry
Cites
Statistics
Figures
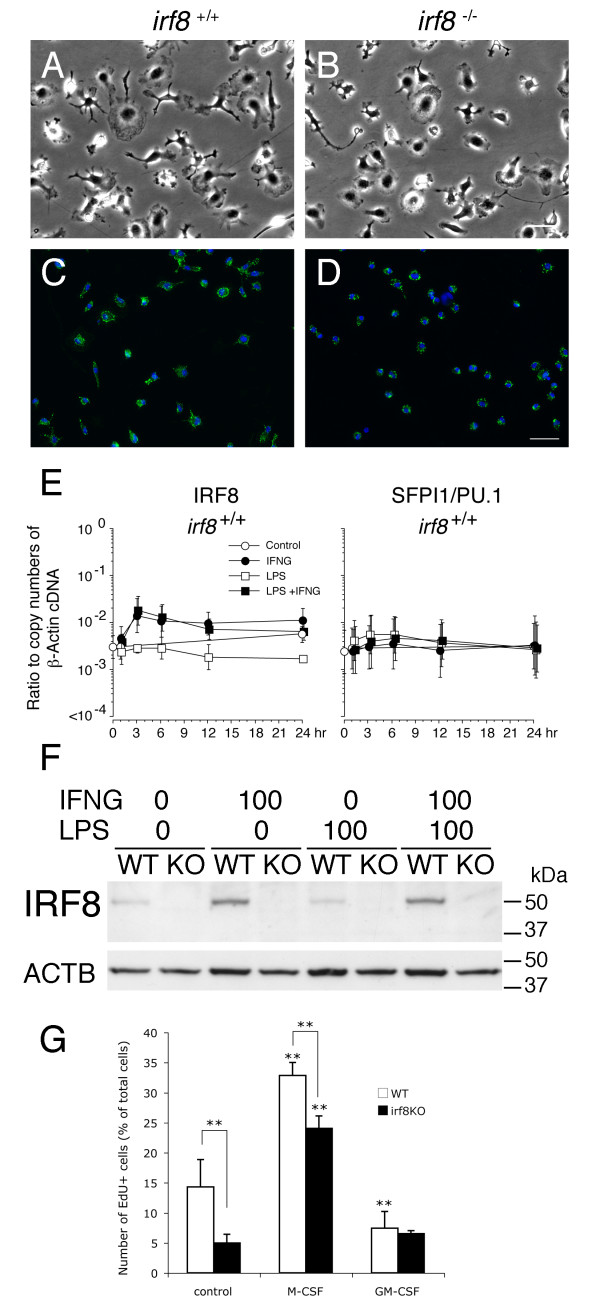
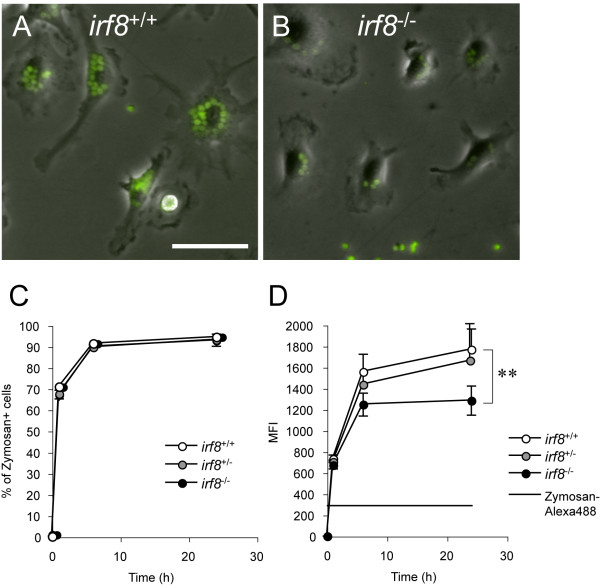
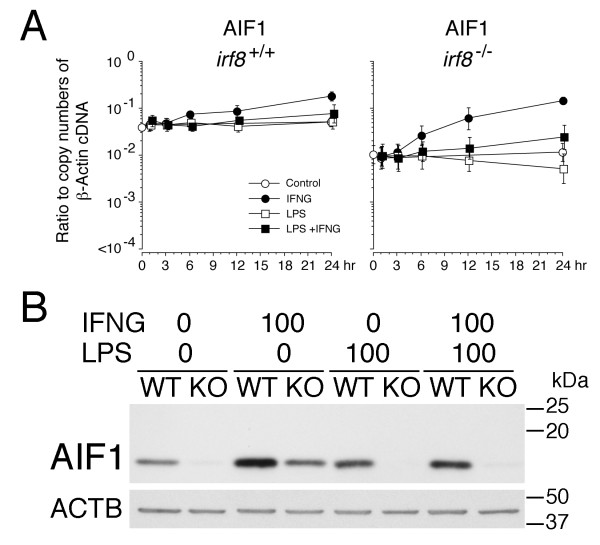
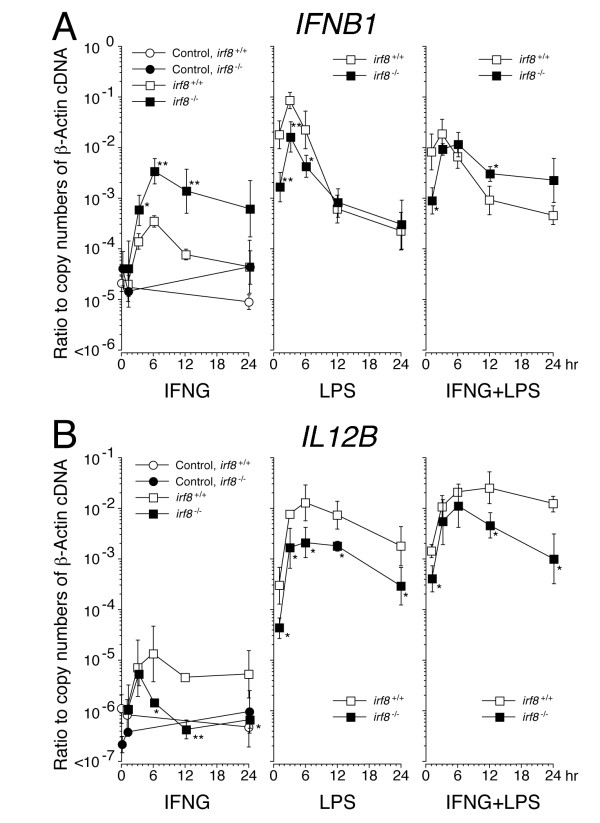
Verification
Claims the paper makes
The claims and statistics of this paper haven’t been checked yet.
Run the check — free, no account needed. It reads the open-access text and checks the sources it cites.
Claims other papers make about this one
Each is checked against this paper’s own text: does it say what the citing paper says it does?
In the citing paper
“IRF8 may activate a program of gene expression that transforms microglia into a reactive phenotype [34].”
From miR-155 induction in microglial cells suppresses Japanese encephalitis virus replication and negatively modulates innate immune responses (2014) · cites this paper as [34]
Self-check
Percentages, sums and reported differences re-computed from the paper’s own numbers.
The self-check needs the paper’s full text.
Citations
Cites
Kettenmann, H., Hanisch, U.-K., Noda, M., & Verkhratsky, A. (2011) · Physiological Reviews · doi:10.1152/physrev.00011.2010 · Cited by 3,547
Dai, X.-M., Ryan, G. R., Hapel, A. J., Dominguez, M. G., Russell, R. G., Kapp, S., Sylvestre, V., & Stanley, E. R. (2002) · Blood · doi:10.1182/blood.v99.1.111 · Cited by 1,184
Microglia in the adult brain arise from Ly-6ChiCCR2+ monocytes only under defined host conditions
Mildner, A., Schmidt, H., Nitsche, M., Merkler, D., Hanisch, U.-K., Mack, M., Heikenwalder, M., Brück, W., Priller, J., & Prinz, M. (2007) · Nature Neuroscience · doi:10.1038/nn2015 · Cited by 1,089
Turnover of resident microglia in the normal adult mouse brain
Lawson, L. J., Perry, V. H., & Gordon, S. (1992) · Neuroscience · doi:10.1016/0306-4522(92)90500-2 · Cited by 709
Erblich, B., Zhu, L., Etgen, A. M., Dobrenis, K., & Pollard, J. W. (2011) · PLoS ONE · doi:10.1371/journal.pone.0026317 · Cited by 649
Holtschke, T., Löhler, J., Kanno, Y., Fehr, T., Giese, N., Rosenbauer, F., Lou, J., Knobeloch, K.-P., Gabriele, L., Waring, J. F., et al. (1996) · Cell · doi:10.1016/s0092-8674(00)81348-3 · Cited by 644
Self-citationGM‐CSF promotes proliferation of human fetal and adult microglia in primary cultures
Lee, S. C., Liu, W., Brosnan, C. F., & Dickson, D. W. (1994) · Glia · doi:10.1002/glia.440120407 · Cited by 209
Nelson, N., Marks, M. S., Driggers, P. H., & Ozato, K. (1993) · Molecular and Cellular Biology · doi:10.1128/mcb.13.1.588-599.1993 · Cited by 192 · cited 1×
“response to LPS and IFNγ In BM-derived myeloid cells, IRF8 is critically involved in transcriptional regulation of various cytokines which are essential for initiation and modulation of the adaptive immune response [14,25,26].”
BackgroundSelf-citationWang, I.-M., Contursi, C., Masumi, A., Ma, X., Trinchieri, G., & Ozato, K. (2000) · The Journal of Immunology · doi:10.4049/jimmunol.165.1.271 · Cited by 187
Self-citationReview: ICSBP/IRF-8: Its Regulatory Roles in the Development of Myeloid Cells
Tamura, T., & Ozato, K. (2002) · Journal of Interferon & Cytokine Research · doi:10.1089/107999002753452755 · Cited by 183
Self-citation
Research works printed but not linked: 53
- Prinz M, Mildner A: Microglia in the CNS: immigrants from another world. Glia 2011, 59:177–187. · DOI
- Ransohoff RM, Cardona AE: The myeloid cells of the central nervous system parenchyma. Nature 2010, 468:253–262. · DOI · Paper page
- Ajami B, Bennett JL, Krieger C, Tetzlaff W, Rossi FM: Local self-renewal can sustain CNS microglia maintenance and function throughout adult life. Nat Neurosci 2007, 10:1538–1543. · DOI · Paper page
- Ginhoux F, Greter M, Leboeuf M, Nandi S, See P, Gokhan S, Mehler MF, Conway SJ, Ng LG, Stanley ER, Samokhvalov IM, Merad M: Fate mapping analysis reveals that adult microglia derive from primitive macrophages. Science 2010, 330:841–845. · DOI · Paper page
- Ozato K, Tailor P, Kubota T: The interferon regulatory factor family in host defense: mechanism of action. J Biol Chem 2007, 282:20065–20069. · DOI
- Tamura T, Yanai H, Savitsky D, Taniguchi T: The IRF family transcription factors in immunity and oncogenesis. Annu Rev Immunol 2008, 26:535–584. · DOI · Paper page
- Wang H, Morse HC 3rd: IRF8 regulates myeloid and B lymphoid lineage diversification. Immunol Res 2009, 43:109–117. · DOI
- Fehr T, Schoedon G, Odermatt B, Holtschke T, Schneemann M, Bachmann MF, Mak TW, Horak I, Zinkernagel RM: Crucial role of interferon consensus sequence binding protein, but neither of interferon regulatory factor 1 nor of nitric oxide synthesis for protection against murine listeriosis. J Exp Med 1997, 185:921–931. · DOI · Paper page
- Ellis SL, Gysbers V, Manders PM, Li W, Hofer MJ, Müller M, Campbell IL: The cell-specific induction of CXC chemokine ligand 9 mediated by IFN-γ in microglia of the central nervous system is determined by the myeloid transcription factor PU.1. J Immunol 2010, 185:1864–1877. · DOI
- Masuda T, Tsuda M, Yoshinaga R, Tozaki-Saitoh H, Ozato K, Tamura T, Inoue K: IRF8 is a critical transcription factor for transforming microglia into a reactive phenotype. Cell Rep 2012, 1:334–340. · DOI · Paper page
- Horiuchi M, Itoh A, Pleasure D, Itoh T: MEK-ERK signaling is involved in interferon-γ-induced death of oligodendroglial progenitor cells. J Biol Chem 2006, 281:20095–20106. · DOI
- Kawai K, Itoh T, Itoh A, Horiuchi M, Wakayama K, Bannerman P, Garbern JY, Pleasure D, Lindsten T: Maintenance of the relative proportion of oligodendrocytes to axons even in the absence of BAX and BAK. Eur J Neurosci 2009, 30:2030–2041. · DOI · Paper page
- Suzumura A, Mezitis SG, Gonatas NK, Silberberg DH: MHC antigen expression on bulk isolated macrophage-microglia from newborn mouse brain: induction of Ia antigen expression by gamma-interferon. J Neuroimmunol 1987, 15:263–278. · DOI
- Scheller M, Foerster J, Heyworth CM, Waring JF, Löhler J, Gilmore GL, Shadduck RK, Dexter TM, Horak I: Altered development and cytokine responses of myeloid progenitors in the absence of transcription factor, interferon consensus sequence binding protein. Blood 1999, 94:3764–3771. · DOI · Paper page
- Horiuchi M, Lindsten T, Pleasure D, Itoh T: Differing in vivo survival dependency of mouse and rat NG2+ oligodendroglial progenitor cells. J Neurosci Res 2010, 88:957–970. · DOI
- Panchuk-Voloshina N, Haugland RP, Bishop-Stewart J, Bhalgat MK, Millard PJ, Mao F, Leung WY, Haugland RP: Alexa dyes, a series of new fluorescent dyes that yield exceptionally bright, photostable conjugates. J Histochem Cytochem 1999, 47:1179–1188. · DOI
- Scharton-Kersten T, Contursi C, Masumi A, Sher A, Ozato K: Interferon consensus sequence binding protein-deficient mice display impaired resistance to intracellular infection due to a primary defect in interleukin 12 p40 induction. J Exp Med 1997, 186:1523–1534. · DOI · Paper page
- Li P, Wong JJ, Sum C, Sin WX, Ng KQ, Koh MB, Chin KC: IRF8 and IRF3 cooperatively regulate rapid interferon-β induction in human blood monocytes. Blood 2011, 117:2847–2854. · DOI · Paper page
- Kondo A, Nakano T, Suzuki K: Blood-brain barrier permeability to horseradish peroxidase in twitcher and cuprizone-intoxicated mice. Brain Res 1987, 425:186–190. · DOI · Paper page
- McMahon EJ, Suzuki K, Matsushima GK: Peripheral macrophage recruitment in cuprizone-induced CNS demyelination despite an intact blood-brain barrier. J Neuroimmunol 2002, 130:32–45. · DOI · Paper page
- Remington LT, Babcock AA, Zehntner SP, Owens T: Microglial recruitment, activation, and proliferation in response to primary demyelination. Am J Pathol 2007, 170:1713–1724. · DOI · Paper page
- McKercher SR, Torbett BE, Anderson KL, Henkel GW, Vestal DJ, Baribault H, Klemsz M, Feeney AJ, Wu GE, Paige CJ, Maki RA: Targeted disruption of the PU.1 gene results in multiple hematopoietic abnormalities. EMBO J 1996, 15:5647–5658. · DOI · Paper page
- Dalmau I, Vela JM, González B, Finsen B, Castellano B: Dynamics of microglia in the developing rat brain. J Comp Neurol 2003, 458:144–157. · DOI
- Cohen PE, Zhu L, Nishimura K, Pollard JW: Colony-stimulating factor 1 regulation of neuroendocrine pathways that control gonadal function in mice. Endocrinology 2002, 143:1413–1422. · DOI
- Wegiel J, Wisniewski HM, Dziewiatkowski J, Tarnawski M, Kozielski R, Trenkner E, Wiktor-Jedrzejczak W: Reduced number and altered morphology of microglial cells in colony stimulating factor-1-deficient osteopetrotic op/op mice. Brain Res 1998, 804:135–139. · DOI
- Nimmerjahn A, Kirchhoff F, Helmchen F: Resting microglial cells are highly dynamic surveillants of brain parenchyma in vivo. Science 2005, 308:1314–1318. · DOI · Paper page
- Wake H, Moorhouse AJ, Jinno S, Kohsaka S, Nabekura J: Resting microglia directly monitor the functional state of synapses in vivo and determine the fate of ischemic terminals. J Neurosci 2009, 29:3974–3980. · DOI · Paper page
- Davalos D, Grutzendler J, Yang G, Kim JV, Zuo Y, Jung S, Littman DR, Dustin ML, Gan WB: ATP mediates rapid microglial response to local brain injury in vivo. Nat Neurosci 2005, 8:752–758. · DOI · Paper page
- Hines DJ, Hines RM, Mulligan SJ, Macvicar BA: Microglia processes block the spread of damage in the brain and require functional chloride channels. Glia 2009, 57:1610–1618. · DOI
- Ohsawa K, Imai Y, Kanazawa H, Sasaki Y, Kohsaka S: Involvement of Iba1 in membrane ruffling and phagocytosis of macrophages/microglia. J Cell Sci 2000, 113:3073–3084. · DOI
- Heinrich V, Lee CY: Blurred line between chemotactic chase and phagocytic consumption: an immunophysical single-cell perspective. J Cell Sci 2011, 124:3041–3051. · DOI
- Schulze JO, Quedenau C, Roske Y, Adam T, Schüler H, Behlke J, Turnbull AP, Sievert V, Scheich C, Mueller U, Heinemann U, Büssow K: Structural and functional characterization of human Iba proteins. FEBS J 2008, 275:4627–4640. · DOI
- Sibinga NE, Feinberg MW, Yang H, Werner F, Jain MK: Macrophage-restricted and interferon γ-inducible expression of the allograft inflammatory factor-1 gene requires Pu.1. J Biol Chem 2002, 277:16202–16210. · DOI
- Kinchen JM, Ravichandran KS: Phagosome maturation: going through the acid test. Nat Rev Mol Cell Biol 2008, 9:781–795. · DOI · Paper page
- Dissing-Olesen L, Ladeby R, Nielsen HH, Toft-Hansen H, Dalmau I, Finsen B: Axonal lesion-induced microglial proliferation and microglial cluster formation in the mouse. Neuroscience 2007, 149:112–122. · DOI
- Graeber MB, López-Redondo F, Ikoma E, Ishikawa M, Imai Y, Nakajima K, Kreutzberg GW, Kohsaka S: The microglia/macrophage response in the neonatal rat facial nucleus following axotomy. Brain Res 1998, 813:241–253. · DOI
- Raivich G, Moreno-Flores MT, Möller JC, Kreutzberg GW: Inhibition of posttraumatic microglial proliferation in a genetic model of macrophage colony-stimulating factor deficiency in the mouse. Eur J Neurosci 1994, 6:1615–1618. · DOI
- Yamamoto S, Nakajima K, Kohsaka S: Macrophage-colony stimulating factor as an inducer of microglial proliferation in axotomized rat facial nucleus. J Neurochem 2010, 115:1057–1067. · DOI
- Giulian D, Ingleman JE: Colony-stimulating factors as promoters of ameboid microglia. J Neurosci 1988, 8:4707–4717. · DOI
- Ganter S, Northoff H, Männel D, Gebicke-Härter PJ: Growth control of cultured microglia. J Neurosci Res 1992, 33:218–230. · DOI
- Ringheim GE: Mitogenic effects of interleukin-5 on microglia. Neurosci Lett 1995, 201:131–134. · DOI
- Suzumura A, Sawada M, Yamamoto H, Marunouchi T: Effects of colony stimulating factors on isolated microglia in vitro. J Neuroimmunol 1990, 30:111–120. · DOI
- Suzumura A, Sawada M, Itoh Y, Marunouchi T: Interleukin-4 induces proliferation and activation of microglia but suppresses their induction of class II major histocompatibility complex antigen expression. J Neuroimmunol 1994, 53:209–218. · DOI
- Blevins G, Fedoroff S: Microglia in colony-stimulating factor 1-deficient op/op mice. J Neurosci Res 1995, 40:535–544. · DOI
- Santambrogio L, Belyanskaya SL, Fischer FR, Cipriani B, Brosnan CF, Ricciardi-Castagnoli P, Stern LJ, Strominger JL, Riese R: Developmental plasticity of CNS microglia. Proc Natl Acad Sci USA 2001, 98:6295–6300. · DOI
- Ponomarev ED, Novikova M, Maresz K, Shriver LP, Dittel BN: Development of a culture system that supports adult microglial cell proliferation and maintenance in the resting state. J Immunol Methods 2005, 300:32–46. · DOI
- Tamura T, Kong HJ, Tunyaplin C, Tsujimura H, Calame K, Ozato K: ICSBP/IRF-8 inhibits mitogenic activity of p210 Bcr/Abl in differentiating myeloid progenitor cells. Blood 2003, 102:4547–4554. · DOI
- Zhu C, Saberwal G, Lu Y, Platanias LC, Eklund EA: The interferon consensus sequence-binding protein activates transcription of the gene encoding neurofibromin 1. J Biol Chem 2004, 279:50874–50885. · DOI · Paper page
- Gabriele L, Ozato K: The role of the interferon regulatory factor (IRF) family in dendritic cell development and function. Cytokine Growth Factor Rev 2007, 18:503–510. · DOI
- Donnou S, Fisson S, Mahe D, Montoni A, Couez D: Identification of new CNS-resident macrophage subpopulation molecular markers for the discrimination with murine systemic macrophages. J Neuroimmunol 2005, 169:39–49. · DOI
- Schmid CD, Melchior B, Masek K, Puntambekar SS, Danielson PE, Lo DD, Sutcliffe JG, Carson MJ: Differential gene expression in LPS/IFNγ activated microglia and macrophages: in vitro versus in vivo. J Neurochem 2009, 1:117–125. · DOI
- De Jager PL, Jia X, Wang J, de Bakker PI, Ottoboni L, Aggarwal NT, Piccio L, Raychaudhuri S, Tran D, Aubin C, Briskin R, Romano S, International MS Genetics C, Baranzini SE, McCauley JL, Pericak-Vance MA, Haines JL, Gibson RA, Naeglin Y, Uitdehaag B, Matthews PM, Kappos L, Polman C, McArdle WL, Strachan DP, Evans D, Cross AH, Daly MJ, Compston A, Sawcer SJ, Weiner HL, Hauser SL, Hafler DA, Oksenberg JR: Meta-analysis of genome scans and replication identify CD6, IRF8 and TNFRSF1A as new multiple sclerosis susceptibility loci. Nat Genet 2009, 41:776–782. · DOI · Paper page
- Hambleton S, Salem S, Bustamante J, et al.: IRF8 mutations and human dendritic-cell immunodeficiency. N Engl J Med 2011, 365:127–138. · DOI
Cited by
Sorted by citations
Microglia and brain macrophages in the molecular age: from origin to neuropsychiatric disease
Prinz, M., & Priller, J. (2014) · Nature Reviews Neuroscience · doi:10.1038/nrn3722 · Cited by 1,329
Origin of microglia: current concepts and past controversies
Ginhoux, F., & Prinz, M. (2015) · Cold Spring Harbor Perspectives in Biology · doi:10.1101/cshperspect.a020537 · Cited by 446
Praet, J., Guglielmetti, C., Berneman, Z., Van der Linden, A., & Ponsaerts, P. (2014) · Neuroscience & Biobehavioral Reviews · doi:10.1016/j.neubiorev.2014.10.004 · Cited by 435
Factors regulating microglia activation
Kierdorf, K., & Prinz, M. (2013) · Frontiers in Cellular Neuroscience · doi:10.3389/fncel.2013.00044 · Cited by 360
Zirngibl, M., Assinck, P., Sizov, A., Caprariello, A. V., & Plemel, J. R. (2022) · Molecular Neurodegeneration · doi:10.1186/s13024-022-00538-8 · Cited by 233
Mattei, D., Ivanov, A., Ferrai, C., Jordan, P., Guneykaya, D., Buonfiglioli, A., Schaafsma, W., Przanowski, P., Deuther-Conrad, W., Brust, P., et al. (2017) · Translational Psychiatry · doi:10.1038/tp.2017.80 · Cited by 222
Pareek, S., Roy, S., Kumari, B., Jain, P., Banerjee, A., & Vrati, S. (2014) · Journal of Neuroinflammation · doi:10.1186/1742-2094-11-97 · Cited by 121
Zhou, N., Liu, K., Sun, Y., Cao, Y., & Yang, J. (2019) · Protein & Cell · doi:10.1007/s13238-018-0599-3 · Cited by 81
Dynamic Responses of Microglia in Animal Models of Multiple Sclerosis
Plastini, M. J., Desu, H. L., & Brambilla, R. (2020) · Frontiers in Cellular Neuroscience · doi:10.3389/fncel.2020.00269 · Cited by 48
Metadata
- Authors
- Horiuchi, M., Wakayama, K., Itoh, A., Kawai, K., Pleasure, D., Ozato, K., & Itoh, T.
- Venue
- Journal of Neuroinflammation
- Published
- 2012-09-28
- Volume
- 9
- Issue
- 1
- ISSN
- 1742-2094
- PMC
- PMC3546867
- Cited by
- 65
- References
- 15
- Language
- en
About these checks
Registry, retraction, Cites and statistics results are computed, not judged, with one exception: a printed reference that no index lists is read once by a model before it counts as a citation error. Claims are extracted by a model and kept only when their quote appears verbatim in the text; each cited source is then checked, with a model’s help, for whether it says what the claim relies on. Those verdicts can be wrong — read the claim’s quote and the cited source before relying on one.
Statistics and arithmetic are recomputed, not judged.
Confidence bands are shown only for fields calibrated on our annotated test set. None is calibrated yet, so no band is shown.
What counts as a claim ›How we measure confidence ›How we check this ›
Are you an author, or do you see a problem with this page? Request a review
