

The DOI matches its Crossref record; 39 of the 39 references it cites were found in a registry or an index.
Towards a comprehensive barcode library for arctic life—Ephemeroptera, Plecoptera, and Trichoptera of Churchill, Manitoba, Canada
Open accessAbstract
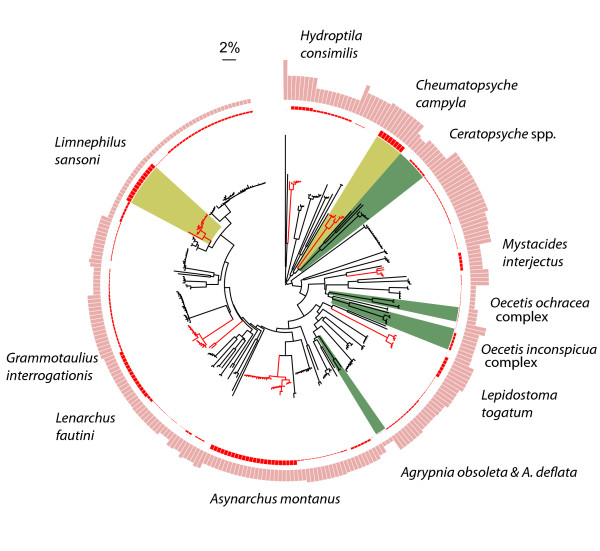
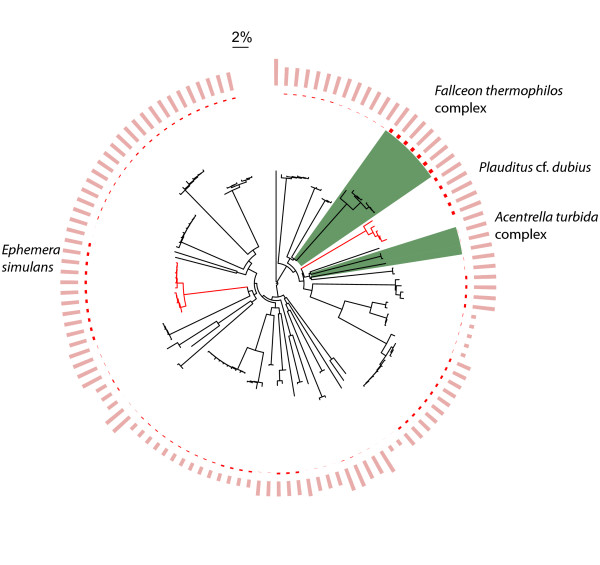
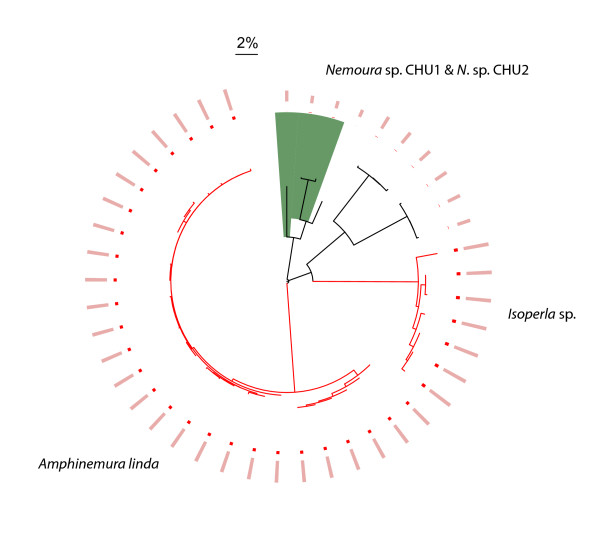
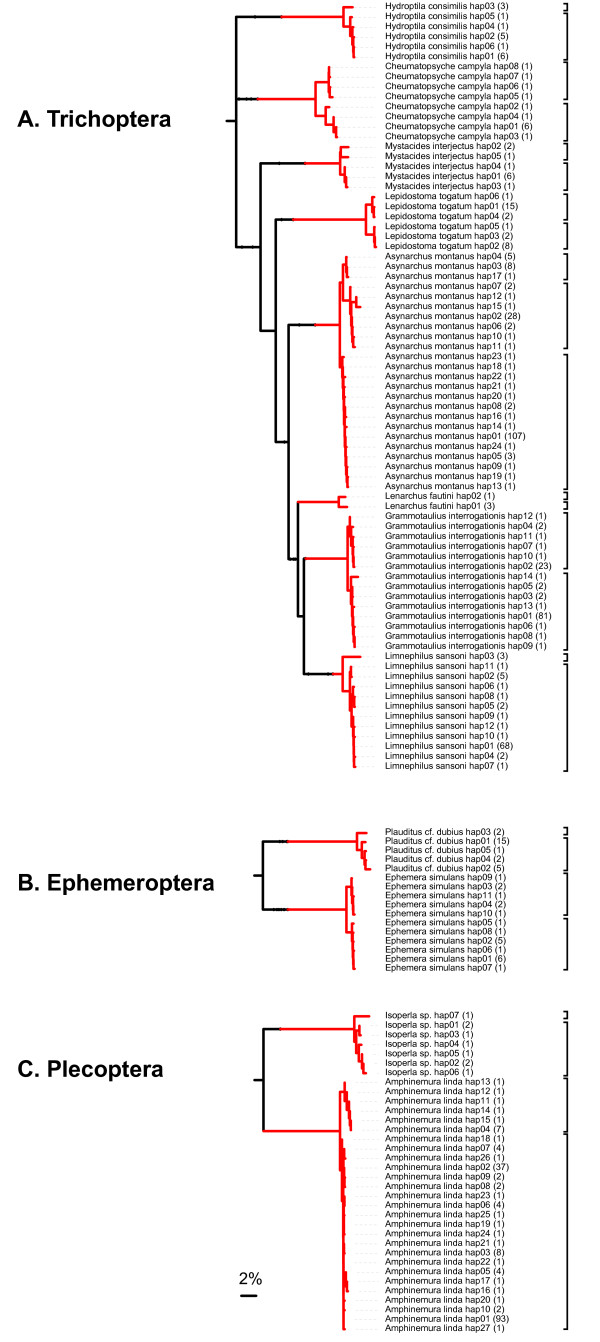
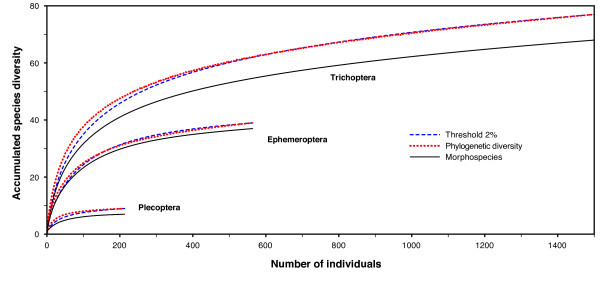
BACKGROUND: This study reports progress in assembling a DNA barcode reference library for Ephemeroptera, Plecoptera, and Trichoptera ("EPTs") from a Canadian subarctic site, which is the focus of a comprehensive biodiversity inventory using DNA barcoding. These three groups of aquatic insects exhibit a moderate level of species diversity, making them ideal for testing the feasibility of DNA barcoding for routine biotic surveys. We explore the correlation between the morphological species delineations, DNA barcode-based haplotype clusters delimited by a sequence threshold (2%), and a threshold-free approach to biodiversity quantification--phylogenetic diversity. RESULTS: A DNA barcode reference library is built for 112 EPT species for the focal region, consisting of 2277 COI sequences. Close correspondence was found between EPT morphospecies and haplotype clusters as designated using a standard threshold value. Similarly, the shapes of taxon accumulation curves based upon haplotype clusters were very similar to those generated using phylogenetic diversity accumulation curves, but were much more computationally efficient. CONCLUSION: The results of this study will facilitate other lines of research on northern EPTs and also bode well for rapidly conducting initial biodiversity assessments in unknown EPT faunas.
Overview
The claims and statistics of this paper haven’t been checked yet.
Run the check — free, no account needed. It reads the open-access text and checks the sources it cites.
Integrity signals
Registry
Cites
Statistics
Figures
Verification
Claims the paper makes
The claims and statistics of this paper haven’t been checked yet.
Run the check — free, no account needed. It reads the open-access text and checks the sources it cites.
Claims other papers make about this one
Each is checked against this paper’s own text: does it say what the citing paper says it does?
In the citing paper
“DNA barcoding allows for standardized and accurate species identification [15–18].”
Self-check
Percentages, sums and reported differences re-computed from the paper’s own numbers.
The self-check needs the paper’s full text.
Citations
Cites
R: A Language and Environment for Statistical Computing
R Core Team (2000) · doi:10.32614/r.manuals · Cited by 355,893
Kimura, M. (1980) · Journal of Molecular Evolution · doi:10.1007/bf01731581 · Cited by 29,778
MEGA4: Molecular Evolutionary Genetics Analysis (MEGA) Software Version 4.0
Tamura, K., Dudley, J. T., Nei, M., & Kumar, S. (2007) · Molecular Biology and Evolution · doi:10.1093/molbev/msm092 · Cited by 28,734
Proceedings of the National Academy of Sciences of the United States of America
Dowling, J. E., & Wald, G. (2009) · Nutrition Reviews · doi:10.1111/j.1753-4887.1981.tb06752.x · Cited by 17,937
Folmer, O., Black, M., Hoeh, W., Lutz, R., & Vrijenhoek, R. (1994) · PubMed · doi:10.5281/zenodo.15145663 · Cited by 15,546
APE: analyses of phylogenetics and evolution in R language
Paradis, E., Claude, J., & Strimmer, K. (2004) · Bioinformatics · doi:10.1093/bioinformatics/btg412 · Cited by 11,335
The genetic legacy of the Quaternary ice ages
Hewitt, G. M. (2000) · Nature · doi:10.1038/35016000 · Cited by 7,177
Gotelli, N., & Colwell, R. K. (2001) · Ecology Letters · doi:10.1046/j.1461-0248.2001.00230.x · Cited by 6,529
bold : The Barcode of Life Data System (http://www.barcodinglife.org)
RATNASINGHAM, S., & HEBERT, P. D. N. (2007) · Molecular Ecology Notes · doi:10.1111/j.1471-8286.2007.01678.x · Cited by 6,376
Self-citationConservation evaluation and phylogenetic diversity
Faith, D. (1992) · Biological Conservation · doi:10.1016/0006-3207(92)91201-3 · Cited by 5,495
Research works printed but not linked: 1
- Gaston KJ Blackburn TM Pattern and processes in macroecology 2000 Oxford: Blackwell Scientific
Cited by
Sorted by citations
Elbrecht, V., & Leese, F. (2015) · PLOS ONE · doi:10.1371/journal.pone.0130324 · Cited by 765
Cryptic biodiversity loss linked to global climate change
Bálint, M., Domisch, S., Engelhardt, C., Haase, P., Lehrian, S., Sauer, J., Theißinger, K., Pauls, S. U., & Nowak, C. (2011) · Nature Climate Change · doi:10.1038/nclimate1191 · Cited by 377
Carr, C. M., Mincks, S. L., Brown, T. M., Macdonald, T. A., & Hebert, P. D. N. (2011) · PLoS ONE · doi:10.1371/journal.pone.0022232 · Cited by 351
Self-citationGenomics in marine monitoring: New opportunities for assessing marine health status
Bourlat, S. J., Borja, Á., Gilbert, J. A., Taylor, M. I., Davies, N., Weisberg, S. B., Griffith, J. F., Lettieri, T., Field, D., Benzie, J., et al. (2013) · Marine Pollution Bulletin · doi:10.1016/j.marpolbul.2013.05.042 · Cited by 281
Short COI markers for freshwater macroinvertebrate metabarcoding
Vamos, E. E., Elbrecht, V., & Leese, F. (2017) · Metabarcoding and Metagenomics · doi:10.3897/mbmg.1.14625 · Cited by 237
Pentinsaari, M., Hebert, P. D. N., & Mutanen, M. (2014) · PLoS ONE · doi:10.1371/journal.pone.0108651 · Cited by 220
Self-citationMutanen, M., Kivelä, S. M., Vos, R. A., Doorenweerd, C., Ratnasingham, S., Hausmann, A., Huemer, P., Dincă, V., van NIEUKERKEN, E. J., López‐Vaamonde, C., et al. (2016) · Systematic Biology · doi:10.1093/sysbio/syw044 · Cited by 195
Self-citationSweeney, B. W., Battle, J. M., Jackson, J. K., & Dapkey, T. (2011) · Journal of the North American Benthological Society · doi:10.1899/10-016.1 · Cited by 180
Testing the potential of a ribosomal 16S marker for DNA metabarcoding of insects
Elbrecht, V., Taberlet, P., Déjean, T., Valentini, A., Usseglio‐Polatera, P., Beisel, J., Coissac, É., Boyer, F., & Leese, F. (2016) · PeerJ · doi:10.7717/peerj.1966 · Cited by 174
Raupach, M. J., Astrin, J. J., Hannig, K., Peters, M. K., Stoeckle, M. Y., & Wägele, J. (2010) · Frontiers in Zoology · doi:10.1186/1742-9994-7-26 · Cited by 163
Identification of herbal medicinal materials using DNA barcodes
Li, M., Cao, H., But, P. P.-H., & Shaw, P. (2011) · Journal of Systematics and Evolution · doi:10.1111/j.1759-6831.2011.00132.x · Cited by 144
Zhou, X., Jacobus, L. M., DeWalt, R. E., Adamowicz, S. J., & Hebert, P. D. N. (2010) · Journal of the North American Benthological Society · doi:10.1899/09-121.1 · Cited by 126
Self-citationA DNA Barcode Library for North American Ephemeroptera: Progress and Prospects
Webb, J. M., Jacobus, L. M., Funk, D. H., Zhou, X. Y., Kondratieff, B. C., Geraci, C. J., DeWalt, R. E., Baird, D. J., Richard, B. A., Phillips, I. D., et al. (2012) · PLoS ONE · doi:10.1371/journal.pone.0038063 · Cited by 126
Self-citationFemales do count: Documenting Chironomidae (Diptera) species diversity using DNA barcoding
Ekrem, T., Stur, E., & Hebert, P. D. N. (2010) · Organisms Diversity & Evolution · doi:10.1007/s13127-010-0034-y · Cited by 119
Self-citationdeWaard, J. R., Ratnasingham, S., Zakharov, E., Borisenko, A., Steinke, D., Telfer, A. C., Perez, K., Sones, J. E., Young, M. R., Levesque‐Beaudin, V., et al. (2019) · Scientific Data · doi:10.1038/s41597-019-0320-2 · Cited by 129
Self-citationBarcoding a Quantified Food Web: Crypsis, Concepts, Ecology and Hypotheses
Smith, M. A., Eveleigh, E. S., McCann, K. S., Merilo, M. T., McCarthy, P. C., & Rooyen, K. I. V. (2011) · PLoS ONE · doi:10.1371/journal.pone.0014424 · Cited by 107
Biodiversity and phylogeography of Arctic marine fauna: insights from molecular tools
Mincks, S. L., Carr, C. M., Hardman, M., Steinke, D., Corstorphine, E. A., & Mah, C. L. (2010) · Marine Biodiversity · doi:10.1007/s12526-010-0056-x · Cited by 109
Renaud, A. K., Savage, J., & Adamowicz, S. J. (2012) · BMC Ecology · doi:10.1186/1472-6785-12-24 · Cited by 105
Self-citationA multigene phylogeny and timeline for Trichoptera (Insecta)
Thomas, J. A., Frandsen, P. B., Prendini, E., Zhou, X. Y., & Holzenthal, R. W. (2020) · Systematic Entomology · doi:10.1111/syen.12422 · Cited by 105
Self-citationTelfer, A. C., Young, M. R., Quinn, J., Perez, K., Sobel, C. N., Sones, J. E., Levesque‐Beaudin, V., Derbyshire, R. E., Fernández-Triana, J., Rougerie, R., et al. (2015) · Biodiversity Data Journal · doi:10.3897/bdj.3.e6313 · Cited by 103
Morinière, J., Hendrich, L., Balke, M., Beermann, A. J., König, T., Hess, M., Koch, S., Müller, R., Leese, F., Hebert, P. D. N., et al. (2017) · Molecular Ecology Resources · doi:10.1111/1755-0998.12683 · Cited by 103
Self-citationThe Trichoptera barcode initiative: a strategy for generating a species-level Tree of Life
Zhou, X. Y., Frandsen, P. B., Holzenthal, R. W., Beet, C. R., Bennett, K. R., Blahnik, R. J., Bonada, N., Cartwright, D. I., Chuluunbat, S., Cocks, G. V., et al. (2016) · Philosophical Transactions of the Royal Society B Biological Sciences · doi:10.1098/rstb.2016.0025 · Cited by 91
Self-citationCurry, C. J., Gibson, J. F., Shokralla, S., Hajibabaei, M., & Baird, D. J. (2018) · Freshwater Science · doi:10.1086/696613 · Cited by 91
Faith, D. P. (2013) · Annals of the New York Academy of Sciences · doi:10.1111/nyas.12186 · Cited by 86
Pauls, S. U., Blahnik, R. J., Zhou, X. Y., Wardwell, C. T., & Holzenthal, R. W. (2010) · Journal of the North American Benthological Society · doi:10.1899/09-108.1 · Cited by 83
Self-citationRuiter, D. E., Boyle, E. E., & Zhou, X. Y. (2013) · BMC Ecology · doi:10.1186/1472-6785-13-5 · Cited by 82
Self-citationStein, E. D., White, B. P., Mazor, R. D., Miller, P. E., & Pilgrim, E. M. (2013) · PLoS ONE · doi:10.1371/journal.pone.0051273 · Cited by 82
Zhou, X. Y., Robinson, J. L., Geraci, C. J., Parker, C. R., Flint, O. S., Etnier, D. A., Ruiter, D. E., DeWalt, R. E., Jacobus, L. M., & Hebert, P. D. N. (2011) · Journal of the North American Benthological Society · doi:10.1899/10-010.1 · Cited by 81
Self-citationRevealing the Hyperdiverse Mite Fauna of Subarctic Canada through DNA Barcoding
Young, M. R., Behan‐Pelletier, V. M., & Hebert, P. D. N. (2012) · PLoS ONE · doi:10.1371/journal.pone.0048755 · Cited by 79
Self-citationPorco, D., Potapov, M. B., Bedòs, A., Buşmachiu, G., Weiner, W. M., Hamra-Kroua, S., & Deharveng, L. (2012) · PLoS ONE · doi:10.1371/journal.pone.0046056 · Cited by 79
Chen, J., Li, Q., Kong, L., & Yu, H. (2011) · PLoS ONE · doi:10.1371/journal.pone.0021326 · Cited by 77
Holzenthal, R. W., Thomson, R. E., & Ríos‐Touma, B. (2014) · Elsevier eBooks · doi:10.1016/b978-0-12-385026-3.00038-3 · Cited by 75
Stahlhut, J. K., Fernández-Triana, J., Adamowicz, S. J., Buck, M., Goulet, H., Hebert, P. D. N., Huber, J., Merilo, M. T., Sheffield, C. S., Woodcock, T., et al. (2013) · BMC Ecology · doi:10.1186/1472-6785-13-2 · Cited by 71
Self-citationDNA Barcodes and Insect Biodiversity
Floyd, R., Wilson, J., & Hebert, P. D. N. (2009) · doi:10.1002/9781444308211.ch17 · Cited by 65
Self-citationApplying plant DNA barcodes to identify species of Parnassia (Parnassiaceae)
Yang, J., WANG, Y., Möller, M., Gao, L., & Wu, D. (2011) · Molecular Ecology Resources · doi:10.1111/j.1755-0998.2011.03095.x · Cited by 58
Incorporation of DNA barcoding into a large-scale biomonitoring program: opportunities and pitfalls
Pilgrim, E. M., Jackson, S. A., Swenson, S. J., Turcsanyi, I., Friedman, E., Weigt, L. A., & Bagley, M. J. (2011) · Journal of the North American Benthological Society · doi:10.1899/10-012.1 · Cited by 57
Blagoev, G., Nikolova, N. I., Sobel, C. N., Hebert, P. D. N., & Adamowicz, S. J. (2013) · BMC Ecology · doi:10.1186/1472-6785-13-44 · Cited by 56
Self-citationBuilding a DNA barcode library of Alaska’s non-marine arthropods
Sikes, D. S., Bowser, M. L., Morton, J. M., Bickford, C., Meierotto, S., & Hildebrandt, K. (2016) · Genome · doi:10.1139/gen-2015-0203 · Cited by 55
deWaard, J. R., Hebert, P. D. N., & Humble, L. M. (2011) · PLoS ONE · doi:10.1371/journal.pone.0018290 · Cited by 54
Self-citationHassel, K., Segreto, R., & Ekrem, T. (2013) · Molecular Ecology Resources · doi:10.1111/1755-0998.12074 · Cited by 54
Jordan, S., Giersch, J. J., Muhlfeld, C. C., Hotaling, S., Fanning, L., Tappenbeck, T. H., & Luikart, G. (2016) · PLoS ONE · doi:10.1371/journal.pone.0157386 · Cited by 53
Elbrecht, V., Feld, C. K., Gies, M., Hering, D., Sondermann, M., Tollrian, R., & Leese, F. (2014) · Freshwater Science · doi:10.1086/674536 · Cited by 49
Gill, B. A., Harrington, R. A., Kondratieff, B. C., Zamudio, K. R., Poff, N. L., & Funk, W. C. (2014) · Freshwater Science · doi:10.1086/674526 · Cited by 48
White, B. P., Pilgrim, E. M., Boykin, L. M., Stein, E. D., & Mazor, R. D. (2014) · Freshwater Science · doi:10.1086/674982 · Cited by 48
Baird, D. J., Pascoe, T., Zhou, X. Y., & Hajibabaei, M. (2011) · Journal of the North American Benthological Society · doi:10.1899/10-013.1 · Cited by 47
Self-citationCommunity Phylogenetics: Assessing Tree Reconstruction Methods and the Utility of DNA Barcodes
Boyle, E. E., & Adamowicz, S. J. (2015) · PLoS ONE · doi:10.1371/journal.pone.0126662 · Cited by 42
Self-citationHernandez-Triana, L. M., Crainey, J. L., HALL, A., Fatih, F. A., Mackenzie‐Dodds, J. A., Shelley, A. J., Zhou, X. Y., Post, R. J., Gregory, T. R., & Hebert, P. D. N. (2012) · Zootaxa · doi:10.11646/zootaxa.3514.1.3 · Cited by 44
Self-citationThe diversity and biogeography of the Coleoptera of Churchill: insights from DNA barcoding
Woodcock, T. S., Boyle, E. E., Roughley, R. E., Kevan, P. G., Labbee, R. N., Smith, A. B. T., Goulet, H., Steinke, D., & Adamowicz, S. J. (2013) · BMC Ecology · doi:10.1186/1472-6785-13-40 · Cited by 43
Self-citationRaupach, M. J., Hannig, K., Morinière, J., & Hendrich, L. (2016) · ZooKeys · doi:10.3897/zookeys.592.8316 · Cited by 43
A DNA barcode database of Australia’s freshwater macroinvertebrate fauna
Carew, M. E., Nichols, S. J., Batovska, J., Clair, R. S., Murphy, N. P., Blacket, M. J., & Shackleton, M. E. (2017) · Marine and Freshwater Research · doi:10.1071/mf16304 · Cited by 41
Efficient COI barcoding using high throughput single-end 400 bp sequencing
Yang, C., Zheng, Y., Tan, S., Meng, G., Rao, W., Yang, C., Bourne, D. G., O’Brien, P. A., Xu, J., Liao, S., et al. (2020) · BMC Genomics · doi:10.1186/s12864-020-07255-w · Cited by 36
Liu, S., Yang, C., Zhou, C., & Zhou, X. Y. (2017) · GigaScience · doi:10.1093/gigascience/gix104 · Cited by 34
Self-citationRaupach, M. J., Hannig, K., Morinière, J., & Hendrich, L. (2018) · ZooKeys · doi:10.3897/zookeys.759.24129 · Cited by 34
Endemism and evolutionary history in conflict over Madagascar’s freshwater conservation priorities
Isambert, B., Bergsten, J., Monaghan, M. T., Andriamizehy, H., Ranarilalatiana, T., Ratsimbazafy, M. K., Andriniainimanana, J. R., & Vogler, A. P. (2011) · Biological Conservation · doi:10.1016/j.biocon.2011.04.016 · Cited by 33
DNA barcoding: a taxonomic point of view
DeWalt, R. E. (2011) · Journal of the North American Benthological Society · doi:10.1899/10-021.1 · Cited by 32
Self-citationCardoni, S., Tenchini, R., Ficulle, I., Piredda, R., Simeone, M. C., & Belfiore, C. (2015) · Biochemical Systematics and Ecology · doi:10.1016/j.bse.2015.07.035 · Cited by 33
DNA Barcodes and Insect Biodiversity
Wilson, J., Sing, K., Floyd, R., & Hebert, P. D. N. (2017) · Wiley eBooks · doi:10.1002/9781118945568.ch17 · Cited by 32
Self-citationGe, Y., Xia, C., Wang, J., Zhang, X., Ma, X., & Zhou, Q. (2021) · Ecology and Evolution · doi:10.1002/ece3.7470 · Cited by 29
Geraci, C. J., Al-Saffar, M. A., & Zhou, X. Y. (2011) · Journal of the North American Benthological Society · doi:10.1899/10-011.1 · Cited by 29
Self-citationKim, S., Song, K.-H., Ree, H.-L., & Kim, W. B. (2011) · Molecules and Cells · doi:10.1007/s10059-012-2151-2 · Cited by 27
Koroiva, R., Pepinelli, M., Rodrigues, M. É., Roque, F. D. O., Lorenz, A. P., & Kvist, S. (2017) · PLoS ONE · doi:10.1371/journal.pone.0182283 · Cited by 28
Exploring species boundaries with multiple genetic loci using empirical data from non‐biting midges
Lin, X., Stur, E., & Ekrem, T. (2018) · Zoologica Scripta · doi:10.1111/zsc.12280 · Cited by 26
Laforest, B. J., Winegardner, A. K., Zaheer, O. A., Jeffery, N. W., Boyle, E. E., & Adamowicz, S. J. (2013) · BMC Ecology · doi:10.1186/1472-6785-13-13 · Cited by 26
Self-citationSantos, A. P. M., Takiya, D. M., & Nessimian, J. L. (2016) · PeerJ · doi:10.7717/peerj.2009 · Cited by 25
Avelino-Capistrano, F., Nessimian, J. L., Mallet, J. R. D. S., & Takiya, D. M. (2014) · Freshwater Science · doi:10.1086/675226 · Cited by 26
Suh, K. I., Hwang, J. M., Bae, Y. J., & Kang, J. H. (2019) · Entomological Research · doi:10.1111/1748-5967.12334 · Cited by 23
Gattolliat, J., Vinçon, G., Wyler, S., Pawlowski, J. W., & Sartori, M. (2016) · Zoosymposia · doi:10.11646/zoosymposia.11.1.15 · Cited by 23
Hrivniak, Ľ., Sroka, P., Godunko, R. J., & Žurovcová, M. (2017) · Zootaxa · doi:10.11646/zootaxa.4341.3.2 · Cited by 22
Kranzfelder, P., Ekrem, T., & Stur, E. (2017) · Journal of Insect Science · doi:10.1093/jisesa/iex075 · Cited by 21
Cordero, R. D., Ramirez, S. S., & Currie, D. C. (2016) · Polar Biology · doi:10.1007/s00300-016-2062-3 · Cited by 21
Towards an Iberian DNA barcode reference library of freshwater macroinvertebrates and fishes
Múrria, C., Somma, S., Wangensteen, O. S., Arnedo, M. A., & Prat, N. (2020) · Limnetica · doi:10.23818/limn.39.06 · Cited by 22
Gill, B. A., Sandberg, J. B., & Kondratieff, B. C. (2015) · Zenodo (CERN European Organization for Nuclear Research) · doi:10.5281/zenodo.4757714 · Cited by 21
Langat, S. K., Eyase, F. L., Bulimo, W., Lutomiah, J., Oyola, S. O., Imbuga, M., & Sang, R. C. (2021) · mSphere · doi:10.1128/msphere.00551-21 · Cited by 20
Taxonomic resolution based on DNA barcoding affects environmental signal in metacommunity structure
Martin, G. K., Adamowicz, S. J., & Cottenie, K. (2016) · Freshwater Science · doi:10.1086/686260 · Cited by 20
Self-citationAnts in Australia’s Monsoonal Tropics: CO1 Barcoding Reveals Extensive Unrecognised Diversity
Oberprieler, S. K., Andersen, A. N., & Moritz, C. C. (2018) · Diversity · doi:10.3390/d10020036 · Cited by 17
Dénes, A., Kolcsár, L., Török, E., & Keresztes, L. (2015) · Biological Journal of the Linnean Society · doi:10.1111/bij.12667 · Cited by 16
Jo, J., Lee, H.-G., Kim, K. Y., & Park, C. (2019) · ALGAE · doi:10.4490/algae.2019.34.2.26 · Cited by 17
Mutanen, M., Aarvik, L., Huemer, P., Kaila, L., Karsholt, O., & Tuck, K. (2012) · Zenodo (CERN European Organization for Nuclear Research) · doi:10.5281/zenodo.208387 · Cited by 15
Macko, P., Derka, T., Čiamporová‐Zaťovičová, Z., Grabowski, M., & ČIAMPOR, F. J. (2024) · Molecular Ecology Resources · doi:10.1111/1755-0998.13954 · Cited by 17
DNA barcoding of mayflies (Insecta: Ephemeroptera) from South India
Selvakumar, C., Sivaramakrishnan, K. G., & Janarthanan, S. (2016) · Mitochondrial DNA Part B · doi:10.1080/23802359.2016.1219623 · Cited by 14
Aquatic insect conservation: a molecular genetic approach
Sivaramakrishnan, K. G., Janarthanan, S., Selvakumar, C., & Arumugam, M. (2014) · Conservation Genetics Resources · doi:10.1007/s12686-014-0250-4 · Cited by 12
The importance of taxonomic resolution for additive beta diversity as revealed through DNA barcoding
Bringloe, T. T., Cottenie, K., Martin, G. K., & Adamowicz, S. J. (2016) · Genome · doi:10.1139/gen-2016-0080 · Cited by 13
Self-citationdeWaard, J. R., Ratnasingham, S., Zakharov, E., Borisenko, A., Steinke, D., Telfer, A. C., Perez, K. H. J., Sones, J. E., Young, M. R., Levesque‐Beaudin, V., et al. (2019) · bioRxiv (Cold Spring Harbor Laboratory) · doi:10.1101/701805 · Cited by 13
Self-citationYoung, M. K., Smith, R. J., Pilgrim, K. L., Fairchild, M. P., & Schwartz, M. K. (2019) · Ecology and Evolution · doi:10.1002/ece3.4852 · Cited by 12
Balke, M., Hendrich, L., Toussaint, E. F. A., Zhou, X. Y., von Rintelen, T., & de Bruyn, M. (2013) · Journal of Limnology · doi:10.4081/jlimnol.2013.s2.e4 · Cited by 12
Self-citationOssa‐López, P. A., Camargo‐Mathias, M. I., & Rivera‐Páez, F. A. (2017) · Hydrobiologia · doi:10.1007/s10750-017-3321-1 · Cited by 12
Erasmus, D. J. (2021) · Biochemistry and Molecular Biology Education · doi:10.1002/bmb.21492 · Cited by 12
Souto, P., da Silveira, L. F. L., Takiya, D. M., & Salles, F. F. (2021) · Systematics and Biodiversity · doi:10.1080/14772000.2021.1933248 · Cited by 10
DNA barcoding in floral and faunal research
Miller, S. E. (2014) · Cambridge University Press eBooks · doi:10.1017/cbo9781139028004.028 · Cited by 9
Cordero, R. D., Ramirez, S. S., & Currie, D. C. (2017) · Polar Biology · doi:10.1007/s00300-017-2078-3 · Cited by 9
Graham, M. R., Стоев, П., Akkari, N., Blagoev, G., & Fet, V. (2012) · Research at the University of Copenhagen (University of Copenhagen) · Cited by 8
Sh, H. R., Struwe, J.-F., Raupach, M. J., AHRENS, D. C., & Wägele, J. W. (2013) · Zoological Journal of the Linnean Society · doi:10.1111/zoj.12053 · Cited by 8
Kondratieff, B. C., DeWalt, R. E., & Verdone, C. J. (2019) · ZooKeys · doi:10.3897/zookeys.819.23535 · Cited by 7
Self-citationDNA barcoding of stoneflies (Plecoptera) in a general genetics course
Elwess, N. L., Latourelle, S. M., & Myers, L. (2017) · Journal of Biological Education · doi:10.1080/00219266.2017.1403359 · Cited by 11
Sarı, A., Duran, M., & Bardakçi, F. (2012) · Cited by 7
Insect Biodiversity in the Arctic
Hodkinson, I. D. (2018) · doi:10.1002/9781118945582.ch2 · Cited by 7
Al-Qurashi, A. S., Mashaly, A., Alajmi, R. A., Al-Khalifa, M. S., Mansour, L. A., Alomar, S. Y., Sharaf, M. R., Aldawood, A. S., Dhafer, H. M. A., Hunter, T., et al. (2023) · Journal of Medical Entomology · doi:10.1093/jme/tjad162 · Cited by 6
Species Delimitation of Scavenger Flies in the Valley of Mexico
Pedraza‐Lara, C., Garduño-Sánchez, M. A., Téllez-García, I., Rodríguez-González, S., Nuple-Juárez, E., & Guardado-Estrada, M. (2021) · Journal of Medical Entomology · doi:10.1093/jme/tjab094 · Cited by 6
Metadata
- Authors
- Zhou, X., Adamowicz, S. J., Jacobus, L. M., DeWalt, R. E., & Hebert, P. D.
- Affiliations
- University of Guelph (CA)
- Indiana University Bloomington (US)
- Illinois Natural History Survey (US)
- Corresponding author
- Zhou, Xin
- Venue
- Frontiers in Zoology
- Published
- 2009
- Volume
- 6
- Issue
- 1
- Pages
- 30
- ISSN
- 1742-9994 (ISSN-L)
- PMC
- PMC2800108
- OpenAlex
- W1965466602
- Cited by
- 153
- References
- 38
- Citations by year
- 2026: 5 · 2025: 4 · 2024: 6 · 2023: 2 · 2022: 5 · 2021: 8 · 2020: 8 · 2019: 11 · 2018: 11 · 2017: 13 · 2016: 16 · 2015: 8 · 2014: 13 · 2013: 11 · 2012: 9
- FWCI
- 9.32
- Type
- journal article
- Language
- en
- Open access
- gold
- doi.org
- Licence
- cc-by
- Locations
- Frontiers in Zoology (publishedVersion, cc-by)
- PubMed Central (publishedVersion, cc-by)
- PubMed (publishedVersion)
- DOAJ (DOAJ: Directory of Open Access Journals) (submittedVersion, cc-by-sa)
- Funders
- Purdue University
- Clemson University
- University of Minnesota
- Genome Canada
- Ontario Genomics
- Ontario Genomics Institute
- Imperial College London
- Natural Sciences and Engineering Research Council of Canada
- Topics
- Physical Sciences › Environmental Science › Ecology › Environmental DNA in Biodiversity Studies
- Life Sciences › Agricultural and Biological Sciences › Ecology, Evolution, Behavior and Systematics › Invertebrate Taxonomy and Ecology
- Physical Sciences › Environmental Science › Ecology › Freshwater macroinvertebrate diversity and ecology
- Keywords
- DNA barcoding, Ephemeroptera, Plecoptera, Trichoptera, phylogenetic diversity, species delimitation, Churchill, Manitoba, biodiversity survey
About these checks
Registry, retraction, Cites and statistics results are computed, not judged, with one exception: a printed reference that no index lists is read once by a model before it counts as a citation error. Claims are extracted by a model and kept only when their quote appears verbatim in the text; each cited source is then checked, with a model’s help, for whether it says what the claim relies on. Those verdicts can be wrong — read the claim’s quote and the cited source before relying on one.
Statistics and arithmetic are recomputed, not judged.
Confidence bands are shown only for fields calibrated on our annotated test set. None is calibrated yet, so no band is shown.
What counts as a claim ›How we measure confidence ›How we check this ›
Are you an author, or do you see a problem with this page? Request a review
