Cited by 118Alzheimer's disease research and treatmentsDementia and Cognitive Impairment ResearchNeuroinflammation and Neurodegeneration Mechanisms

The DOI matches its Crossref record; 103 of the 103 references it cites were found in a registry or an index.

ApoE4 induces Aβ42, tau, and neuronal pathology in the hippocampus of young targeted replacement apoE4 mice

Open access
Liraz, Ori, Boehm-Cagan, Anat, Michaelson, Daniel M·2013·Molecular Neurodegeneration

Abstract

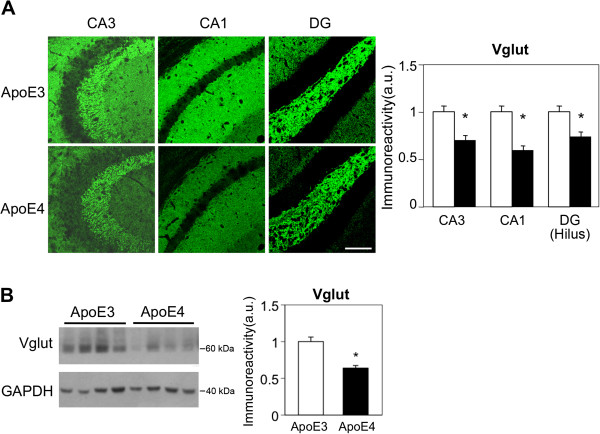
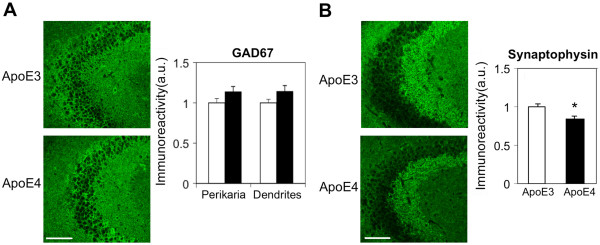
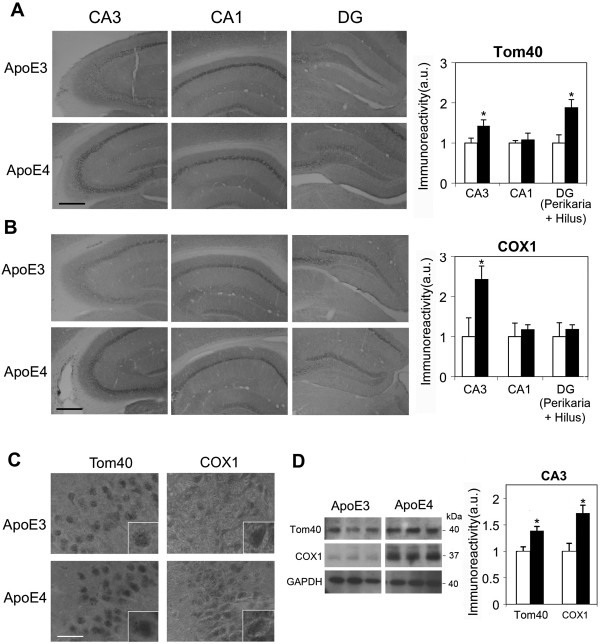
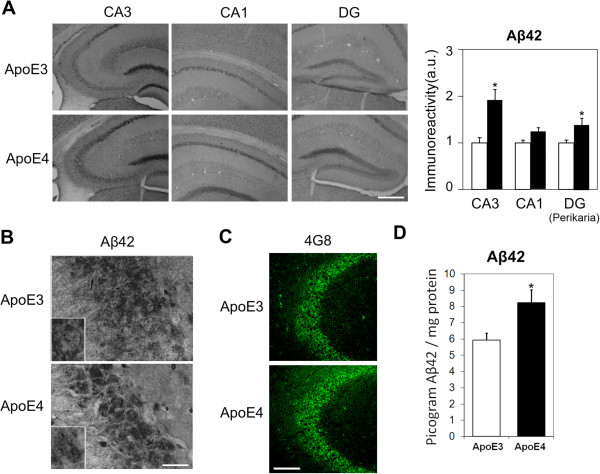
Background: Recent findings suggest that the pathological effects of apoE4, the most prevalent genetic risk factor for Alzheimer’s disease (AD), start many years before the onset of the disease and are already detectable at a young age. In the present study we investigated the extent to which such pathological and cognitive impairments also occur in young apoE4 mice. Results: This study revealed that the levels of the presynaptic glutamatergic vesicular transporter, VGlut, in the CA3, CA1, and DG hippocampal subfields were lower in hippocampal neurons of young (4-month-old) apoE4-targeted replacement mice than in those of the apoE3 mice. In contrast, the corresponding inhibitory GABAergic nerve terminals and perikarya were not affected by apoE4. This synaptic effect was associated with hyperphosphorylation of tau in these neurons. In addition, apoE4 increased the accumulation of neuronal Aβ42 and induced mitochondrial changes, both of which were specifically pronounced in CA3 neurons. Spatial navigation behavioral studies revealed that these hippocampal pathological effects of apoE4 are associated with corresponding behavioral impairments. Time-course studies revealed that the effects of apoE4 on tau hyperphosphorylation and the mitochondria were already apparent at the age of 1 month and that the apoE4-driven accumulation of neuronal Aβ and reduced VGlut levels evolve later and are apparent at the age of 2–4 months. Furthermore, the levels of tau phosphorylation decrease in apoE3 mice and increase in apoE4 mice between 1 and 4 months, whereas the levels of Aβ42 decrease in apoE3 mice and are not affected in apoE4 mice over the same time period. Conclusions: These findings show that apoE4 stimulates the accumulation of Aβ42 and hyperphosphorylated tau and reduces the levels of VGlut in hippocampal neurons of young apoE4-targeted replacement mice and that these neurochemical effects are associated with cognitive impairments. This model is not associated with hypothesis-driven mechanistic manipulations and is thus most suitable for unbiased studies of the mechanisms underlying the pathological effects of apoE4.

Overview

The claims and statistics of this paper haven’t been checked yet.

Run the check — free, no account needed. It reads the open-access text and checks the sources it cites.

A few free checks a day · papers already verified open instantly · results are public

Integrity signals

Registry

Crossref · 10.1186/1750-1326-8-16

Cites

103 of 103 references verified0 citation errors · 0 not checkable

Statistics

Figures

Figure 1 The levels of the presynaptic gutamatergic transporter VGlut in hippocampal neurons of 4-month-old apoE3 and apoE4 mice. (A) VGlut1 immunohistochemistry. Representative images (X20 magnification) of the indicated hippocampal subfields are presented on the left. Quantification of the results (mean ± SEM: n=20 per group) of apoE3 mice (white bars) and apoE4 mice (black bars) was performed by computerized image analysis as described in Materials and Methods and is shown on the right. *p<0.001 (for comparison of the results of the apoE4 and apoE3 mice). Scale = 120 μ. (B) VGlut immunoblot. Representative immunoblots of homogenates of whole hippocampi of apoE3 and apoE4 mice are presented on the left together with the GAPDH standard. Quantification of the results (mean ± SEM; n=10 per group) of apoE3 mice (white bars) and apoE4 mice (black bars) is depicted on the right. *p<0.001.
Figure 1 The levels of the presynaptic gutamatergic transporter VGlut in hippocampal neurons of 4-month-old apoE3 and apoE4 mice. (A) VGlut1 immunohistochemistry. Representative images (X20 magnification) of the indicated hippocampal subfields are presented on the left. Quantification of the results (mean ± SEM: n=20 per group) of apoE3 mice (white bars) and apoE4 mice (black bars) was performed by computerized image analysis as described in Materials and Methods and is shown on the right. *p<0.001 (for comparison of the results of the apoE4 and apoE3 mice). Scale = 120 μ. (B) VGlut immunoblot. Representative immunoblots of homogenates of whole hippocampi of apoE3 and apoE4 mice are presented on the left together with the GAPDH standard. Quantification of the results (mean ± SEM; n=10 per group) of apoE3 mice (white bars) and apoE4 mice (black bars) is depicted on the right. *p<0.001.CC BY · PubMed Central
Figure 2 The levels of inhibitory neurons and synapses (GAD67) and of the presynaptic marker synaptophysin in 4-month-old apoE3 and apoE4 mice. (A) GAD67 immunohistochemistry. Representative images (X20 magnification) of the CA3 subfield are presented on the left. Quantification of the results in the corresponding perikarya and dendritic fields (mean ± SEM; n=20 per group) of apoE3 mice (white bars) and apoE4 mice (black bars) is shown on the right. Scale = 120 μ. (B) Synaptophysin immunohistochemistry. Representative images (X20 magnification) of the CA3 subfield are presented on the left. Quantification of the results (mean ± SEM; n=20 per group) of apoE3 mice (white bars) and apoE4 mice (black bars) is shown on the right. Quantification of the GAD67 and synaptophysin immunohistochemical results was performed by computerized image analysis, as described in Materials and Methods. *p<0.005. Scale = 120 μ.
Figure 2 The levels of inhibitory neurons and synapses (GAD67) and of the presynaptic marker synaptophysin in 4-month-old apoE3 and apoE4 mice. (A) GAD67 immunohistochemistry. Representative images (X20 magnification) of the CA3 subfield are presented on the left. Quantification of the results in the corresponding perikarya and dendritic fields (mean ± SEM; n=20 per group) of apoE3 mice (white bars) and apoE4 mice (black bars) is shown on the right. Scale = 120 μ. (B) Synaptophysin immunohistochemistry. Representative images (X20 magnification) of the CA3 subfield are presented on the left. Quantification of the results (mean ± SEM; n=20 per group) of apoE3 mice (white bars) and apoE4 mice (black bars) is shown on the right. Quantification of the GAD67 and synaptophysin immunohistochemical results was performed by computerized image analysis, as described in Materials and Methods. *p<0.005. Scale = 120 μ.CC BY · PubMed Central
Figure 3 The levels of the mitochondrial proteins Tom40 and COX1 in hippocampal neurons of 4-month-old apoE3 and apoE4 mice. (A) Tom40 immunohistochemistry. Representative images (X10 magnification) of the indicated hippocampal subfields are presented on the left. Quantification of the results (mean ± SEM; n=8 per group) of apoE3 mice (white bars) and apoE4 mice (black bars) is shown on the right. *p<0.05. Scale = 350 μ. (B) COX1 immunohistochemistry. Representative images (X10 magnification) of the indicated hippocampal subfields are presented on the left. Quantification of the results (mean ± SEM; n=8 per group) of apoE3 mice (white bars) and apoE4 mice (black bars) is shown on the right. *p<0.05. Scale = 350 μ. Quantification of the Tom40 and COX1 results was performed by computerized image analysis, as described in Materials and Methods. (C) Representative images of CA3 at X100 magnification are shown. Scale = 30 μ. Inserts depict selected neurons at X2 magnification. (D) Tom40 and COX1 immunoblots. Representative immunoblots of homogenates of hippocampal CA3 neurons of apoE3 and apoE4 mice are presented on the left together with the GAPDH standard. Quantification of the results (mean ± SEM; n=5 per group) of apoE3 mice (white bars) and apoE4 mice (black bars) is depicted on the right. *p<0.05.
Figure 3 The levels of the mitochondrial proteins Tom40 and COX1 in hippocampal neurons of 4-month-old apoE3 and apoE4 mice. (A) Tom40 immunohistochemistry. Representative images (X10 magnification) of the indicated hippocampal subfields are presented on the left. Quantification of the results (mean ± SEM; n=8 per group) of apoE3 mice (white bars) and apoE4 mice (black bars) is shown on the right. *p<0.05. Scale = 350 μ. (B) COX1 immunohistochemistry. Representative images (X10 magnification) of the indicated hippocampal subfields are presented on the left. Quantification of the results (mean ± SEM; n=8 per group) of apoE3 mice (white bars) and apoE4 mice (black bars) is shown on the right. *p<0.05. Scale = 350 μ. Quantification of the Tom40 and COX1 results was performed by computerized image analysis, as described in Materials and Methods. (C) Representative images of CA3 at X100 magnification are shown. Scale = 30 μ. Inserts depict selected neurons at X2 magnification. (D) Tom40 and COX1 immunoblots. Representative immunoblots of homogenates of hippocampal CA3 neurons of apoE3 and apoE4 mice are presented on the left together with the GAPDH standard. Quantification of the results (mean ± SEM; n=5 per group) of apoE3 mice (white bars) and apoE4 mice (black bars) is depicted on the right. *p<0.05.CC BY · PubMed Central
Figure 4 The levels of Aβ42 in hippocampal neurons of 4-month-old apoE3 and apoE4 mice. (A) Representative images (X10 magnification) of the indicated hippocampal fields stained with anti-Aβ42 are presented on the left. Quantification of the results (mean ± SEM; n=20 per group) of apoE3 mice (white bars) and apoE4 mice (black bars) was performed by computerized image analysis, as described in Materials and Methods, and is shown on the right. *p<0.05. Scale = 350 μ. (B) Representative images of CA3 at X100 magnification are shown. Scale = 30 μ. Inserts depict selected neurons at X2 magnification. (C) Representative confocal images (X20 magnification) of the CA3 subfield of apoE3 and apoE4 mice stained with the pan anti-Aβ Ab 4G8. Scale = 120 μ. (D) Aβ X-42 ELISA. Quantification of Aβ42 levels in 4-month-old apoE3 and apoE4 mice was performed utilizing an ELISA kit. Results are presented as pictograms of Aβ42 per hippocampus. *p<0.05
Figure 4 The levels of Aβ42 in hippocampal neurons of 4-month-old apoE3 and apoE4 mice. (A) Representative images (X10 magnification) of the indicated hippocampal fields stained with anti-Aβ42 are presented on the left. Quantification of the results (mean ± SEM; n=20 per group) of apoE3 mice (white bars) and apoE4 mice (black bars) was performed by computerized image analysis, as described in Materials and Methods, and is shown on the right. *p<0.05. Scale = 350 μ. (B) Representative images of CA3 at X100 magnification are shown. Scale = 30 μ. Inserts depict selected neurons at X2 magnification. (C) Representative confocal images (X20 magnification) of the CA3 subfield of apoE3 and apoE4 mice stained with the pan anti-Aβ Ab 4G8. Scale = 120 μ. (D) Aβ X-42 ELISA. Quantification of Aβ42 levels in 4-month-old apoE3 and apoE4 mice was performed utilizing an ELISA kit. Results are presented as pictograms of Aβ42 per hippocampus. *p<0.05CC BY · PubMed Central
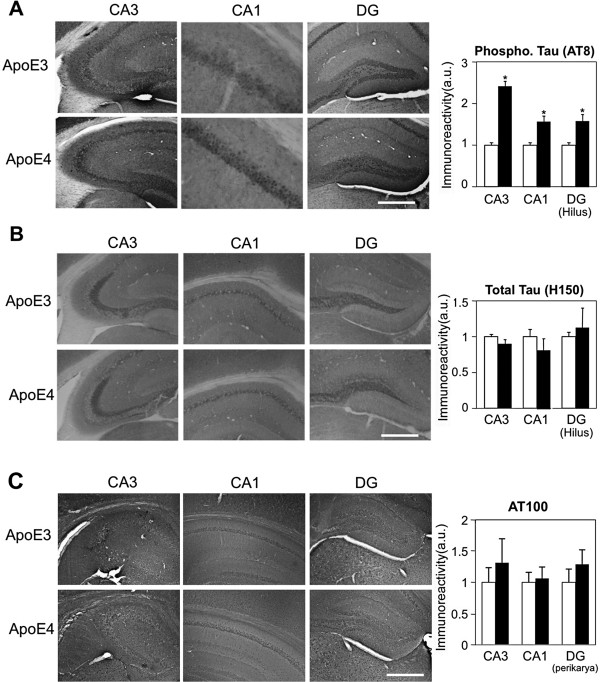
Figure 5 Immunohistochemistry of tau phosphorylation and total tau levels in hippocampal neurons of 4-month-old apoE3 and apoE4 mice. (A) Tau phosphorylation immunohistochemistry utilizing AT-8. Representative images (X10 magnification) of the indicated hippocampal subfields are presented on the left. Quantification of the results (mean ± SEM; n=20 per group) of apoE3 mice (white bars) and apoE4 mice (black bars) was performed by computerized image analysis, as described in Materials and Methods, and is shown on the right. *p<0.001. Scale = 350 μ. (B) Total tau levels immunohistochemistry utilizing H150. Representative images (X10 magnification) of the indicated hippocampal subfields are presented on the left. Quantification of the results (mean ± SEM; n=20 per group) of apoE3 mice (white bars) and apoE4 mice (black bars) was performed by computerized image analysis, and is shown on the right. Scale = 350 μ. (C) Tau phosphorylation immunohistochemistry utilizing AT100. Representative images (X10 magnification) of the indicated hippocampal subfields are presented on the left. Quantification of the results (mean ± SEM; n=6 per group) of apoE3 mice (white bars) and apoE4 mice (black bars) was performed by computerized image analysis, and is shown on the right. Scale = 350 μ.
Figure 5 Immunohistochemistry of tau phosphorylation and total tau levels in hippocampal neurons of 4-month-old apoE3 and apoE4 mice. (A) Tau phosphorylation immunohistochemistry utilizing AT-8. Representative images (X10 magnification) of the indicated hippocampal subfields are presented on the left. Quantification of the results (mean ± SEM; n=20 per group) of apoE3 mice (white bars) and apoE4 mice (black bars) was performed by computerized image analysis, as described in Materials and Methods, and is shown on the right. *p<0.001. Scale = 350 μ. (B) Total tau levels immunohistochemistry utilizing H150. Representative images (X10 magnification) of the indicated hippocampal subfields are presented on the left. Quantification of the results (mean ± SEM; n=20 per group) of apoE3 mice (white bars) and apoE4 mice (black bars) was performed by computerized image analysis, and is shown on the right. Scale = 350 μ. (C) Tau phosphorylation immunohistochemistry utilizing AT100. Representative images (X10 magnification) of the indicated hippocampal subfields are presented on the left. Quantification of the results (mean ± SEM; n=6 per group) of apoE3 mice (white bars) and apoE4 mice (black bars) was performed by computerized image analysis, and is shown on the right. Scale = 350 μ.CC BY · PubMed Central
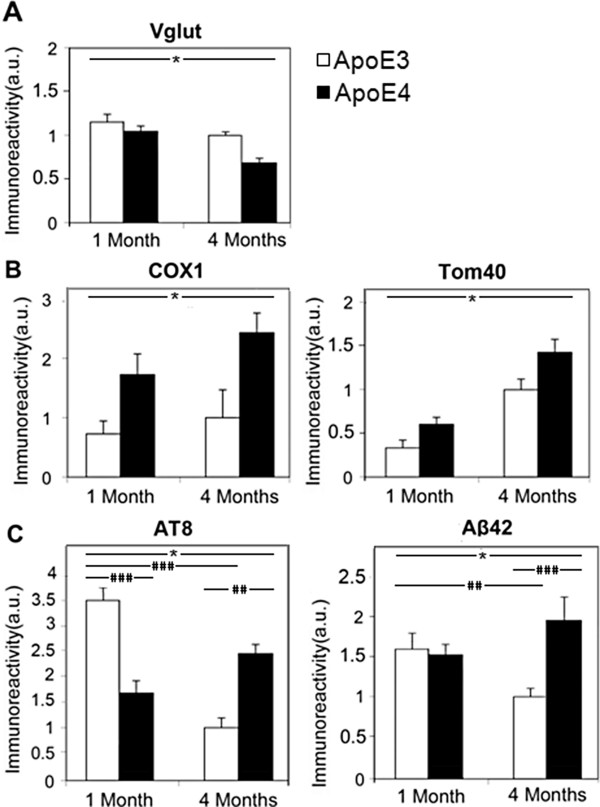
Figure 6 Time course of the effects of the apoE genotype in CA3 neurons of 1- and 4-month-old apoE3 and apoE4 mice. (A) The levels of VGlut in apoE3 (white bars) and apoE4 (black bars) mice. *p<0.02 for the effect of apoE genotype and p<0.005 for the effect of age. (B) The levels of the mitochondrial markers COX1 (left) and Tom40 (right) in apoE3 (white bars) and apoE4 (black bars) mice. *p<0.01 and p<0.002 of the effect for apoE genotype on Tom40 and COX1 levels, respectively, and p<0.001 for the effect of age on Tom40. (C) The levels of AT8 phosphorylated tau (left) and Aβ42 (right) in apoE3 (white bars) and apoE4 (black bars) mice. Two-way ANOVA revealed a significant effect for genotype×age for both the AT8 (p<0.0001) and Aβ42 (p<0.01) results. The significant post hoc comparisons of the effects of age and genotype are denoted by the hash marks as follows: #p<0.05, ##p<0.01 and ###p<0.001. Results in each of the panels (n=8 mice per group) were obtained at the same time and are presented relative to the 4-month-old apoE3 group.
Figure 6 Time course of the effects of the apoE genotype in CA3 neurons of 1- and 4-month-old apoE3 and apoE4 mice. (A) The levels of VGlut in apoE3 (white bars) and apoE4 (black bars) mice. *p<0.02 for the effect of apoE genotype and p<0.005 for the effect of age. (B) The levels of the mitochondrial markers COX1 (left) and Tom40 (right) in apoE3 (white bars) and apoE4 (black bars) mice. *p<0.01 and p<0.002 of the effect for apoE genotype on Tom40 and COX1 levels, respectively, and p<0.001 for the effect of age on Tom40. (C) The levels of AT8 phosphorylated tau (left) and Aβ42 (right) in apoE3 (white bars) and apoE4 (black bars) mice. Two-way ANOVA revealed a significant effect for genotype×age for both the AT8 (p<0.0001) and Aβ42 (p<0.01) results. The significant post hoc comparisons of the effects of age and genotype are denoted by the hash marks as follows: #p<0.05, ##p<0.01 and ###p<0.001. Results in each of the panels (n=8 mice per group) were obtained at the same time and are presented relative to the 4-month-old apoE3 group.CC BY · PubMed Central
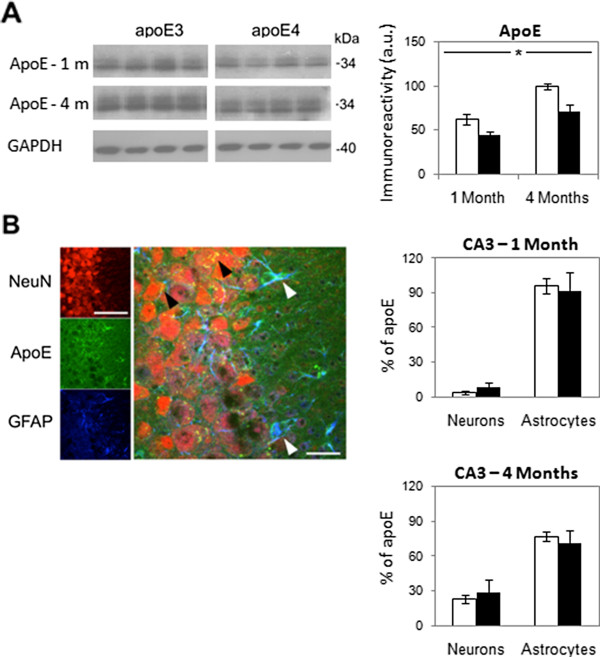
Figure 7 The levels and spatial distribution of apoE in the hippocampus of 1- and 4-month-old apoE3 and apoE4 mice. (A) ApoE immunoblots. Representative immunoblots of homogenates of whole hippocampi of 1- and 4-month-old apoE3 and apoE4 mice are presented on the left together with the GAPDH standard. Quantification of the results (mean ± SEM; n=6 per group) of apoE3 mice (white bars) and apoE4 mice (black bars) is depicted on the right. *p<0.05. (B) Confocal microscopy utilizing the apoE (green); neuronal marker NeuN (red); and GFAP (blue) antibodies. A representative section of the individual immunostainings and their superposition is presented. Colocalization of apoE with astrocytes is shown in light blue in the right panel (white arrowheads), whereas colocalization of apoE with neurons is shown in yellow (black arrowheads). Quantification of the relative percentage of apoE colocalized respectively with neurons and astrocytes (mean ± SEM; n=6 per group) in 1- and 4-month-old apoE3 mice (white bars) and apoE4 mice (black bars) was performed by computerized image analysis, as described in Materials and Methods, is presented on the right. Scale for left panel = 120 μ. Scale for the middle panel = 40 μ.
Figure 7 The levels and spatial distribution of apoE in the hippocampus of 1- and 4-month-old apoE3 and apoE4 mice. (A) ApoE immunoblots. Representative immunoblots of homogenates of whole hippocampi of 1- and 4-month-old apoE3 and apoE4 mice are presented on the left together with the GAPDH standard. Quantification of the results (mean ± SEM; n=6 per group) of apoE3 mice (white bars) and apoE4 mice (black bars) is depicted on the right. *p<0.05. (B) Confocal microscopy utilizing the apoE (green); neuronal marker NeuN (red); and GFAP (blue) antibodies. A representative section of the individual immunostainings and their superposition is presented. Colocalization of apoE with astrocytes is shown in light blue in the right panel (white arrowheads), whereas colocalization of apoE with neurons is shown in yellow (black arrowheads). Quantification of the relative percentage of apoE colocalized respectively with neurons and astrocytes (mean ± SEM; n=6 per group) in 1- and 4-month-old apoE3 mice (white bars) and apoE4 mice (black bars) was performed by computerized image analysis, as described in Materials and Methods, is presented on the right. Scale for left panel = 120 μ. Scale for the middle panel = 40 μ.CC BY · PubMed Central
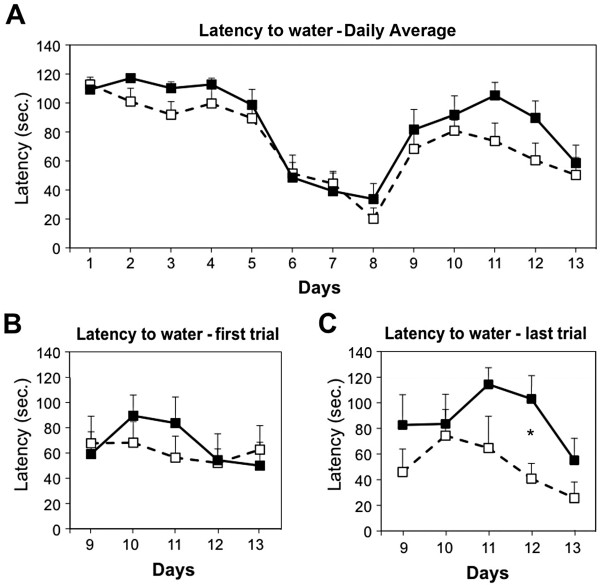
Figure 8 Performance in the dry version of the Morris water maze of 4-month-old apoE3 and apoE4 mice. (A) Average latency to the water. Daily averages (4 runs per day) of apoE3 (white squares) and apoE4 (black squares) mice (n=7 per group) for 8 days with the water-filled well in the first location and following the change in the position of the water-filled well (days 9–13). (B) Latency of the first run of each day (days 9–13). (C) Latency of the last run of each day (days 9–13). *p<0.05. ANOVA reaveled a significant effect for genotype×trial (p<0.05).
Figure 8 Performance in the dry version of the Morris water maze of 4-month-old apoE3 and apoE4 mice. (A) Average latency to the water. Daily averages (4 runs per day) of apoE3 (white squares) and apoE4 (black squares) mice (n=7 per group) for 8 days with the water-filled well in the first location and following the change in the position of the water-filled well (days 9–13). (B) Latency of the first run of each day (days 9–13). (C) Latency of the last run of each day (days 9–13). *p<0.05. ANOVA reaveled a significant effect for genotype×trial (p<0.05).CC BY · PubMed Central

Verification

Claims the paper makes

The claims and statistics of this paper haven’t been checked yet.

Run the check — free, no account needed. It reads the open-access text and checks the sources it cites.

A few free checks a day · papers already verified open instantly · results are public

Claims other papers make about this one

Each is checked against this paper’s own text: does it say what the citing paper says it does?

Self-check

Percentages, sums and reported differences re-computed from the paper’s own numbers.

The self-check needs the paper’s full text.

Citations

Cites

Show all 103 references

Research works printed but not linked: 1

  1. Michaelson DM, Ishai L, Ori L, Anat B, Alex N: Counteracting the pathological effects of apoE4 in vivo with anti apoE4 mAbs. ApoE, ApoE Receptors & Neurodegeneration Symposium; Mayo Clinic Jacksonville Florida. 2012

Cited by

Sorted by citations

See all 118

Metadata

Authors
Liraz, O., Boehm-Cagan, A., & Michaelson, D. M.
Affiliations
Tel Aviv University (IL)
Corresponding author
Michaelson, Daniel M
Venue
Molecular Neurodegeneration
Published
2013-05-17
Volume
8
Issue
1
Pages
16-16
ISSN
1750-1326 (ISSN-L)
OpenAlex
W2096068616
Cited by
118
References
103
Citations by year
2026: 7 · 2025: 14 · 2024: 11 · 2023: 6 · 2022: 5 · 2021: 10 · 2020: 7 · 2019: 12 · 2018: 7 · 2017: 10 · 2016: 9 · 2015: 7 · 2014: 11 · 2013: 2
FWCI
6.73
Type
journal article
Language
en
Open access
Licence
cc-by
Locations
  • Molecular Neurodegeneration (publishedVersion, cc-by)
  • Europe PMC (PubMed Central) (publishedVersion, cc-by)
  • PubMed Central (publishedVersion, cc-by)
  • PubMed (publishedVersion)
Funders
European Commission
Topics
  • Life Sciences › Neuroscience › Cellular and Molecular Neuroscience › Alzheimer's disease research and treatments
  • Health Sciences › Medicine › Psychiatry and Mental health › Dementia and Cognitive Impairment Research
  • Life Sciences › Neuroscience › Neurology › Neuroinflammation and Neurodegeneration Mechanisms
Keywords
APOE ε4, Alzheimer's disease, amyloid-beta 42, tau hyperphosphorylation, vesicular glutamate transporter, glutamatergic neurotransmission, hippocampus, CA3 neurons, mitochondrial dysfunction, GABAergic synapses, APOE3, targeted replacement mice
MeSH terms
Aging, Alzheimer Disease, Animals, Behavior, Animal, Cognition Disorders, Enzyme-Linked Immunosorbent Assay, Fluorescent Antibody Technique, Hippocampus, Humans, Immunohistochemistry, Mice, Transgenic, Neurons, Phosphorylation, Immunoblotting, Amyloid beta-Peptides, tau Proteins, Microscopy, Confocal, Genetic Predisposition to Disease, Vesicular Glutamate Transport Proteins, Mice, Apolipoprotein E4

About these checks

Registry, retraction, Cites and statistics results are computed, not judged, with one exception: a printed reference that no index lists is read once by a model before it counts as a citation error. Claims are extracted by a model and kept only when their quote appears verbatim in the text; each cited source is then checked, with a model’s help, for whether it says what the claim relies on. Those verdicts can be wrong — read the claim’s quote and the cited source before relying on one.

Statistics and arithmetic are recomputed, not judged.

Confidence bands are shown only for fields calibrated on our annotated test set. None is calibrated yet, so no band is shown.

What counts as a claim ›How we measure confidence ›How we check this ›

Are you an author, or do you see a problem with this page? Request a review