

The DOI matches its Crossref record; 113 of the 113 references it cites were found in a registry or an index.
Identification of co-expression gene networks, regulatory genes and pathways for obesity based on adipose tissue RNA Sequencing in a porcine model
Open accessAbstract
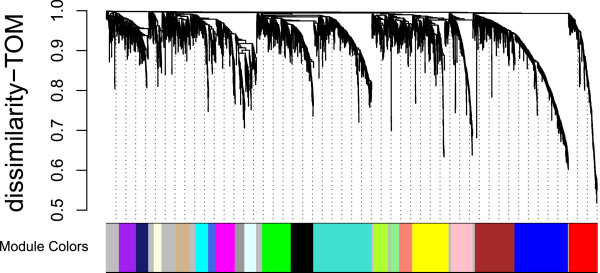
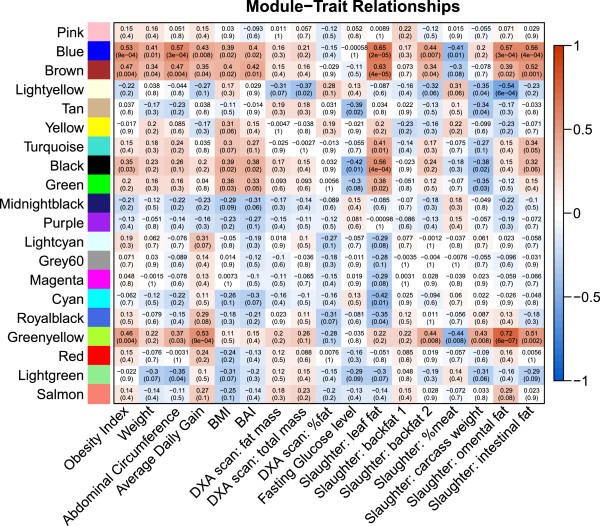
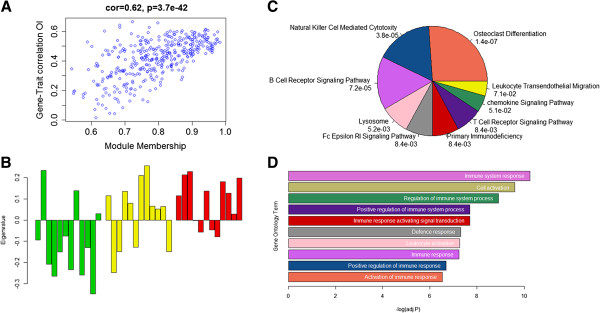
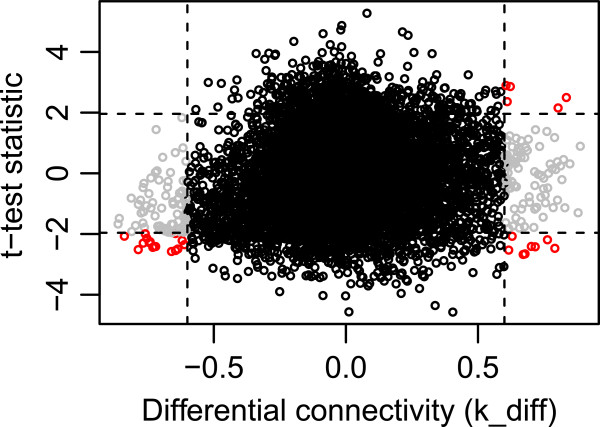
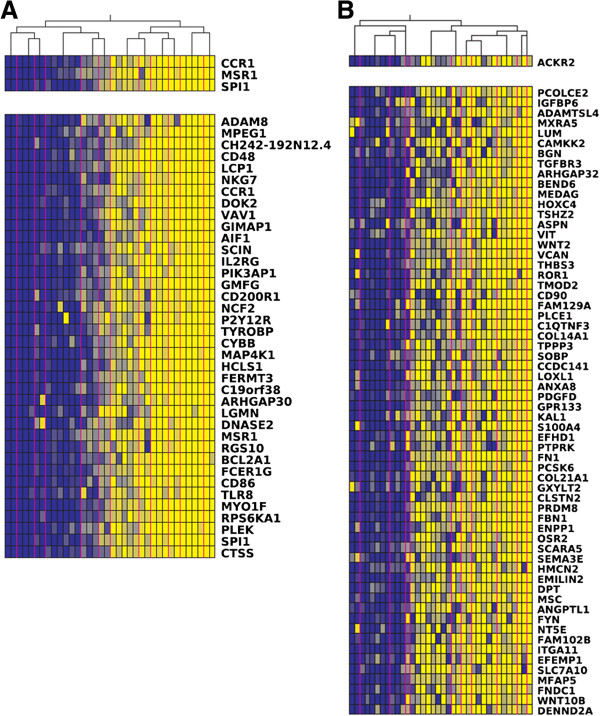
BACKGROUND: Obesity is a complex metabolic condition in strong association with various diseases, like type 2 diabetes, resulting in major public health and economic implications. Obesity is the result of environmental and genetic factors and their interactions, including genome-wide genetic interactions. Identification of co-expressed and regulatory genes in RNA extracted from relevant tissues representing lean and obese individuals provides an entry point for the identification of genes and pathways of importance to the development of obesity. The pig, an omnivorous animal, is an excellent model for human obesity, offering the possibility to study in-depth organ-level transcriptomic regulations of obesity, unfeasible in humans. Our aim was to reveal adipose tissue co-expression networks, pathways and transcriptional regulations of obesity using RNA Sequencing based systems biology approaches in a porcine model. METHODS: We selected 36 animals for RNA Sequencing from a previously created F2 pig population representing three extreme groups based on their predicted genetic risks for obesity. We applied Weighted Gene Co-expression Network Analysis (WGCNA) to detect clusters of highly co-expressed genes (modules). Additionally, regulator genes were detected using Lemon-Tree algorithms. RESULTS: WGCNA revealed five modules which were strongly correlated with at least one obesity-related phenotype (correlations ranging from -0.54 to 0.72, P < 0.001). Functional annotation identified pathways enlightening the association between obesity and other diseases, like osteoporosis (osteoclast differentiation, P = 1.4E-7), and immune-related complications (e.g. Natural killer cell mediated cytotoxity, P = 3.8E-5; B cell receptor signaling pathway, P = 7.2E-5). Lemon-Tree identified three potential regulator genes, using confident scores, for the WGCNA module which was associated with osteoclast differentiation: CCR1, MSR1 and SI1 (probability scores respectively 95.30, 62.28, and 34.58). Moreover, detection of differentially connected genes identified various genes previously identified to be associated with obesity in humans and rodents, e.g. CSF1R and MARC2. CONCLUSIONS: To our knowledge, this is the first study to apply systems biology approaches using porcine adipose tissue RNA-Sequencing data in a genetically characterized porcine model for obesity. We revealed complex networks, pathways, candidate and regulatory genes related to obesity, confirming the complexity of obesity and its association with immune-related disorders and osteoporosis.
Overview
The claims and statistics of this paper haven’t been checked yet.
Run the check — free, no account needed. It reads the open-access text and checks the sources it cites.
Integrity signals
Registry
Cites
Statistics
Figures
Verification
Claims the paper makes
The claims and statistics of this paper haven’t been checked yet.
Run the check — free, no account needed. It reads the open-access text and checks the sources it cites.
Claims other papers make about this one
Each is checked against this paper’s own text: does it say what the citing paper says it does?
The source backs part of the claim, not all of it — or backs it for a different population, condition or comparison.
In the citing paper
“WGCNA was the first co-expression tool to be applied to RNA-seq data; it has effectively identified biologically relevant associations between phenotypes and modules [19, 66, 67], performing similarly to microarray-based analyses.”
From Gene co-expression analysis for functional classification and gene–disease predictions (2017) · cites this paper as [66]
Experimental — accuracy not yet measuredThe cited source says what the claim attributes to it.
In the citing paper
“Co-expression analysis of RNA-seq data of lean and obese porcines identified obesity-related modules [66], and a link was found between obesity, the immune system and bone remodelling, with the study identifying CCR1, MSR1 and SPI1 as possible regulators in these processes.”
From Gene co-expression analysis for functional classification and gene–disease predictions (2017) · cites this paper as [66]
Self-check
Percentages, sums and reported differences re-computed from the paper’s own numbers.
The self-check needs the paper’s full text.
Citations
Cites
R: A Language and Environment for Statistical Computing
R Core Team (2000) · doi:10.32614/r.manuals · Cited by 355,893
WGCNA: an R package for weighted correlation network analysis
Langfelder, P., & Horvath, S. (2008) · BMC Bioinformatics · doi:10.1186/1471-2105-9-559 · Cited by 27,252
HTSeq—a Python framework to work with high-throughput sequencing data
Anders, S., Pyl, P. T., & Huber, W. (2015) · Bioinformatics · doi:10.1093/bioinformatics/btu638 · Cited by 21,464
Gene Expression Omnibus: NCBI gene expression and hybridization array data repository
Edgar, R. (2002) · Nucleic Acids Research · doi:10.1093/nar/30.1.207 · Cited by 13,288
RNA-Seq: a revolutionary tool for transcriptomics
Wang, Z., Gerstein, M., & Snyder, M. (2009) · Nature Reviews Genetics · doi:10.1038/nrg2484 · Cited by 13,174
Obesity is associated with macrophage accumulation in adipose tissue
Weisberg, S. P., McCann, D., Desai, M., Rosenbaum, M., Leibel, R. L., & Ferrante, A. W. (2003) · Journal of Clinical Investigation · doi:10.1172/jci200319246 · Cited by 10,041
Gene ontology analysis for RNA-seq: accounting for selection bias
Young, M. D., Wakefield, M. J., Smyth, G. K., & Oshlack, A. (2010) · Genome Biology · doi:10.1186/gb-2010-11-2-r14 · Cited by 7,107
limma: Linear Models for Microarray Data
Smyth, G. K. (2005) · Statistics for Biology and Health · doi:10.1007/0-387-29362-0_23 · Cited by 5,796
A General Framework for Weighted Gene Co-Expression Network Analysis
Zhang, B., & Horvath, S. (2005) · Statistical Applications in Genetics and Molecular Biology · doi:10.2202/1544-6115.1128 · Cited by 5,684
Adipose Tissue as an Endocrine Organ
Kershaw, E. E., & Flier, J. S. (2004) · The Journal of Clinical Endocrinology & Metabolism · doi:10.1210/jc.2004-0395 · Cited by 5,522
Research works printed but not linked: 2
- Adams JU: Transcriptome: Connecting the Genome to Gene Function. Nat Educ. 2008, 1 (1): 195.
- Kadarmideen HN, Kogelman LJA: RNA-Sequencing of lean, intermediate, and obese pigs. NCBI's Gene Expression Omnibus. 2014, http://www.ncbi.nlm.nih.gov/geo/query/acc.cgi?acc=GSE61271, 1.
Cited by
Sorted by citations
Gene co-expression analysis for functional classification and gene–disease predictions
van Dam, S., Võsa, U., van der Graaf, A., Franke, L., & de Magalhães, J. P. (2017) · Briefings in Bioinformatics · doi:10.1093/bib/bbw139 · Cited by 995
Self-citationEl‐Sharkawy, I., Liang, D., & Xu, K. (2015) · Journal of Experimental Botany · doi:10.1093/jxb/erv433 · Cited by 284
Suravajhala, P., Kogelman, L. J. A., & Kadarmideen, H. N. (2016) · Genetics Selection Evolution · doi:10.1186/s12711-016-0217-x · Cited by 232
Self-citationAlexandre, P. A., Kogelman, L. J. A., Santana, M. H. D. A., Passarelli, D., Pulz, L. H., Neto, P. F., Silva, P. L., Leme, P. R., Strefezzi, R. D. F., Coutinho, L. L., et al. (2015) · BMC Genomics · doi:10.1186/s12864-015-2292-8 · Cited by 158
Self-citationSalleh, M. S. M., Mazzoni, G., Höglund, J., Olijhoek, D., Lund, P., Løvendahl, P., & Kadarmideen, H. N. (2017) · BMC Genomics · doi:10.1186/s12864-017-3622-9 · Cited by 106
Self-citation
Metadata
- Authors
- Kogelman, L. J. A., Cirera, S., Zhernakova, D. V., Fredholm, M., Franke, L., & Kadarmideen, H. N.
- Affiliations
- University of Copenhagen (DK)
- University Medical Center Groningen (NL)
- Corresponding author
- Kadarmideen, Haja N
- ORCID
- Venue
- BMC Medical Genomics
- Published
- 2014-09-30
- Volume
- 7
- Issue
- 1
- Pages
- 57-57
- ISSN
- 1755-8794 (ISSN-L)
- PMC
- PMC4183073
- OpenAlex
- W2153892583
- Cited by
- 106
- References
- 113
- Citations by year
- 2026: 1 · 2025: 5 · 2024: 8 · 2023: 5 · 2022: 14 · 2021: 10 · 2020: 12 · 2019: 7 · 2018: 13 · 2017: 8 · 2016: 14 · 2015: 9
- FWCI
- 4.24
- Type
- journal article
- Language
- en
- Open access
- gold
- doi.org
- Licence
- Locations
- BMC Medical Genomics (publishedVersion, cc-by)
- PubMed Central (publishedVersion, cc-by)
- PubMed (publishedVersion)
- Research at the University of Copenhagen (University of Copenhagen) (publishedVersion, other-oa)
- University of Groningen research database (University of Groningen / Centre for Information Technology) (submittedVersion, cc-by)
- University of Groningen research database (University of Groningen / Centre for Information Technology) (submittedVersion, other-oa)
- Funders
- Strategiske Forskningsråd
- European Commission (293511)
- Copenhagen Graduate School for Nanoscience and Nanotechnology
- Topics
- Life Sciences › Biochemistry, Genetics and Molecular Biology › Molecular Biology › Bioinformatics and Genomic Networks
- Health Sciences › Medicine › Endocrinology, Diabetes and Metabolism › Adipokines, Inflammation, and Metabolic Diseases
- Life Sciences › Biochemistry, Genetics and Molecular Biology › Genetics › Genetic and phenotypic traits in livestock
- Keywords
- obesity, adipose tissue, porcine model, co-expression network, gene regulatory networks, transcriptional regulation, osteoclastogenesis, osteoporosis, immune pathways, CCR1, MSR1, CSF1R, type 2 diabetes, B cell receptor signaling, NK cell cytotoxicity
- MeSH terms
- Adipose Tissue, Animals, Disease Models, Animal, Female, Humans, Male, Obesity, Swine, Transcription, Genetic, Sequence Analysis, RNA, Systems Biology, Gene Regulatory Networks
About these checks
Registry, retraction, Cites and statistics results are computed, not judged, with one exception: a printed reference that no index lists is read once by a model before it counts as a citation error. Claims are extracted by a model and kept only when their quote appears verbatim in the text; each cited source is then checked, with a model’s help, for whether it says what the claim relies on. Those verdicts can be wrong — read the claim’s quote and the cited source before relying on one.
Statistics and arithmetic are recomputed, not judged.
Confidence bands are shown only for fields calibrated on our annotated test set. None is calibrated yet, so no band is shown.
What counts as a claim ›How we measure confidence ›How we check this ›
Are you an author, or do you see a problem with this page? Request a review
