

qBase relative quantification framework and software for management and automated analysis of real-time quantitative PCR data
Open accessThe DOI matches its Crossref record; 16 of the 16 references it cites were found in a registry or an index.
Abstract
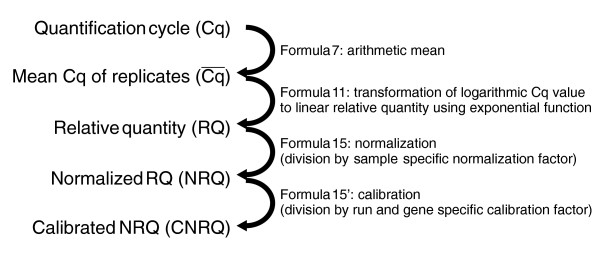
Although quantitative PCR (qPCR) is becoming the method of choice for expression profiling of selected genes, accurate and straightforward processing of the raw measurements remains a major hurdle. Here we outline advanced and universally applicable models for relative quantification and inter-run calibration with proper error propagation along the entire calculation track. These models and algorithms are implemented in qBase, a free program for the management and automated analysis of qPCR data.
Overview
The claims and statistics of this paper haven’t been checked yet.
Free: it reads the open-access text and checks the first 5 claims that cite a source we can check. Create a free account to check every claim.
Integrity signals
Registry
Cites
Statistics
Figures
Verification
Claims the paper makes
The claims and statistics of this paper haven’t been checked yet.
Free: it reads the open-access text and checks the first 5 claims that cite a source we can check. Create a free account to check every claim.
Claims other papers make about this one
Each is checked against this paper’s own text: does it say what the citing paper says it does?
The cited source says what the claim attributes to it.
In the citing paper
“alternative, more generalized quantitative models have been developed to correct for differences in amplification efficiency (62 ) and to allow the use of multiple reference genes (30 ).”
From The MIQE guidelines: minimum information for publication of quantitative real-time PCR experiments (2009) · cites this paper as [30]
Self-check
Percentages, sums and reported differences re-computed from the paper’s own numbers.
The self-check needs the paper’s full text.
Citations
Cites
Analysis of Relative Gene Expression Data Using Real-Time Quantitative PCR and the 2−ΔΔCT Method
Livak, K. J., & Schmittgen, T. D. (2001) · Methods · doi:10.1006/meth.2001.1262 · Cited by 180,860 · cited 3×
“The simplest model described by Livak and Schmittgen [6] assumes 100% PCR efficiency (reflected by a value of 2 for the base E of the exponential function) and uses a single reference gene for normalization: Pfaffl [7] modified the above model by adjusting for differences in PCR efficiency between the gene of interest…”
MethodA new mathematical model for relative quantification in real-time RT-PCR
Pfaffl, M. W. (2001) · Nucleic Acids Research · doi:10.1093/nar/29.9.e45 · Cited by 34,610
Vandesompele, J., De Preter, K., Pattyn, F., Poppe, B., Van Roy, N., De Paepe, A., & Speleman, F. (2002) · Genome Biology · doi:10.1186/gb-2002-3-7-research0034 · Cited by 20,038
Self-citationAndersen, C. L., Jensen, J. L., & Ørntoft, T. F. (2004) · Cancer Research · doi:10.1158/0008-5472.can-04-0496 · Cited by 7,127
Heid, C. A., Stevens, J., Livak, K. J., & Williams, P. M. (1996) · Genome Research · doi:10.1101/gr.6.10.986 · Cited by 6,174
Pfaffl, M. W., Tichopad, A., Prgomet, C., & Neuvians, T. P. (2004) · Biotechnology Letters · doi:10.1023/b:bile.0000019559.84305.47 · Cited by 5,065
Mutation of the mouse klotho gene leads to a syndrome resembling ageing
Kuro-o, M., Matsumura, Y., Aizawa, H., Kawaguchi, H., Suga, T., Utsugi, T., Ohyama, Y., Kurabayashi, M., Kaname, T., Kume, E., et al. (1997) · Nature · doi:10.1038/36285 · Cited by 3,837
Quantification of mRNA using real-time RT-PCR
Nolan, T., Hands, R. E., & Bustin, S. A. (2006) · Nature Protocols · doi:10.1038/nprot.2006.236 · Cited by 2,247 · cited 1×
“Our quantification framework and software fit exactly in current thinking that places emphasis on getting every step of a realtime PCR assay right (such as RNA quality assessment, appropriate reverse transcription, selection of a proper normalization strategy, and so on [2]), especially if small differences between sa…”
MethodLoeys, B. L., Chen, J., Neptune, E. R., Judge, D. P., Podowski, M., Holm, T., Meyers, J., Leitch, C. C., Katsanis, N., Sharifi, N., et al. (2005) · Nature Genetics · doi:10.1038/ng1511 · Cited by 1,795
Self-citationHellemans, J., Preobrazhenska, O., Willaert, A., Debeer, P., Verdonk, P. C. M., Costa, T., Janssens, K., Menten, B., Roy, N. V., Vermeulen, S. J. T., et al. (2004) · Nature Genetics · doi:10.1038/ng1453 · Cited by 472
Self-citation
Cited by
Two new Later Stone Age sites from the Final Pleistocene in the Falémé Valley, eastern Senegal
Ndiaye, M., Lespez, L., Tribolo, C., Rassé, M., Hadjas, I., Davidoux, S., Huysecom, É., & Douze, K. (2024) · Monash University Research Portal (Monash University) · doi:10.3929/ethz-b-000667478 · Cited by 23,868
The MIQE guidelines: minimum information for publication of quantitative real-time PCR experiments
Bustin, S. A., Benes, V., Garson, J. A., Hellemans, J., Huggett, J., Kubista, M., Mueller, R., Nolan, T., Pfaffl, M. W., Shipley, G. L., et al. (2009) · Clinical Chemistry · doi:10.1373/clinchem.2008.112797 · Cited by 16,303
Self-citationAutism genome-wide copy number variation reveals ubiquitin and neuronal genes
Glessner, J. T., Wang, K., Cai, G., Korvatska, O., Kim, C. E., Wood, S., Zhang, H., Estes, A., Brune, C. W., Bradfield, J. P., et al. (2009) · Nature · doi:10.1038/nature07953 · Cited by 1,421
A novel and universal method for microRNA RT-qPCR data normalization
Mestdagh, P., Van Vlierberghe, P., De Weer, A., Muth, D., Westermann, F., Speleman, F., & Vandesompele, J. (2009) · Genome Biology · doi:10.1186/gb-2009-10-6-r64 · Cited by 1,079
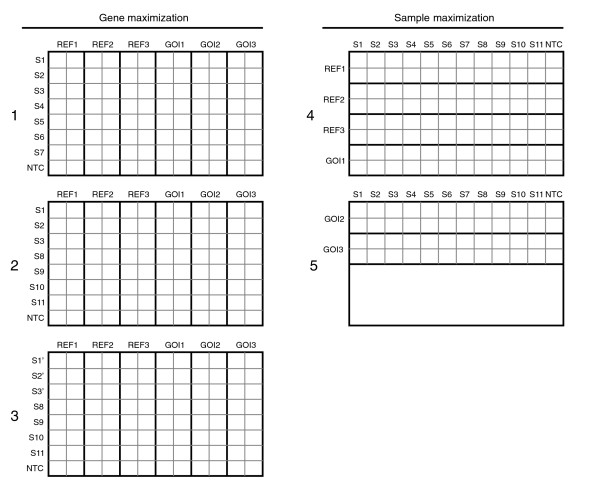
“All reactions were performed on the 7900 HT (Applied Biosystems) using the gene maximization strategy [41].”
MethodSelf-citation5-Hydroxymethylcytosine in the mammalian zygote is linked with epigenetic reprogramming
Wossidlo, M., Nakamura, T., Lepikhov, K., Marques, C. J., Zakhartchenko, V., Boiani, M., Arand, J., Nakano, T., Reik, W., & Walter, J. (2011) · Nature Communications · doi:10.1038/ncomms1240 · Cited by 792
Metadata
- Authors
- Hellemans, J., Mortier, G., De Paepe, A., Speleman, F., & Vandesompele, J.
- Affiliations
- Ghent University Hospital (BE)
- Corresponding author
- Vandesompele, Jo
- Venue
- Genome Biology
- Published
- 2007-02-09
- Volume
- 8
- Issue
- 2
- Pages
- R19-R19
- ISSN
- 1465-6906 (ISSN-L)
- 1474-760X
- PMC
- PMC1852402
- OpenAlex
- W2138581811
- Cited by
- 4,023
- References
- 16
- Citations by year
- 2026: 118 · 2025: 177 · 2024: 209 · 2023: 240 · 2022: 250 · 2021: 269 · 2020: 243 · 2019: 307 · 2018: 252 · 2017: 272 · 2016: 294 · 2015: 240 · 2014: 247 · 2013: 242 · 2012: 196
- FWCI
- 38.03
- Type
- journal article
- Language
- en
- Open access
- gold
- doi.org
- Licence
- cc-by
- creativecommons.org/licenses/by/2.0/ (tdm)
- creativecommons.org/licenses/by/2.0/ (vor)
- Locations
- Genome biology (publishedVersion, cc-by)
- PubMed Central (publishedVersion, cc-by)
- PubMed (publishedVersion)
- Ghent University Academic Bibliography (Ghent University) (submittedVersion)
- Funders
- Fonds Wetenschappelijk Onderzoek
- Vlaamse regering
- Topics
- Life Sciences › Biochemistry, Genetics and Molecular Biology › Molecular Biology › Molecular Biology Techniques and Applications
- Life Sciences › Biochemistry, Genetics and Molecular Biology › Molecular Biology › Gene expression and cancer classification
- Life Sciences › Biochemistry, Genetics and Molecular Biology › Molecular Biology › Genomics and Phylogenetic Studies
- Keywords
- relative quantification, real-time quantitative PCR, error propagation, gene expression profiling
- MeSH terms
- Algorithms, Models, Genetic, Software, Polymerase Chain Reaction, Gene Expression Profiling
About these checks
Registry, retraction, Cites and statistics results are computed, not judged, with one exception: a printed reference that no index lists is read once by a model before it counts as a citation error. Claims are extracted by a model and kept only when their quote appears verbatim in the text; each cited source is then checked, with a model’s help, for whether it says what the claim relies on. Those verdicts can be wrong — read the claim’s quote and the cited source before relying on one.
Statistics and arithmetic are recomputed, not judged.
Confidence bands are shown only for fields calibrated on our annotated test set. None is calibrated yet, so no band is shown.
What counts as a claim ›How we measure confidence ›How we check this ›
Are you an author, or do you see a problem with this page? Request a review
How to cite
Cite CoChat for the checks on this page, and the paper for its own findings.
- This page
- CoChat. (2026). Citation check: qBase relative quantification framework and software for management and automated analysis of real-time quantitative PCR data. https://app.cochat.ai/papers/10.1186/gb-2007-8-2-r19
- The paper
- Hellemans, J., Mortier, G., De Paepe, A., Speleman, F., & Vandesompele, J. (2007). qBase relative quantification framework and software for management and automated analysis of real-time quantitative PCR data. Genome Biology. https://doi.org/10.1186/gb-2007-8-2-r19
Data sources
Bibliographic data: Semantic Scholar, OpenAlex, Crossref.
Contains information from the Semantic Scholar Academic Graph Datasets, made available under the ODC Attribution License (ODC-BY 1.0).
Semantic Scholar’s data is described in: Kinney, R., et al. (2023). The Semantic Scholar Open Data Platform. arXiv:2301.10140.
