

Haplotype and isoform specific expression estimation using multi-mapping RNA-seq reads
Open accessThe DOI matches its Crossref record; 22 of the 22 references it cites were found in a registry or an index.
Abstract
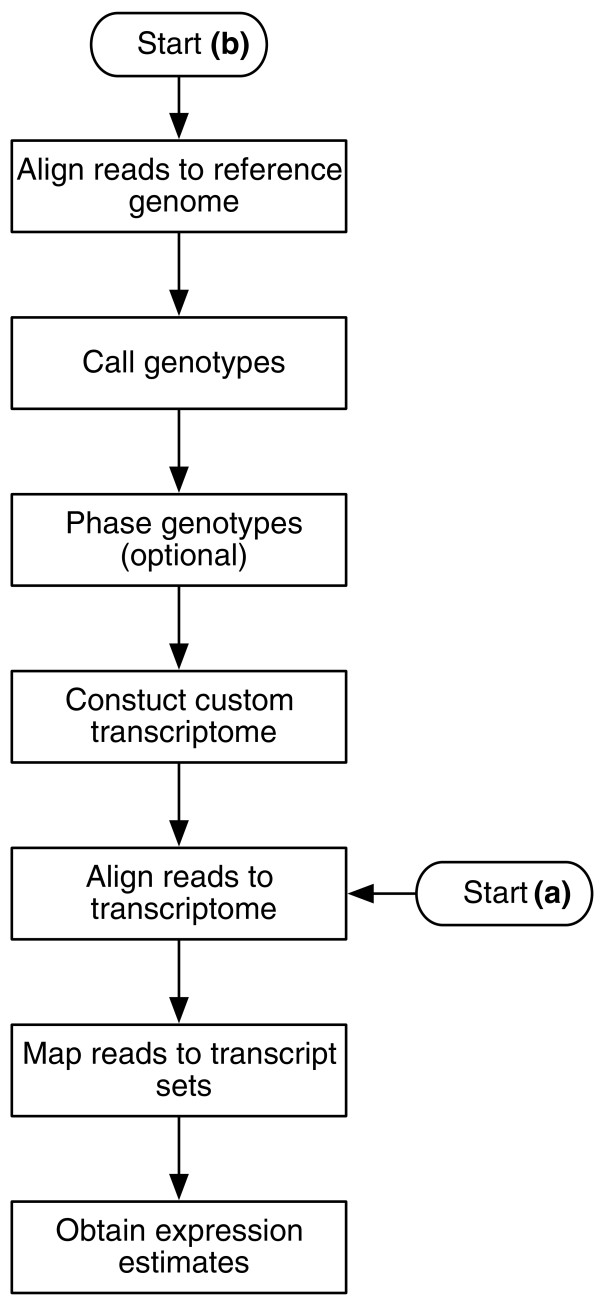
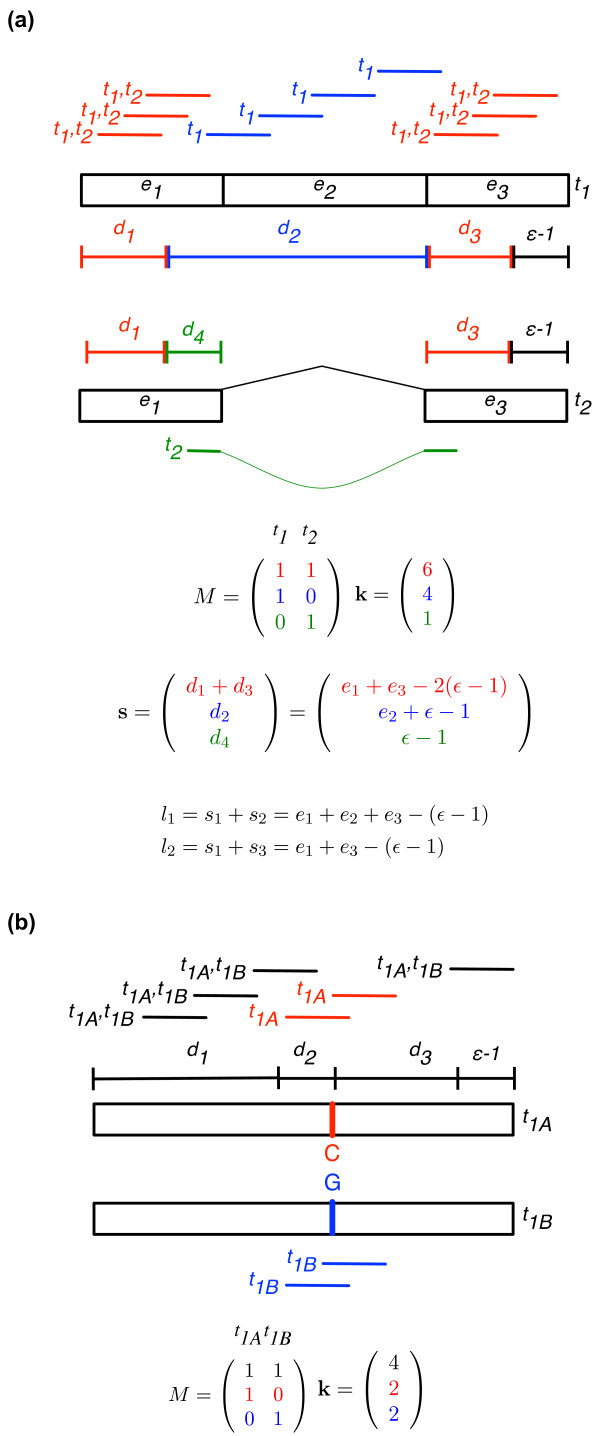
We present a novel pipeline and methodology for simultaneously estimating isoform expression and allelic imbalance in diploid organisms using RNA-seq data. We achieve this by modeling the expression of haplotype-specific isoforms. If unknown, the two parental isoform sequences can be individually reconstructed. A new statistical method, MMSEQ, deconvolves the mapping of reads to multiple transcripts (isoforms or haplotype-specific isoforms). Our software can take into account non-uniform read generation and works with paired-end reads.
Overview
The claims and statistics of this paper haven’t been checked yet.
Free: it reads the open-access text and checks the first 5 claims that cite a source we can check. Create a free account to check every claim.
Integrity signals
Registry
Cites
Statistics
Figures

Verification
Claims the paper makes
The claims and statistics of this paper haven’t been checked yet.
Free: it reads the open-access text and checks the first 5 claims that cite a source we can check. Create a free account to check every claim.
Claims other papers make about this one
Each is checked against this paper’s own text: does it say what the citing paper says it does?
The source backs part of the claim, not all of it — or backs it for a different population, condition or comparison.
In the citing paper
“Including all reads by allocating the allelic multireads using an EM algorithm improves the accuracy of allele-specific expression (Turro et al. 2011).”
From RNA-Seq Alignment to Individualized Genomes Improves Transcript Abundance Estimates in Multiparent Populations (2014) · cites this paper as Turro et al. 2011
Experimental — accuracy not yet measuredThe cited source says what the claim attributes to it.
In the citing paper
“To perform this Gibbs sampling, we adopt the model of Turro et al. [27] (details in Supplementary Note 2).”
From Salmon provides fast and bias-aware quantification of transcript expression (2017) · cites this paper as [27]
The cited source says what the claim attributes to it.
In the citing paper
“The inclusion of multireads adds complexity to the abundance estimation problem but EM algorithms are well suited to this task (Li and Dewey 2011; Nicolae et al. 2011; Turro et al. 2011; Roberts and Pachter 2013).”
From RNA-Seq Alignment to Individualized Genomes Improves Transcript Abundance Estimates in Multiparent Populations (2014) · cites this paper as Turro et al. 2011
In the citing paper
“Collapsing fragments into equivalence classes is a well-established idea in the transcript quantification literature, and numerous different notions of equivalence classes have been previously introduced, and shown to greatly reduce the time required to perform iterative optimization such as that described in Offline phase.”
From Salmon provides fast and bias-aware quantification of transcript expression (2017) · cites this paper as [27]
Self-check
Percentages, sums and reported differences re-computed from the paper’s own numbers.
The self-check needs the paper’s full text.
Citations
Cites
The Sequence Alignment/Map format and SAMtools
Li, H., Handsaker, B., Wysoker, A., Fennell, T., Ruan, J., Homer, N., Marth, G., Abecasis, G., Durbin, R., & 1000 Genome Project Data Processing Subgroup (2009) · Bioinformatics · doi:10.1093/bioinformatics/btp352 · Cited by 62,041
Ultrafast and memory-efficient alignment of short DNA sequences to the human genome.
Langmead, B., Trapnell, C., Pop, M., & Salzberg, S. L. (2009) · Genome Biology · doi:10.1186/gb-2009-10-3-r25 · Cited by 21,849
Differential expression analysis for sequence count data
Anders, S., & Huber, W. (2010) · Genome Biology · doi:10.1186/gb-2010-11-10-r106 · Cited by 15,581
Trapnell, C., Williams, B. A., Pertea, G., Mortazavi, A., Kwan, G., van Baren, M. J., Salzberg, S. L., Wold, B. J., & Pachter, L. (2010) · Nature Biotechnology · doi:10.1038/nbt.1621 · Cited by 15,556
Mapping and quantifying mammalian transcriptomes by RNA-Seq
Mortazavi, A., Williams, B. A., McCue, K., Schaeffer, L., & Wold, B. (2008) · Nature Methods · doi:10.1038/nmeth.1226 · Cited by 13,696 · cited 3×
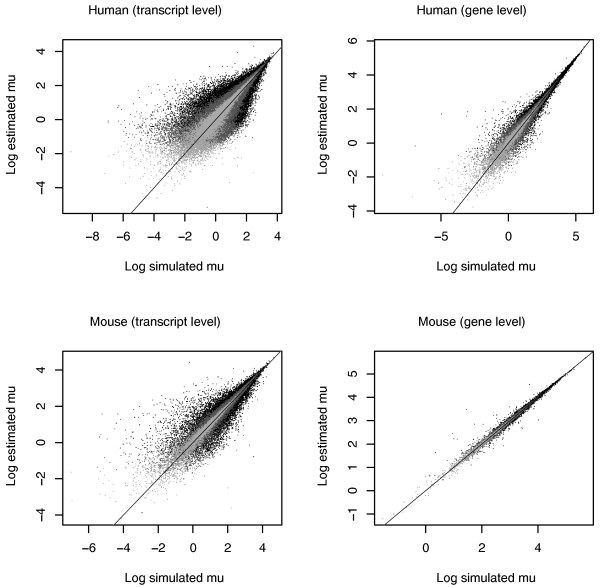
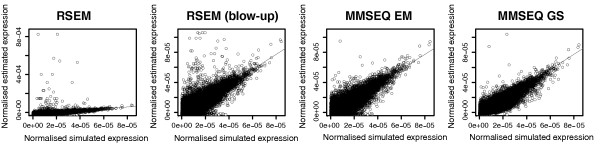
“The authors have shown an improvement of their method for gene-level estimation over strategies that discard multiply aligned reads or allocate them to mapped transcripts according to the coverage by single-mapping reads (as in [3]).”
MethodInfluentialTopHat: discovering splice junctions with RNA-Seq
Trapnell, C., Pachter, L., & Salzberg, S. L. (2009) · Bioinformatics · doi:10.1093/bioinformatics/btp120 · Cited by 11,617
RNA-Seq gene expression estimation with read mapping uncertainty
Li, B., Ruotti, V., Stewart, R. M., Thomson, J. A., & Dewey, C. N. (2010) · Bioinformatics · doi:10.1093/bioinformatics/btp692 · Cited by 1,198
Transcriptome genetics using second generation sequencing in a Caucasian population
Montgomery, S. B., Sammeth, M., Gutierrez-Arcelus, M., Lach, R. P., Ingle, C., Nisbett, J., Guigo, R., & Dermitzakis, E. T. (2010) · Nature · doi:10.1038/nature08903 · Cited by 797
Biases in Illumina transcriptome sequencing caused by random hexamer priming
Hansen, K. D., Brenner, S. E., & Dudoit, S. (2010) · Nucleic Acids Research · doi:10.1093/nar/gkq224 · Cited by 713 · cited 2×
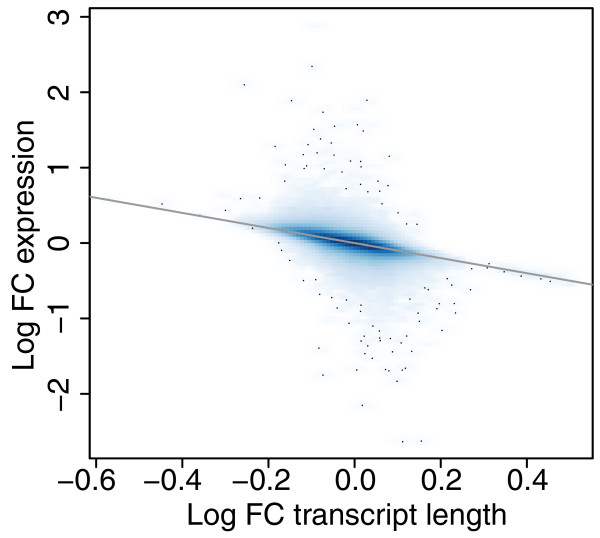
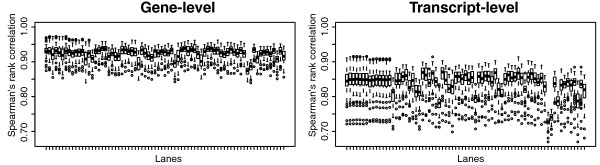
“However, two recent papers [7,8] have shown that deviations from uniformity in the generation of reads are in great part sequence rather than position-dependent for a given experimental protocol and sequencing platform.”
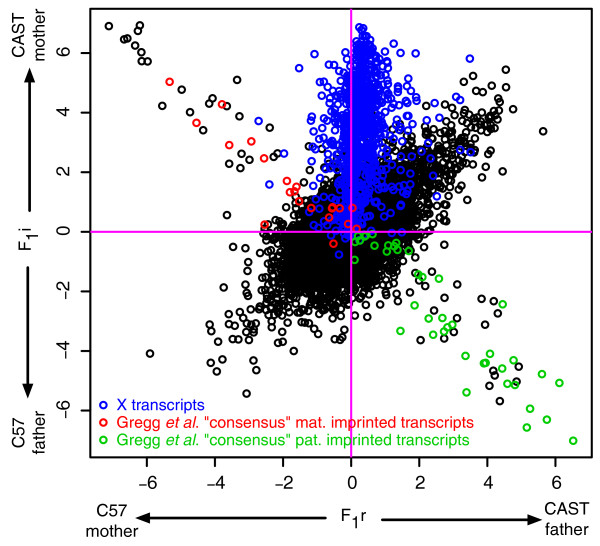
BackgroundMethodHigh-Resolution Analysis of Parent-of-Origin Allelic Expression in the Mouse Brain
Gregg, C., Zhang, J., Weissbourd, B., Luo, S., Schroth, G. P., Haig, D., & Dulac, C. (2010) · Science · doi:10.1126/science.1190830 · Cited by 591
Cited by
Salmon provides fast and bias-aware quantification of transcript expression
Patro, R., Duggal, G., Love, M. I., Irizarry, R. A., & Kingsford, C. (2017) · Nature Methods · doi:10.1038/nmeth.4197 · Cited by 12,700
Single-cell reconstruction of the early maternal–fetal interface in humans
Vento-Tormo, R., Efremova, M., Botting, R. A., Turco, M. Y., Vento-Tormo, M., Meyer, K. B., Park, J.-E., Stephenson, E., Polański, K., Goncalves, A., et al. (2018) · Nature · doi:10.1038/s41586-018-0698-6 · Cited by 2,358
Self-citationRNA sequencing: the teenage years
Stark, R., Grzelak, M., & Hadfield, J. (2019) · Nature Reviews Genetics · doi:10.1038/s41576-019-0150-2 · Cited by 1,915
Epigenetic programming of monocyte-to-macrophage differentiation and trained innate immunity
Saeed, S., Quintin, J., Kerstens, H. H. D., Rao, N. A., Aghajanirefah, A., Matarese, F., Cheng, S.-C., Ratter, J., Berentsen, K., van der Ent, M. A., et al. (2014) · Science · doi:10.1126/science.1251086 · Cited by 1,761
Detecting differential usage of exons from RNA-seq data
Anders, S., Reyes, A., & Huber, W. (2012) · Genome Research · doi:10.1101/gr.133744.111 · Cited by 1,545
Metadata
- Authors
- Turro, E., Su, S.-Y., Gonçalves, Â., Coin, L. J., Richardson, S., & Lewin, A.
- Affiliations
- Imperial College London (GB)
- University of California, San Francisco (US)
- European Bioinformatics Institute (GB)
- Corresponding author
- Turro, Ernest
- Venue
- Genome Biology
- Published
- 2011-02-10
- Volume
- 12
- Issue
- 2
- Pages
- R13-R13
- ISSN
- 1465-6906 (ISSN-L)
- 1474-760X
- PMC
- PMC3188795
- OpenAlex
- W2129916363
- Cited by
- 264
- References
- 22
- Citations by year
- 2026: 2 · 2025: 10 · 2024: 14 · 2023: 17 · 2022: 12 · 2021: 10 · 2020: 28 · 2019: 23 · 2018: 17 · 2017: 18 · 2016: 16 · 2015: 25 · 2014: 28 · 2013: 20 · 2012: 18
- FWCI
- 9.34
- Type
- journal article
- Language
- en
- Open access
- gold
- doi.org
- Licence
- cc-by
- creativecommons.org/licenses/by/2.0/ (tdm)
- creativecommons.org/licenses/by/2.0/ (vor)
- Locations
- Genome biology (publishedVersion, cc-by)
- Europe PMC (PubMed Central) (publishedVersion, cc-by)
- PubMed Central (publishedVersion, cc-by)
- PubMed (publishedVersion)
- LSHTM Research Online (London School of Hygiene and Tropical Medicine) (acceptedVersion)
- Minerva Access (University of Melbourne) (submittedVersion, cc-by)
- Brunel University Research Archive (BURA) (Brunel University London) (submittedVersion)
- eScholarship (California Digital Library) (submittedVersion)
- Funders
- Biotechnology and Biological Sciences Research Council (BB/G000352/1)
- Topics
- Life Sciences › Biochemistry, Genetics and Molecular Biology › Molecular Biology › Genomics and Phylogenetic Studies
- Life Sciences › Biochemistry, Genetics and Molecular Biology › Molecular Biology › RNA Research and Splicing
- Life Sciences › Biochemistry, Genetics and Molecular Biology › Molecular Biology › Single-cell and spatial transcriptomics
- Keywords
- allelic imbalance, diploids, paired-end reads, RNA-seq
- MeSH terms
- Algorithms, Animals, Haplotypes, Humans, RNA, Messenger, Software, Models, Statistical, Alternative Splicing, Sequence Analysis, RNA, Computational Biology, Gene Expression Profiling, Allelic Imbalance, Mice, Transcriptome
About these checks
Registry, retraction, Cites and statistics results are computed, not judged, with one exception: a printed reference that no index lists is read once by a model before it counts as a citation error. Claims are extracted by a model and kept only when their quote appears verbatim in the text; each cited source is then checked, with a model’s help, for whether it says what the claim relies on. Those verdicts can be wrong — read the claim’s quote and the cited source before relying on one.
Statistics and arithmetic are recomputed, not judged.
Confidence bands are shown only for fields calibrated on our annotated test set. None is calibrated yet, so no band is shown.
What counts as a claim ›How we measure confidence ›How we check this ›
Are you an author, or do you see a problem with this page? Request a review
How to cite
Cite CoChat for the checks on this page, and the paper for its own findings.
- This page
- CoChat. (2026). Citation check: Haplotype and isoform specific expression estimation using multi-mapping RNA-seq reads. https://app.cochat.ai/papers/10.1186/gb-2011-12-2-r13
- The paper
- Turro, E., Su, S.-Y., Gonçalves, Â., Coin, L. J., Richardson, S., & Lewin, A. (2011). Haplotype and isoform specific expression estimation using multi-mapping RNA-seq reads. Genome Biology. https://doi.org/10.1186/gb-2011-12-2-r13
Data sources
Bibliographic data: Semantic Scholar, OpenAlex, Crossref.
Contains information from the Semantic Scholar Academic Graph Datasets, made available under the ODC Attribution License (ODC-BY 1.0).
Semantic Scholar’s data is described in: Kinney, R., et al. (2023). The Semantic Scholar Open Data Platform. arXiv:2301.10140.
