

The DOI matches its Crossref record; 21 of the 21 references it cites were found in a registry or an index.
Moving pictures of the human microbiome
Open accessAbstract
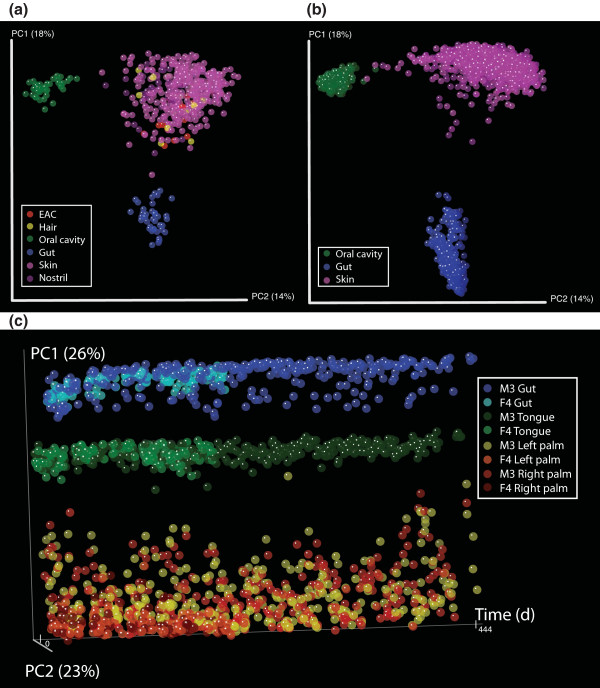
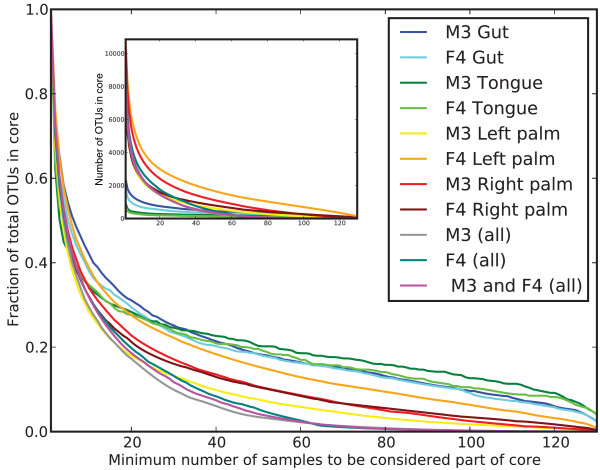
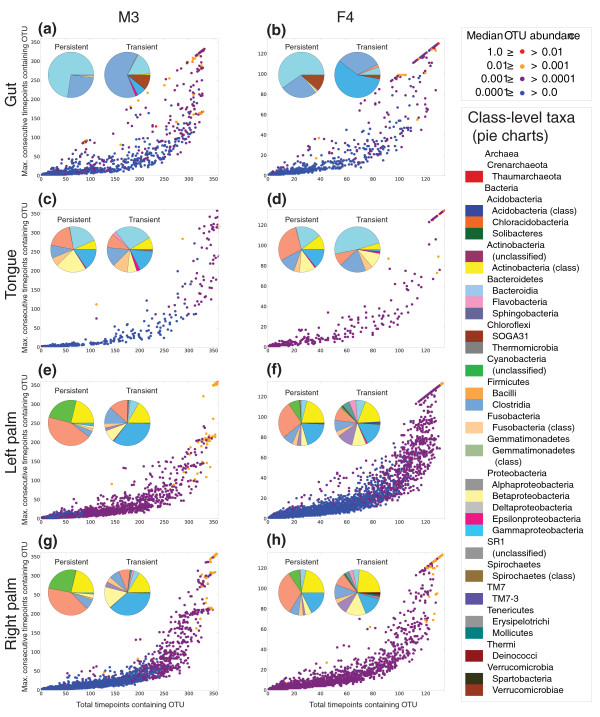
BACKGROUND: Understanding the normal temporal variation in the human microbiome is critical to developing treatments for putative microbiome-related afflictions such as obesity, Crohn’s disease, inflammatory bowel disease and malnutrition. Sequencing and computational technologies, however, have been a limiting factor in performing dense time series analysis of the human microbiome. Here, we present the largest human microbiota time series analysis to date, covering two individuals at four body sites over 396 timepoints. RESULTS: We find that despite stable differences between body sites and individuals, there is pronounced variability in an individual’s microbiota across months, weeks and even days. Additionally, only a small fraction of the total taxa found within a single body site appear to be present across all time points, suggesting that no core temporal microbiome exists at high abundance (although some microbes may be present but drop below the detection threshold). Many more taxa appear to be persistent but non-permanent community members. CONCLUSIONS: DNA sequencing and computational advances described here provide the ability to go beyond infrequent snapshots of our human-associated microbial ecology to high-resolution assessments of temporal variations over protracted periods, within and between body habitats and individuals. This capacity will allow us to define normal variation and pathologic states, and assess responses to therapeutic interventions.
Overview
The claims and statistics of this paper haven’t been checked yet.
Run the check — free, no account needed. It reads the open-access text and checks the sources it cites.
Integrity signals
Registry
Cites
Statistics
Figures
Verification
Claims the paper makes
The claims and statistics of this paper haven’t been checked yet.
Run the check — free, no account needed. It reads the open-access text and checks the sources it cites.
Claims other papers make about this one
Each is checked against this paper’s own text: does it say what the citing paper says it does?
The cited source says what the claim attributes to it.
In the citing paper
“the fine structure of the healthy microbiota seems to be unique to individuals; intra-individual differences across time are typically much smaller than differences between individuals (Caporaso et al., 2011;Costello et al., 2009).”
From The Microbiota-Gut-Brain Axis (2019) · cites this paper as Caporaso et al., 2011
Self-check
Percentages, sums and reported differences re-computed from the paper’s own numbers.
The self-check needs the paper’s full text.
Citations
Cites
Search and clustering orders of magnitude faster than BLAST
Edgar, R. C. (2010) · Bioinformatics · doi:10.1093/bioinformatics/btq461 · Cited by 21,098
A human gut microbial gene catalogue established by metagenomic sequencing
MetaHIT Consortium, Qin, J., Li, R., Raes, J., Arumugam, M., Burgdorf, K. S., Manichanh, C., Nielsen, T., Pons, N., Levenez, F., et al. (2010) · Nature · doi:10.1038/nature08821 · Cited by 11,624
Greengenes, a Chimera-Checked 16S rRNA Gene Database and Workbench Compatible with ARB
DeSantis, T. Z., Hugenholtz, P., Larsen, N., Rojas, M., Brodie, E. L., Keller, K., Huber, T., Dalevi, D., Hu, P., & Andersen, G. L. (2006) · Applied and Environmental Microbiology · doi:10.1128/aem.03006-05 · Cited by 10,891
Global patterns of 16S rRNA diversity at a depth of millions of sequences per sample
Caporaso, J. G., Lauber, C. L., Walters, W. A., Berg-Lyons, D., Lozupone, C., Turnbaugh, P. J., Fierer, N., & Knight, R. D. (2010) · Proceedings of the National Academy of Sciences · doi:10.1073/pnas.1000080107 · Cited by 9,944
Self-citationDiversity of the Human Intestinal Microbial Flora
Eckburg, P. B., Bik, E. M., Bernstein, C. N., Purdom, E., Dethlefsen, L., Sargent, M., Gill, S. R., Nelson, K. E., & Relman, D. A. (2005) · Science · doi:10.1126/science.1110591 · Cited by 7,913
A core gut microbiome in obese and lean twins
Turnbaugh, P. J., Hamady, M., Yatsunenko, T., Cantarel, B. L., Duncan, A., Ley, R. E., Sogin, M. L., Jones, W. J., Roe, B. A., Affourtit, J. P., et al. (2009) · Nature · doi:10.1038/nature07540 · Cited by 7,823
Self-citationVaginal microbiome of reproductive-age women
Ravel, J., Gajer, P., Abdo, Z., Schneider, G. M., Koenig, S. S. K., McCulle, S. L., Karlebach, S., Gorle, R., Russell, J., Tacket, C. O., et al. (2011) · Proceedings of the National Academy of Sciences · doi:10.1073/pnas.1002611107 · Cited by 4,254
Self-citationBacterial Community Variation in Human Body Habitats Across Space and Time
Costello, E. K., Lauber, C. L., Hamady, M., Fierer, N., Gordon, J. I., & Knight, R. (2009) · Science · doi:10.1126/science.1177486 · Cited by 3,231
Self-citationThe Effect of Diet on the Human Gut Microbiome: A Metagenomic Analysis in Humanized Gnotobiotic Mice
Turnbaugh, P. J., Ridaura, V. K., Faith, J. J., Rey, F. E., Knight, R., & Gordon, J. I. (2009) · Science Translational Medicine · doi:10.1126/scitranslmed.3000322 · Cited by 3,058 · cited 2×
“…together, our observations paint a picture of a human microbiome that is highly variable over time (Figures 2 and 3; Additional files 2, 3, 4, 5, 6, 7, 8, 9, 10, 11, 12, 13, 14, 15), but from which stable patterns of similarities and differences among body habitats and individuals emerge (Figure…”
BackgroundSelf-citationDevelopment of the Human Infant Intestinal Microbiota
Palmer, C., Bik, E. M., DiGiulio, D. B., Relman, D. A., & Brown, P. O. (2007) · PLoS Biology · doi:10.1371/journal.pbio.0050177 · Cited by 2,877
Cited by
Sorted by citations
Hill (2014) · doi:10.1038/nrgastro.2014.66 · Cited by 9,592
Human gut microbiome viewed across age and geography
Yatsunenko, T., Rey, F. E., Manary, M. J., Trehan, I., Dominguez-Bello, M. G., Contreras, M., Magris, M., Hidalgo, G., Baldassano, R. N., Anokhin, A. P., et al. (2012) · Nature · doi:10.1038/nature11053 · Cited by 7,815
Self-citationDiversity, stability and resilience of the human gut microbiota
Lozupone, C. A., Stombaugh, J. I., Gordon, J. I., Jansson, J. K., & Knight, R. (2012) · Nature · doi:10.1038/nature11550 · Cited by 5,533
Self-citationCryan, J. F., O'Riordan, K. J., Cowan, C. S. M., Sandhu, K. V., Bastiaanssen, T. F. S., Boehme, M., Codagnone, M. G., Cussotto, S., Fulling, C., Golubeva, A. V., et al. (2019) · Physiological Reviews · doi:10.1152/physrev.00018.2018 · Cited by 5,286
Microbial interactions: from networks to models
Faust, K., & Raes, J. (2012) · Nature Reviews Microbiology · doi:10.1038/nrmicro2832 · Cited by 4,268
Metadata
- Authors
- Caporaso, J. G., Lauber, C. L., Costello, E. K., Berg-Lyons, D., Gonzalez, A., Stombaugh, J., Knights, D., Gajer, P., Ravel, J., Fierer, N., Gordon, J. I., & Knight, R.
- Affiliations
- University of Colorado Boulder (US)
- Cooperative Institute for Research in Environmental Sciences (US)
- Stanford Medicine (US)
- University of Maryland, Baltimore (US)
- Washington University in St. Louis (US)
- Howard Hughes Medical Institute (US)
- Corresponding author
- Knight, Rob
- ORCID
- Venue
- Genome Biology
- Published
- 2011-05-30
- Volume
- 12
- Issue
- 5
- Pages
- R50-R50
- ISSN
- 1465-6906 (ISSN-L)
- 1474-760X
- PMC
- PMC3271711
- OpenAlex
- W2126218947
- Cited by
- 1,138
- References
- 21
- Citations by year
- 2026: 25 · 2025: 50 · 2024: 69 · 2023: 80 · 2022: 68 · 2021: 88 · 2020: 102 · 2019: 93 · 2018: 83 · 2017: 84 · 2016: 78 · 2015: 79 · 2014: 78 · 2013: 82 · 2012: 61
- FWCI
- 30.93
- Type
- journal article
- Language
- en
- Open access
- gold
- doi.org
- Locations
- Genome biology (publishedVersion, cc-by)
- Europe PMC (PubMed Central) (publishedVersion, cc-by)
- PubMed Central (publishedVersion, cc-by)
- PubMed (publishedVersion)
- eScholarship (California Digital Library) (submittedVersion)
- Digital Commons@Becker (Washington University School of Medicine) (submittedVersion)
- Funders
- Howard Hughes Medical Institute
- Bill and Melinda Gates Foundation
- Crohn's and Colitis Foundation of America
- Amazon Web Services
- Crohn's and Colitis Foundation
- National Institutes of Health (5u01ai070921-07, DK078669)
- National Human Genome Research Institute (R01HG004872, HG004872, HG004872-02S1)
- National Institute of Allergy and Infectious Diseases (AI070921, AI083264, UH2AI083264)
- National Institute of Diabetes and Digestive and Kidney Diseases (DK078669, P01DK078669)
- Topics
- Life Sciences › Biochemistry, Genetics and Molecular Biology › Molecular Biology › Gut microbiota and health
- Physical Sciences › Environmental Science › Ecology › Microbial Community Ecology and Physiology
- Health Sciences › Dentistry › Periodontics › Oral microbiology and periodontitis research
- Keywords
- human microbiome, temporal variation, core microbiome, microbial community dynamics, body site differences, interindividual variability, microbiome sequencing
- MeSH terms
- Bacteria, Computer Simulation, Humans, Obesity, Organ Specificity, RNA, Ribosomal, 16S, Seasons, Time Factors, Inflammatory Bowel Diseases, Genomics, Gastrointestinal Tract, Metagenome, High-Throughput Nucleotide Sequencing
About these checks
Registry, retraction, Cites and statistics results are computed, not judged, with one exception: a printed reference that no index lists is read once by a model before it counts as a citation error. Claims are extracted by a model and kept only when their quote appears verbatim in the text; each cited source is then checked, with a model’s help, for whether it says what the claim relies on. Those verdicts can be wrong — read the claim’s quote and the cited source before relying on one.
Statistics and arithmetic are recomputed, not judged.
Confidence bands are shown only for fields calibrated on our annotated test set. None is calibrated yet, so no band is shown.
What counts as a claim ›How we measure confidence ›How we check this ›
Are you an author, or do you see a problem with this page? Request a review
