

The DOI matches its Crossref record; 48 of the 48 references it cites were found in a registry or an index.
Characterizing and measuring bias in sequence data
Open accessAbstract
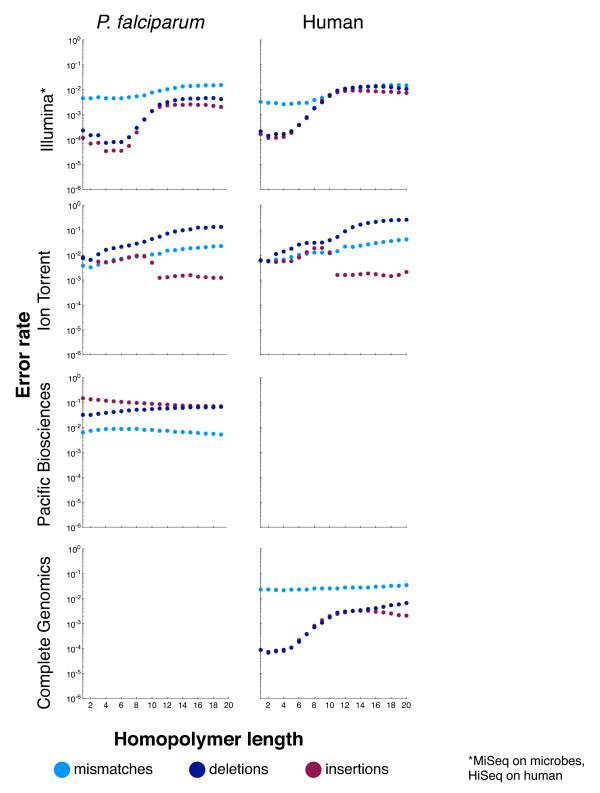
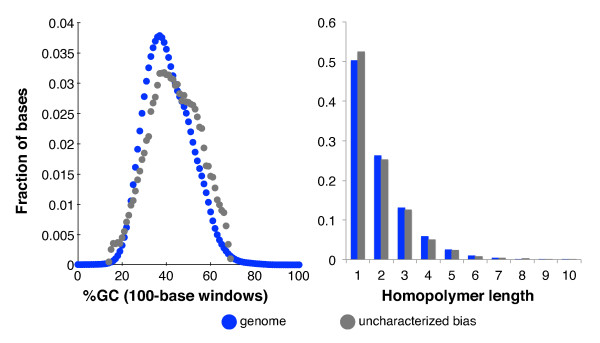
Background: DNA sequencing technologies deviate from the ideal uniform distribution of reads. These biases impair scientific and medical applications. Accordingly, we have developed computational methods for discovering, describing and measuring bias. Results: We applied these methods to the Illumina, Ion Torrent, Pacific Biosciences and Complete Genomics sequencing platforms, using data from human and from a set of microbes with diverse base compositions. As in previous work, library construction conditions significantly influence sequencing bias. Pacific Biosciences coverage levels are the least biased, followed by Illumina, although all technologies exhibit error-rate biases in high- and low-GC regions and at long homopolymer runs. The GC-rich regions prone to low coverage include a number of human promoters, so we therefore catalog 1,000 that were exceptionally resistant to sequencing. Our results indicate that combining data from two technologies can reduce coverage bias if the biases in the component technologies are complementary and of similar magnitude. Analysis of Illumina data representing 120-fold coverage of a well-studied human sample reveals that 0.20% of the autosomal genome was covered at less than 10% of the genome-wide average. Excluding locations that were similar to known bias motifs or likely due to sample-reference variations left only 0.045% of the autosomal genome with unexplained poor coverage. Conclusions: The assays presented in this paper provide a comprehensive view of sequencing bias, which can be used to drive laboratory improvements and to monitor production processes. Development guided by these assays should result in improved genome assemblies and better coverage of biologically important loci.
Overview
The claims and statistics of this paper haven’t been checked yet.
Run the check — free, no account needed. It reads the open-access text and checks the sources it cites.
Integrity signals
Registry
Cites
Statistics
Figures
Verification
Claims the paper makes
The claims and statistics of this paper haven’t been checked yet.
Run the check — free, no account needed. It reads the open-access text and checks the sources it cites.
Claims other papers make about this one
Each is checked against this paper’s own text: does it say what the citing paper says it does?
The source backs part of the claim, not all of it — or backs it for a different population, condition or comparison.
In the citing paper
“The limit of detection in these experiments is based on the inherent error rate of the Illumina platform (up to 0.4%), which has previously been described for genome editing experiment analyzed by NGS71–73.”
From A high-fidelity Cas9 mutant delivered as a ribonucleoprotein complex enables efficient gene editing in human hematopoietic stem and progenitor cells (2018) · cites this paper as [71]
Experimental — accuracy not yet measuredThe source backs part of the claim, not all of it — or backs it for a different population, condition or comparison.
In the citing paper
“The homopolymer can lead to low coupling efficiency in DNA synthesis (especially for G and C), and quantification of the number of identical nucleotides in DNA sequencing can also be problematic (39, 53).”
From Electrochemical DNA synthesis and sequencing on a single electrode with scalability for integrated data storage (2021) · cites this paper as [53]
Experimental — accuracy not yet measuredThe cited source says what the claim attributes to it.
In the citing paper
“GC content of individual sequences were previously found to affect PCR amplification efficiency in biological DNA15–17.”
From Quantifying Molecular Bias in DNA Data Storage (2019) · cites this paper as [15]
The cited source says what the claim attributes to it.
In the citing paper
“Although previous studies observed PCR bias in genomic biological sample amplification15–17, it remained unclear whether such bias is significant in DNA data storage.”
From Quantifying Molecular Bias in DNA Data Storage (2019) · cites this paper as [15]
The cited source says what the claim attributes to it.
In the citing paper
“Illumina sequencing was previously observed to have bias on GC-extreme sequences15,27,28, but GC content in our files did not show practically significant bias in the PCR GC bias test. Therefore, high-throughput sequencing and sample dilution are modeled using random sampling.”
From Quantifying Molecular Bias in DNA Data Storage (2019) · cites this paper as [15]
Self-check
Percentages, sums and reported differences re-computed from the paper’s own numbers.
The self-check needs the paper’s full text.
Citations
Cites
DNA sequencing with chain-terminating inhibitors
Sanger, F., Nicklen, S., & Coulson, A. R. (1977) · Proceedings of the National Academy of Sciences · doi:10.1073/pnas.74.12.5463 · Cited by 68,572
The Sequence Alignment/Map format and SAMtools
Li, H., Handsaker, B., Wysoker, A., Fennell, T., Ruan, J., Homer, N., Marth, G., Abecasis, G., Durbin, R., & 1000 Genome Project Data Processing Subgroup (2009) · Bioinformatics · doi:10.1093/bioinformatics/btp352 · Cited by 62,041
Fast and accurate short read alignment with Burrows-Wheeler transform
Li, H., & Durbin, R. (2009) · Bioinformatics · doi:10.1093/bioinformatics/btp324 · Cited by 58,607
The Genome Analysis Toolkit: A MapReduce framework for analyzing next-generation DNA sequencing data
McKenna, A., Hanna, M., Banks, E., Sivachenko, A., Cibulskis, K., Kernytsky, A., Garimella, K., Altshuler, D., Gabriel, S., Daly, M., et al. (2010) · Genome Research · doi:10.1101/gr.107524.110 · Cited by 27,895
Fast and accurate long-read alignment with Burrows-Wheeler transform.
Li, H., & Durbin, R. (2010) · Bioinformatics · doi:10.1093/bioinformatics/btp698 · Cited by 12,063
A framework for variation discovery and genotyping using next-generation DNA sequencing data
DePristo, M. A., Banks, E., Poplin, R., Garimella, K. V., Maguire, J. R., Hartl, C., Philippakis, A. A., del Angel, G., Rivas, M. A., Hanna, M., et al. (2011) · Nature Genetics · doi:10.1038/ng.806 · Cited by 11,456
A map of human genome variation from population-scale sequencing.
The 1000 Genomes Project Consortium (2010) · Nature · doi:10.1038/nature09534 · Cited by 7,877
Genome sequencing in microfabricated high-density picolitre reactors
Margulies, M., Egholm, M., Altman, W. E., Attiya, S., Bader, J. S., Bemben, L. A., Berka, J., Braverman, M. S., Chen, Y.-J., Chen, Z., et al. (2005) · Nature · doi:10.1038/nature03959 · Cited by 7,693
Real-Time DNA Sequencing from Single Polymerase Molecules
Eid, J., Fehr, A., Gray, J., Luong, K., Lyle, J., Otto, G., Peluso, P., Rank, D., Baybayan, P., Bettman, B., et al. (2009) · Science · doi:10.1126/science.1162986 · Cited by 3,732
Accurate whole human genome sequencing using reversible terminator chemistry
Bentley, D. R., Balasubramanian, S., Swerdlow, H. P., Smith, G. P., Milton, J., Brown, C. G., Hall, K. P., Evers, D. J., Barnes, C. L., Bignell, H. R., et al. (2008) · Nature · doi:10.1038/nature07517 · Cited by 3,684
Self-citation
Research works printed but not linked: 1
- Pruitt K, Brown G, Tatusova T, Maglott D: Chapter 18: The Reference Sequence (RefSeq) Database. The NCBI Handbook [Internet]. Edited by: McEntyre J, Ostell J Bethesda (MD): National Center for Biotechnology Information (US). 2002, [http://www.ncbi.nlm.nih.gov/books/NBK21091/]
Cited by
Walker, B. J., Abeel, T., Shea, T., Priest, M., Abouelliel, A., Sakthikumar, S., Cuomo, C. A., Zeng, Q., Wortman, J., Young, S. K., et al. (2014) · PLoS ONE · doi:10.1371/journal.pone.0112963 · Cited by 9,197
Canu: scalable and accurate long-read assembly via adaptive k -mer weighting and repeat separation
Koren, S., Walenz, B. P., Berlin, K., Miller, J. R., Bergman, N. H., & Phillippy, A. M. (2017) · Genome Research · doi:10.1101/gr.215087.116 · Cited by 7,304
NOVOPlasty: de novo assembly of organelle genomes from whole genome data
Dierckxsens, N., Mardulyn, P., & Smits, G. (2016) · Nucleic Acids Research · doi:10.1093/nar/gkw955 · Cited by 2,838
Qualimap 2: advanced multi-sample quality control for high-throughput sequencing data
Okonechnikov, K., Conesa, A., & García-Alcalde, F. (2016) · Bioinformatics · doi:10.1093/bioinformatics/btv566 · Cited by 2,145
(2015) · doi:10.7717/peerj.1165 · Cited by 1,960
Metadata
- Authors
- Ross, M. G., Russ, C., Costello, M., Hollinger, A., Lennon, N. J., Hegarty, R., Nusbaum, C., & Jaffe, D. B.
- Affiliations
- Broad Institute (US)
- Corresponding author
- Ross, Michael G
- Venue
- Genome Biology
- Published
- 2013-05-29
- Volume
- 14
- Issue
- 5
- Pages
- R51-R51
- ISSN
- 1465-6906 (ISSN-L)
- 1474-760X
- PMC
- PMC4053816
- OpenAlex
- W1971584645
- Cited by
- 909
- References
- 48
- Citations by year
- 2026: 36 · 2025: 49 · 2024: 60 · 2023: 61 · 2022: 59 · 2021: 85 · 2020: 75 · 2019: 76 · 2018: 71 · 2017: 83 · 2016: 105 · 2015: 83 · 2014: 60 · 2013: 6
- FWCI
- 37.71
- Type
- journal article
- Language
- en
- Open access
- gold
- doi.org
- Licence
- cc-by
- creativecommons.org/licenses/by/2.0/ (tdm)
- creativecommons.org/licenses/by/2.0/ (vor)
- Locations
- Genome biology (publishedVersion, cc-by)
- Europe PMC (PubMed Central) (publishedVersion, cc-by)
- PubMed Central (publishedVersion, cc-by)
- PubMed (publishedVersion)
- Funders
- U.S. Department of Health and Human Services (HHSN272200900018C)
- Broad Institute (U54HG003067)
- National Institutes of Health (HHSN272200900018C)
- National Human Genome Research Institute (U54HG003067, R01HG003474)
- National Institute of Allergy and Infectious Diseases (HHSN272200900018C)
- Topics
- Life Sciences › Biochemistry, Genetics and Molecular Biology › Molecular Biology › Genomics and Phylogenetic Studies
- Life Sciences › Biochemistry, Genetics and Molecular Biology › Molecular Biology › Fractal and DNA sequence analysis
- Life Sciences › Biochemistry, Genetics and Molecular Biology › Genetics › Genomic variations and chromosomal abnormalities
- Keywords
- sequencing bias, GC content bias, human promoters, library construction, genome assembly, PacBio, Illumina, Ion Torrent, microbial genomes
- MeSH terms
- Algorithms, Base Composition, Humans, Promoter Regions, Genetic, Genome, Human, Genome, Bacterial, Sequence Analysis, DNA, Genome, Protozoan, Genomics
About these checks
Registry, retraction, Cites and statistics results are computed, not judged, with one exception: a printed reference that no index lists is read once by a model before it counts as a citation error. Claims are extracted by a model and kept only when their quote appears verbatim in the text; each cited source is then checked, with a model’s help, for whether it says what the claim relies on. Those verdicts can be wrong — read the claim’s quote and the cited source before relying on one.
Statistics and arithmetic are recomputed, not judged.
Confidence bands are shown only for fields calibrated on our annotated test set. None is calibrated yet, so no band is shown.
What counts as a claim ›How we measure confidence ›How we check this ›
Are you an author, or do you see a problem with this page? Request a review
How to cite
Cite CoChat for the checks on this page, and the paper for its own findings.
- This page
- CoChat. (2026). Citation check: Characterizing and measuring bias in sequence data. https://app.cochat.ai/papers/10.1186/gb-2013-14-5-r51
- The paper
- Ross, M. G., Russ, C., Costello, M., Hollinger, A., Lennon, N. J., Hegarty, R., Nusbaum, C., & Jaffe, D. B. (2013). Characterizing and measuring bias in sequence data. Genome Biology. https://doi.org/10.1186/gb-2013-14-5-r51
Data sources
Bibliographic data: Semantic Scholar, OpenAlex, Crossref.
Contains information from the Semantic Scholar Academic Graph Datasets, made available under the ODC Attribution License (ODC-BY 1.0).
Semantic Scholar’s data is described in: Kinney, R., et al. (2023). The Semantic Scholar Open Data Platform. arXiv:2301.10140.
