

The DOI matches its Crossref record; 54 of the 54 references it cites were found in a registry or an index.
Exploration of bacterial community classes in major human habitats
Open accessAbstract
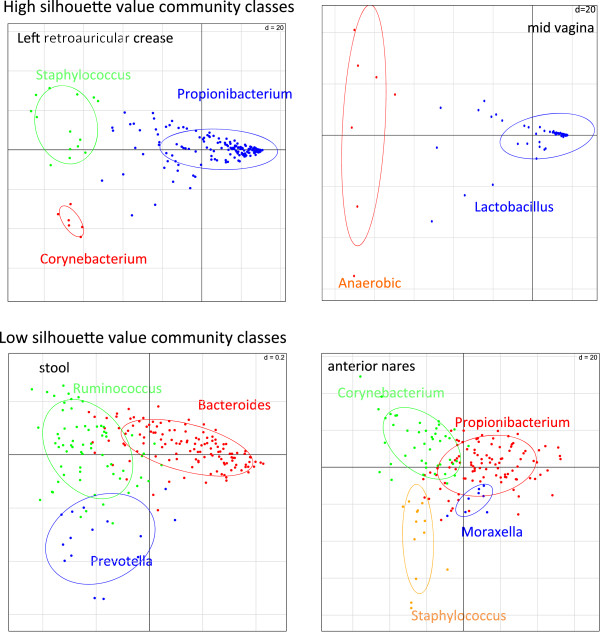
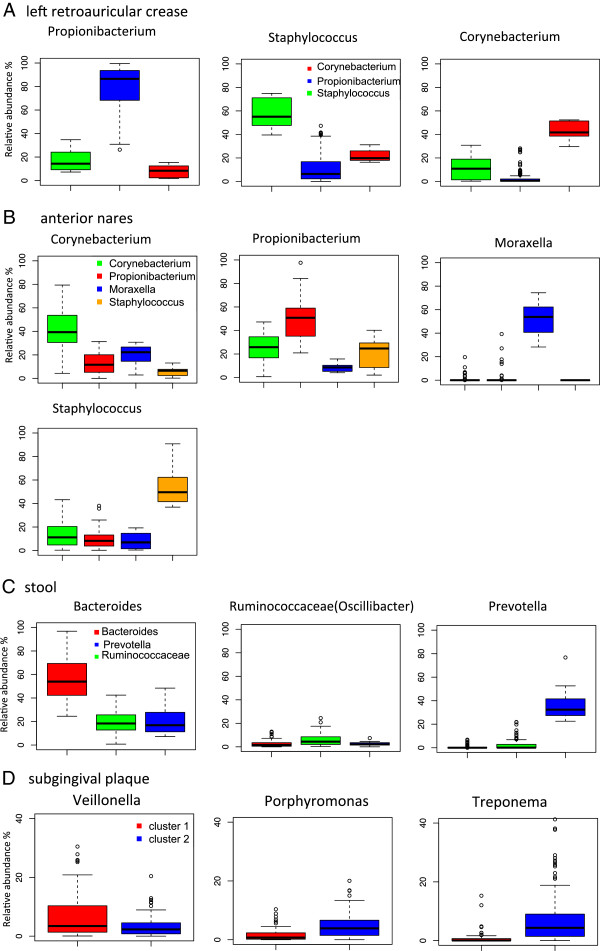
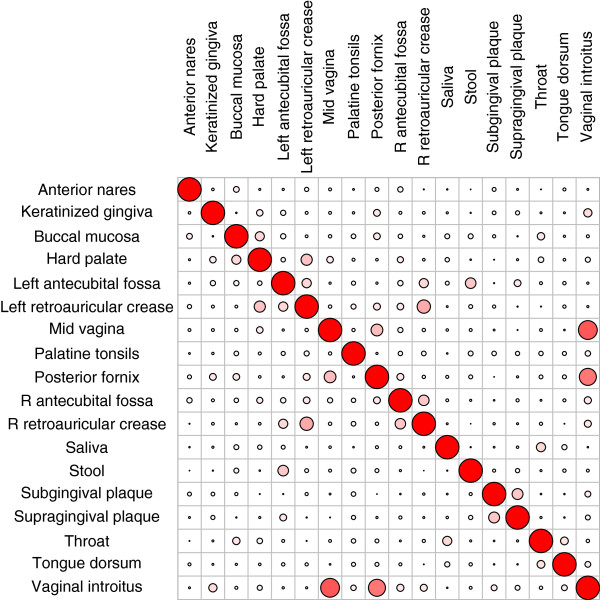
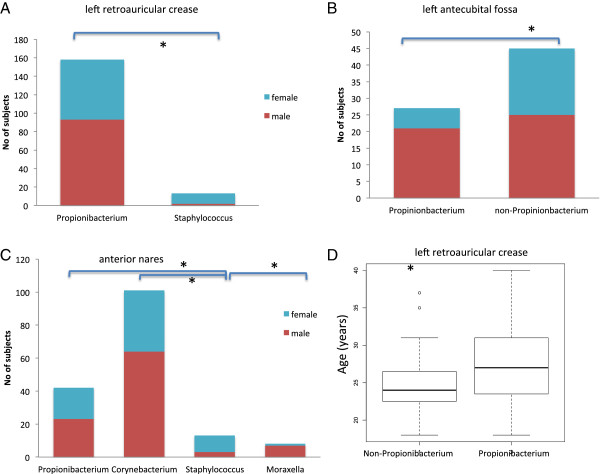
Background: Determining bacterial abundance variation is the first step in understanding bacterial similarity between individuals. Categorization of bacterial communities into groups or community classes is the subsequent step in describing microbial distribution based on abundance patterns. Here, we present an analysis of the groupings of bacterial communities in stool, nasal, skin, vaginal and oral habitats in a healthy cohort of 236 subjects from the Human Microbiome Project. Results: We identify distinct community group patterns in the anterior nares, four skin sites, and vagina at the genus level. We also confirm three enterotypes previously identified in stools. We identify two clusters with low silhouette values in most oral sites, in which bacterial communities are more homogeneous. Subjects sharing a community class in one habitat do not necessarily share a community class in another, except in the three vaginal sites and the symmetric habitats of the left and right retroauricular creases. Demographic factors, including gender, age, and ethnicity, significantly influence community composition in several habitats. Community classes in the vagina, retroauricular crease and stool are stable over approximately 200 days. Conclusion: The community composition, association of demographic factors with community classes, and demonstration of community stability deepen our understanding of the variability and dynamics of human microbiomes. This also has significant implications for experimental designs that seek microbial correlations with clinical phenotypes.
Overview
The claims and statistics of this paper haven’t been checked yet.
Run the check — free, no account needed. It reads the open-access text and checks the sources it cites.
Integrity signals
Registry
Cites
Statistics
Figures
Verification
Claims the paper makes
The claims and statistics of this paper haven’t been checked yet.
Run the check — free, no account needed. It reads the open-access text and checks the sources it cites.
Claims other papers make about this one
Each is checked against this paper’s own text: does it say what the citing paper says it does?
The source backs part of the claim, not all of it — or backs it for a different population, condition or comparison.
In the citing paper
“Prevotella is normally found in only a small percentage of healthy individuals in European and American cohorts [1, 2, 20, 210].”
From The athletic gut microbiota (2020) · cites this paper as [20]
Experimental — accuracy not yet measuredIn the citing paper
“At the phylum level, Lentisphaerae and Acidobacteria, whose functions in the human gut are unknown, were detected after running.”
From The athletic gut microbiota (2020) · cites this paper as [20]
In the citing paper
“According to the alpha diversity analysis, there were few differences in diversity, nevertheless, abundances of certain microbiota members showed differences before and after running.”
From The athletic gut microbiota (2020) · cites this paper as [20]
In the citing paper
“At the species level there was a marked increase in the families Coriobacteriaceae and Succinivibrionaceae.”
From The athletic gut microbiota (2020) · cites this paper as [20]
In the citing paper
“At the genus level, half-marathon running reduced the abundance of fecal Ezakiella, Romboutsia, and Actinobacillus, but increased the abundance of Coprococcus and Ruminococcus bicirculans.”
From The athletic gut microbiota (2020) · cites this paper as [20]
In the citing paper
“Interestingly, the pentose phosphate pathway, a metabolic pathway parallel to glycolysis and involving the oxidation of glucose, was the most enriched pathway after a half-marathon run.”
From The athletic gut microbiota (2020) · cites this paper as [20]
In the citing paper
“The anterior nares are closest to the external environment and are lined with a skin-like keratinized squamous epithelium, including serous and sebaceous glands, the latter of which produces sebum, which leads to the enrichment of lipophilic skin colonizers, including Staphylococcus spp., Propionibacterium spp. and Corynebacterium spp.46,47,48.”
From The microbiota of the respiratory tract: gatekeeper to respiratory health (2017) · cites this paper as [48]
In the citing paper
“Bacteria that are frequently found in other respiratory niches, including Moraxella spp., Dolosigranulum spp. and Streptococcus spp., have also been observed in the anterior nares29,43,48,49.”
From The microbiota of the respiratory tract: gatekeeper to respiratory health (2017) · cites this paper as [48]
Self-check
Percentages, sums and reported differences re-computed from the paper’s own numbers.
The self-check needs the paper’s full text.
Citations
Cites
vegan: Community Ecology Package
Oksanen, J., Simpson, G. L., Blanchet, F. G., Kindt, R., Legendre, P., Minchin, P. R., O’Hara, R. B., Sólymos, P., Stevens, M. H. H., Szöcs, E., et al. (2001) · doi:10.32614/cran.package.vegan · Cited by 27,099
Silhouettes: A graphical aid to the interpretation and validation of cluster analysis
Rousseeuw, P. J. (1987) · Journal of Computational and Applied Mathematics · doi:10.1016/0377-0427(87)90125-7 · Cited by 21,392
Structure, function and diversity of the healthy human microbiome
The Human Microbiome Project Consortium (2012) · Nature · doi:10.1038/nature11234 · Cited by 11,726
Self-citationHuman gut microbes associated with obesity
Ley, R. E., Turnbaugh, P. J., Klein, S., & Gordon, J. I. (2006) · Nature · doi:10.1038/4441022a · Cited by 8,785
SPECIES ASSEMBLAGES AND INDICATOR SPECIES:THE NEED FOR A FLEXIBLE ASYMMETRICAL APPROACH
Dufrêne, M., & Legendre, P. (1997) · Ecological Monographs · doi:10.1890/0012-9615(1997)067[0345:saaist]2.0.co;2 · Cited by 8,537
Hubert, L., & Arabie, P. (1985) · Journal of Classification · doi:10.1007/bf01908075 · Cited by 8,219
Diversity of the Human Intestinal Microbial Flora
Eckburg, P. B., Bik, E. M., Bernstein, C. N., Purdom, E., Dethlefsen, L., Sargent, M., Gill, S. R., Nelson, K. E., & Relman, D. A. (2005) · Science · doi:10.1126/science.1110591 · Cited by 7,913
Human gut microbiome viewed across age and geography
Yatsunenko, T., Rey, F. E., Manary, M. J., Trehan, I., Dominguez-Bello, M. G., Contreras, M., Magris, M., Hidalgo, G., Baldassano, R. N., Anokhin, A. P., et al. (2012) · Nature · doi:10.1038/nature11053 · Cited by 7,815
Enterotypes of the human gut microbiome
MetaHIT Consortium (additional members), Arumugam, M., Raes, J., Pelletier, E., Le Paslier, D., Yamada, T., Mende, D. R., Fernandes, G. R., Tap, J., Bruls, T., et al. (2011) · Nature · doi:10.1038/nature09944 · Cited by 7,548
The ade4 Package: Implementing the Duality Diagram for Ecologists
Dray, S., & Dufour, A. (2007) · Journal of Statistical Software · doi:10.18637/jss.v022.i04 · Cited by 6,740
Research works printed but not linked: 4
- NCBI SRA: HMP 16s rRNA gene. [http://www.ncbi.nlm.nih.gov/sra/?term=SRP002395]
- NCBI BioProject: HMP shotgun data. [http://www.ncbi.nlm.nih.gov/bioproject/48479]
- Maechler M, Rousseeuw P, Struyf A, Hubert M, Hornik K: cluster: Cluster Analysis Basics and Extensions. 2013, R package version 1.14.4.
- HMP Metadata. [http://www.ncbi.nlm.nih.gov/gap/?term=phs000228.v3.p1]
Cited by
Sorted by citations
Items 101–150 of 150
Shah, V. (2021) · Microbiology Insights · doi:10.1177/1178636120988604 · Cited by 6
Jang, Y.-J., Choi, H. S., Oh, I., Chung, J. H., & Moon, J. S. (2024) · Probiotics and Antimicrobial Proteins · doi:10.1007/s12602-024-10257-9 · Cited by 6
Fernández‐Fernández, R., Abdullahi, I. N., González‐Azcona, C., Ulloa, A., Martínez, A., García-Vela, S., Höfle, Ú., Zarazaga, M., Lozano, C., & Torres, C. (2023) · Frontiers in Microbiology · doi:10.3389/fmicb.2023.1144975 · Cited by 7
Du, L., Cheng, X., Liu, B., Hao, Y., Long, Z., Hu, Q., Huo, B., Xie, T., Cheng, Q., Zhou, Y., et al. (2025) · International Journal of Molecular Sciences · doi:10.3390/ijms262412061 · Cited by 5
Self-citationAirway Microbiota Profiles in Children With and Without Asthma: A Comparative Study
Alamri, A. M., Alhassan, M., Almutairi, A. K., Jayaseeli, N., Berg, R. P. K. D., Stensvold, C. R., Andersen, L. O., Nielsen, H. V., & AlKhater, S. A. (2025) · Journal of Asthma and Allergy · doi:10.2147/jaa.s498803 · Cited by 5
Lucas, E. J., Ching, C. B., Saraswat, S., Dabdoub, S. M., Kumar, P. P., & Justice, S. S. (2020) · Frontiers in Pediatrics · doi:10.3389/fped.2020.542413 · Cited by 5
ENIGMA: an enterotype-like unigram mixture model for microbial association analysis
Abe, K., Hirayama, M., Ohno, K., & Shimamura, T. (2019) · BMC Genomics · doi:10.1186/s12864-019-5476-9 · Cited by 5
Qin, L., Pan, J., Feng, D., Yu, B., Li, S., Liu, X., Jin, Y., Zhu, S., Wu, W., & Yang, W. (2025) · Toxics · doi:10.3390/toxics13030180 · Cited by 4
González-García, S., Hamdan‐Partida, A., Pérez‐Ramos, J., Garrido, J. F. A., Bustos-Hamdan, A., & Bustos‐Martínez, J. (2024) · Journal of Medical Microbiology · doi:10.1099/jmm.0.001940 · Cited by 4
Liu, T., Xu, P., Du, Y., Lu, H. J., Zhao, H., & Wang, T. (2021) · Briefings in Bioinformatics · doi:10.1093/bib/bbab443 · Cited by 4
López‐García, E., Benítez‐Cabello, A., Larriva, A. P. A.-D., Gutierrez-Mariscal, F. M., Pérez-Martínez, P., Yubero‐Serrano, E. M., Arroyo‐López, F. N., & Garrido-Fernández, A. (2023) · Biomedicines · doi:10.3390/biomedicines11082134 · Cited by 4
Xu, X., Zhou, Y., Wenyuan, S., Ya-ling, L., & Zhou, X. (2015) · Springer eBooks · doi:10.1007/978-3-662-47450-1_2 · Cited by 4
Self-citationSun, S., Zhang, X., & Peng, Q. (2016) · Artificial Intelligence in Medicine · doi:10.1016/j.artmed.2016.11.004 · Cited by 4
Martı́n, M. Á., Crawford, J. W., Neal, A. L., & García‐Gutiérrez, C. (2021) · Fractals · doi:10.1142/s0218348x21502108 · Cited by 4
Jia, B., Wu, X., He, G., Wang, Q., Guan, L., Ren, J., Li, G., Zheng, X., & Yang, S. (2025) · Frontiers in Public Health · doi:10.3389/fpubh.2025.1696041 · Cited by 6
Gut Homeostasis; Microbial Cross Talks in Health and Disease Management
Khatri, G. S., Kurian, C., Anand, A., & Paari, K. A. (2021) · Current Research in Nutrition and Food Science Journal · doi:10.12944/crnfsj.9.3.28 · Cited by 3
The modulatory approaches of microbiome therapeutics
Tembhre, M. K., Shipra, Imran, S., & Jaiswal, K. P. (2023) · Elsevier eBooks · doi:10.1016/b978-0-323-99336-4.00013-6 · Cited by 2
Metabolic multi-stability and hysteresis in a model aerobe-anaerobe microbiome communityPreprint
Khazaei, T., Williams, R. L., Bogatyrev, S. R., Doyle, J. C., Henry, C. S., & Ismagilov, R. F. (2020) · bioRxiv (Cold Spring Harbor Laboratory) · doi:10.1101/2020.02.28.968941 · Cited by 2
The upper respiratory tract microbiome and its role in human health: biotopes and variability
Starikova, E. V., Galeeva, J. S., & Ilina, E. N. (2022) · PULMONOLOGIYA · doi:10.18093/0869-0189-2022-32-5-745-754 · Cited by 1
Interplay of the nasal microbiome and epigenome among adolescents
Bozack, A. K., Pérez-García, J., Rifas‐Shiman, S. L., Zhou, Y., Sordillo, J. E., Lee, J. J., Coull, B. A., Lai, P. S., Oken, E., Hivert, M., et al. (2026) · Clinical Epigenetics · doi:10.1186/s13148-026-02093-1 · Cited by 1
Self-citationZhang, W. H., Du, J., Dong, L., Zhang, S.-S., Song, G., Ao, L., Wang, Y., Ma, L., Sun, W., Ma, J., et al. (2026) · Cell Reports · doi:10.1016/j.celrep.2026.117097 · Cited by 1
Characterizing the nasal microbiome using a nasal allergen challenge model
Linton, S., Sjaarda, C., Hossenbaccus, L., Davis, A., Greenlaw, J., Douchant, K., Thiele, J., Garvey, S., Botting, H., Steacy, L. M., et al. (2026) · Journal of Allergy and Clinical Immunology · doi:10.1016/j.jaci.2026.05.003 · Cited by 1
Methods for Microbiome Analysis
Ibrahim, K. S., & Kumar, N. S. (2017) · Translational medicine research · doi:10.1007/978-94-024-1045-7_12 · Cited by 1
Vinogradova, K. O., Gavrilyuk, V. G., Sklyar, T. V., & Соколова, И. Е. (2020) · Ukraïnsʹkij žurnal medicini bìologìï ta sportu · doi:10.26693/jmbs05.04.229 · Cited by 1
Allergic Rhinitis and Chronic Rhinosinusitis
Kloepfer, K. M., Singh, A., & Ramakrishnan, V. R. (2022) · Respiratory medicine · doi:10.1007/978-3-030-87104-8_4 · Cited by 1
Microbiome in Upper Respiratory Tract Infections
Mittal, P., Mittal, M., Rawat, U., & Ambika (2022) · Springer eBooks · doi:10.1007/978-981-16-8957-4_17 · Cited by 1
Li, C., Ravikrishnan, A., Wijaya, I., Naim, A. N. M., Gounot, J.-S., Wearne, S., On, Y. Y., Ho, E. X. P., Png, E., Kwah, J. S., et al. (2025) · bioRxiv (Cold Spring Harbor Laboratory) · doi:10.1101/2025.04.24.650393 · Cited by 1
BİLGİ, S. T. (2020) · International Journal of Scientific and Technological Research · doi:10.7176/jstr/6-01-04
Lee, M., Hsu, Y.-J., Ho, H.-H., Kuo, Y., Lin, W., Tsai, S., Chen, W., Lin, C.-L., & Huang, C. (2021) · Research Square · doi:10.21203/rs.3.rs-558635/v1
Research in Exercise Science and Gut Microbiota: A Two-way Relationship
Petriz, B. A., de Almeida, J. A., Ribeiro, F. M., & Franco, O. L. (2021) · Elsevier eBooks · doi:10.1016/b978-0-12-819265-8.00066-8
Comercialización de la maquinaria: problemas y limitaciones
Roig, M. G. (2005) · Fruticultura profesional
Cotter, P. D., & Barton, W. (2019) · Faculty Opinions – Post-Publication Peer Review of the Biomedical Literature · doi:10.3410/f.728374643.793567398
Meta-analysis identifies common gut microbiota signatures in patients with multiple sclerosisPreprint
Lin, Q., Dorsett, Y., Mirza, A., Tremlett, H. L., Piccio, L. M., Longbrake, E. E., Choileáin, S. N., Hafler, D. A., Cox, L. M., Weiner, H. L., et al. (2022) · Research Square · doi:10.21203/rs.3.rs-2026810/v1
Self-citationZhang, C., Wang, M., Liu, H., Jiang, X., Chen, X., Liu, T., Yin, Q., Wang, Y., Deng, L., Yao, J., et al. (2023) · Figshare · doi:10.6084/m9.figshare.22790578
Imran, M., & Ahmad, B. (2024) · Springer eBooks · doi:10.1007/978-981-97-6948-3_2 · Cited by 1
Gut Barrier Permeability, Microbiota, and Brain Health
Madison, A. A., Duff, A. F., & Bailey, M. T. (2025) · Oxford University Press eBooks · doi:10.1093/oxfordhb/9780190931544.013.17
Zhang, C., Wang, M. Y., Liu, H., Jiang, X., Chen, X., Liu, T., Yin, Q., Wang, Y., Deng, L., Yao, J., et al. (2023) · Figshare · doi:10.6084/m9.figshare.22790572
Étude bioinformatique des génomes de Porphyromonas
Acuña-Amador, L. (2017) · theses.fr (ABES) · doi:10.70675/c279fa04z0158z4b22z83e9z15e653f91b25
The Sinonasal Microbiome in ENP
Cavaliere, C., & Loperfido, A. (2026) · Springer eBooks · doi:10.1007/978-3-032-17378-2_28-1
Muthuvel, I., Priyadharshini, D., Ponnaiah, S. K., Kavitha, P. S., & Selvaraj, K. V. (2026) · Springer eBooks · doi:10.1007/978-3-032-29927-7_7
Gut Microbiota and Psoriatic Arthritis: From Pathogenesis to Microbiota-Targeted Therapies
Valentini, S., Lorenzini, S., Gentileschi, S., Cantarini, L., Frediani, B., & Baldi, C. (2026) · Rheumato · doi:10.3390/rheumato6030018
Investigation of sexual assault cases using microflora
Alenezi, D., Mousawi, F., & Haidar, M. (2026) · Elsevier eBooks · doi:10.1016/b978-0-443-40634-8.00032-5
Yang, Y., Cui, J., Dong, X., Huang, Y., An, J., Cui, T., Ou, X., Liu, T., Gao, X., Zhang, H., et al. (2026) · Pathogens · doi:10.3390/pathogens15090883
Metadata
- Authors
- Zhou, Y., Mihindukulasuriya, K. A., Gao, H., La Rosa, P. S., Wylie, K. M., Martin, J. C., Kota, K., Shannon, W. D., Mitreva, M., Sodergren, E., & Weinstock, G. M.
- Affiliations
- Washington University in St. Louis (US)
- Indiana University School of Medicine (US)
- Corresponding author
- Weinstock, George M
- ORCID
- Venue
- Genome Biology
- Published
- 2014-05-07
- Volume
- 15
- Issue
- 5
- Pages
- R66-R66
- ISSN
- 1465-6906 (ISSN-L)
- 1474-760X
- PMC
- PMC4073010
- OpenAlex
- W2150785952
- Cited by
- 149
- References
- 54
- Citations by year
- 2026: 8 · 2025: 10 · 2024: 10 · 2023: 10 · 2022: 15 · 2021: 21 · 2020: 19 · 2019: 16 · 2018: 4 · 2017: 13 · 2016: 8 · 2015: 11 · 2014: 3
- FWCI
- 4.78
- Type
- journal article
- Language
- en
- Open access
- gold
- doi.org
- Locations
- Genome biology (publishedVersion, cc-by)
- Europe PMC (PubMed Central) (publishedVersion, cc-by)
- PubMed Central (publishedVersion, cc-by)
- PubMed (publishedVersion)
- Digital Commons@Becker (Washington University School of Medicine) (submittedVersion)
- IUScholarWorks (Indiana University) (submittedVersion, cc-by)
- Funders
- National Institutes of Health
- National Human Genome Research Institute (U54HG004968)
- Common Fund
- Topics
- Life Sciences › Biochemistry, Genetics and Molecular Biology › Molecular Biology › Gut microbiota and health
- Physical Sciences › Environmental Science › Ecology › Microbial Community Ecology and Physiology
- Health Sciences › Dentistry › Periodontics › Oral microbiology and periodontitis research
- Keywords
- human microbiome, enterotypes, gut microbiota, nasal microbiota, skin microbiome, vaginal microbiota, oral microbiota, microbial community stability, demographic factors, Human Microbiome Project
- MeSH terms
- Bacteria, Demography, Feces, Female, Humans, Mouth, Nose, Skin, Vagina, Microbiota
About these checks
Registry, retraction, Cites and statistics results are computed, not judged, with one exception: a printed reference that no index lists is read once by a model before it counts as a citation error. Claims are extracted by a model and kept only when their quote appears verbatim in the text; each cited source is then checked, with a model’s help, for whether it says what the claim relies on. Those verdicts can be wrong — read the claim’s quote and the cited source before relying on one.
Statistics and arithmetic are recomputed, not judged.
Confidence bands are shown only for fields calibrated on our annotated test set. None is calibrated yet, so no band is shown.
What counts as a claim ›How we measure confidence ›How we check this ›
Are you an author, or do you see a problem with this page? Request a review
