

The DOI matches its Crossref record; 45 of the 45 references it cites were found in a registry or an index.
Phospholipids and insulin resistance in psychosis: a lipidomics study of twin pairs discordant for schizophrenia
Open accessAbstract
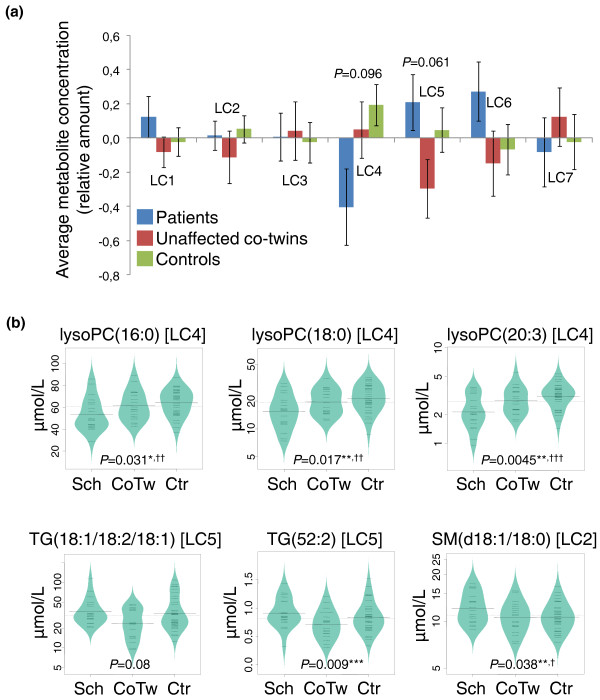
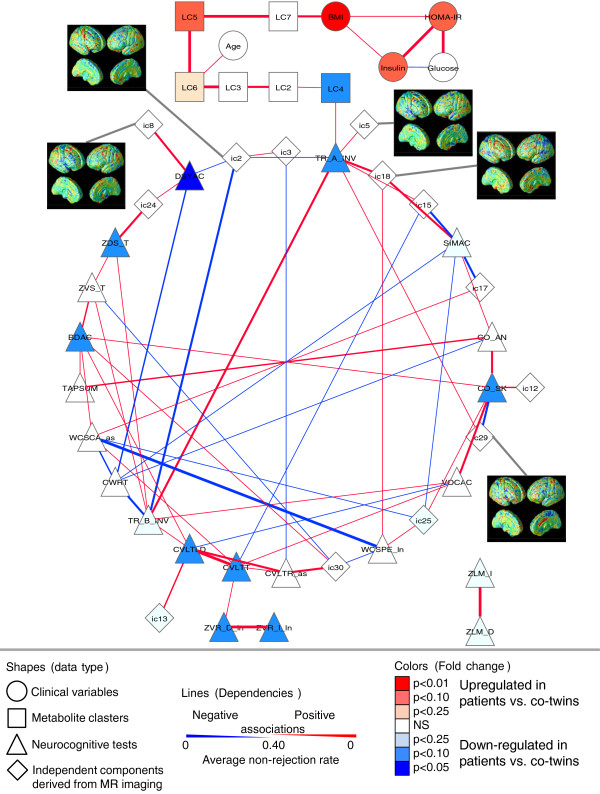
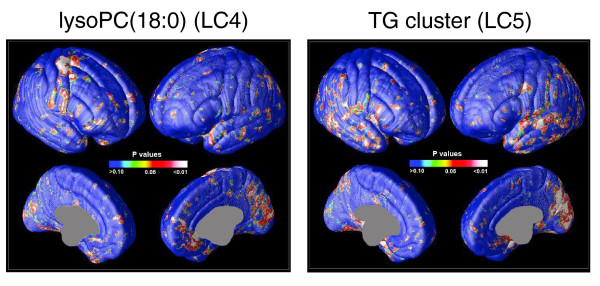
BACKGROUND: Several theories have been proposed to conceptualize the pathological processes inherent to schizophrenia. The 'prostaglandin deficiency' hypothesis postulates that defective enzyme systems converting essential fatty acids to prostaglandins lead to diminished levels of prostaglandins, which in turn affect synaptic transmission. METHODS: Here we sought to determine the lipidomic profiles associated with schizophrenia in twin pairs discordant for schizophrenia as well as unaffected twin pairs. The study included serum samples from 19 twin pairs discordant for schizophrenia (mean age 51 ± 10 years; 7 monozygotic pairs; 13 female pairs) and 34 age and gender matched healthy twins as controls. Neurocognitive assessment data and gray matter density measurements taken from high-resolution magnetic resonance images were also obtained. A lipidomics platform using ultra performance liquid chromatography coupled to time-of-flight mass spectrometry was applied for the analysis of serum samples. RESULTS: In comparison to their healthy co-twins, the patients had elevated triglycerides and were more insulin resistant. They had diminished lysophosphatidylcholine levels, which associated with decreased cognitive speed. CONCLUSIONS: Our findings may be of pathophysiological relevance since lysophosphatidylcholines, byproducts of phospholipase A2-catalyzed phospholipid hydrolysis, are preferred carriers of polyunsaturated fatty acids across the blood-brain barrier. Furthermore, diminishment of lysophosphatidylcholines suggests that subjects at risk of schizophrenia may be more susceptible to infections. Their association with cognitive speed supports the view that altered neurotransmission in schizophrenia may be in part mediated by reactive lipids such as prostaglandins.
Overview
The claims and statistics of this paper haven’t been checked yet.
Run the check — free, no account needed. It reads the open-access text and checks the sources it cites.
Integrity signals
Registry
Cites
Statistics
Figures
Verification
Claims the paper makes
The claims and statistics of this paper haven’t been checked yet.
Run the check — free, no account needed. It reads the open-access text and checks the sources it cites.
Claims other papers make about this one
Each is checked against this paper’s own text: does it say what the citing paper says it does?
In the citing paper
“Nine studies evaluated the broad panels of different lipid markers in patients with SCZ [31,34,40,41,42,43,44,45,46] and detected statistical differences in the following lipid classes: fatty acyls, sterols, glycerolipids, sphingolipids, glycerophospholipids, and products of lipid metabolism.”
From Lipids in Psychiatric Disorders: Functional and Potential Diagnostic Role as Blood Biomarkers (2024) · cites this paper as [43]
Self-check
Percentages, sums and reported differences re-computed from the paper’s own numbers.
The self-check needs the paper’s full text.
Citations
Cites
Lusis, A. J. (2000) · Nature · doi:10.1038/35025203 · Cited by 4,880
The Structured Clinical Interview for DSM-III-R (SCID): I: History, Rationale, and Description
Spitzer, R. L. (1992) · Archives of General Psychiatry · doi:10.1001/archpsyc.1992.01820080032005 · Cited by 4,336
Pluskal, T., Castillo, S., Villar‐Briones, A., & Orešič, M. (2010) · BMC Bioinformatics · doi:10.1186/1471-2105-11-395 · Cited by 3,852
Self-citationRemission in Schizophrenia: Proposed Criteria and Rationale for Consensus
Andreasen, N. C., Carpenter, W. T., Kane, J. M., Lasser, R. A., Marder, S. R., & Weinberger, D. R. (2005) · American Journal of Psychiatry · doi:10.1176/appi.ajp.162.3.441 · Cited by 2,350
Negative Symptoms in Schizophrenia: Definition and Reliability
Andreasen, N. C. (1982) · Archives of General Psychiatry · doi:10.1001/archpsyc.1982.04290070020005 · Cited by 2,247
Negative v Positive Schizophrenia
Andreasen, N. C. (1982) · Archives of General Psychiatry · doi:10.1001/archpsyc.1982.04290070025006 · Cited by 2,008
Amminger, G. P., Schäfer, M. R., Papageorgiou, K., Klier, C. M., Cotton, S. M., Harrigan, S. M., Mackinnon, A., McGorry, P. D., & Berger, G. E. (2010) · Archives of General Psychiatry · doi:10.1001/archgenpsychiatry.2009.192 · Cited by 896
Inflammatory cytokine alterations in schizophrenia: a systematic quantitative review
Potvin, S., Stip, E., Sepehry, A. A., Gendron, A., Bah, R., & Kouassi, E. (2008) · Biological Psychiatry · doi:10.1016/j.biopsych.2007.09.024 · Cited by 858
Kotronen, A., & Yki‐Järvinen, H. (2007) · Arteriosclerosis Thrombosis and Vascular Biology · doi:10.1161/atvbaha.107.147538 · Cited by 793
Beanplot: A Boxplot Alternative for Visual Comparison of Distributions
Kampstra, P. (2008) · Journal of Statistical Software · doi:10.18637/jss.v028.c01 · Cited by 735
Research works printed but not linked: 2
- American Psychiatric Association: Diagnostic and Statistical Manual for Mental Disorders. 1994, Washington, DC: American Psychiatric Association, 4
- Suvisaari JM, Saarni SI, Perala J, Suvisaari JV, Harkanen T, Lonnqvist J, Reunanen A: Metabolic syndrome among persons with schizophrenia and other psychotic disorders in a general population survey. J Clin Psychiatry. 2007, 68: 1045-1055. 10.4088/JCP.v68n0711. · DOI
Cited by
Sorted by citations
Wooff, Y., Man, S. M., Aggio‐Bruce, R., Natoli, R., & Fernando, N. (2019) · Frontiers in Immunology · doi:10.3389/fimmu.2019.01618 · Cited by 250
Analytical Methods in Lipidomics and Their Applications
Li, M., Li, Y., Bai, Y., & Liu, H. (2013) · Analytical Chemistry · doi:10.1021/ac403554h · Cited by 220
Wang, J., Zibetti, C., Shang, P., Sripathi, S. R., Zhang, P., Cano, M., Hoang, T., Xia, S., Ji, H., Merbs, S. L., et al. (2018) · Nature Communications · doi:10.1038/s41467-018-03856-y · Cited by 185
Inflammation in schizophrenia: A question of balance
Leza, J. C., García‐Bueno, B., Bioque, M., Arango, C., Parellada, M., Kim, Q., O’Donnell, P., & Bernardo, M. (2015) · Neuroscience & Biobehavioral Reviews · doi:10.1016/j.neubiorev.2015.05.014 · Cited by 188
A genomic perspective on HLA evolution
Meyer, D., Aguiar, V. R. C., Bitarello, B. D., Brandt, D. Y. C., & Nunes, K. (2017) · Immunogenetics · doi:10.1007/s00251-017-1017-3 · Cited by 190
Metadata
- Authors
- Orešič, M., Seppänen-Laakso, T., Sun, D., Tang, J., Therman, S., Viehman, R., Mustonen, U., van Erp, T. G., Hyötyläinen, T., Thompson, P., Toga, A. W., Huttunen, M. O., Suvisaari, J., Kaprio, J., Lönnqvist, J., & Cannon, T. D.
- Affiliations
- VTT Technical Research Centre of Finland (FI)
- University of California, Los Angeles (US)
- Finnish Institute for Health and Welfare (FI)
- University of Helsinki (FI)
- Helsinki University Hospital (FI)
- Corresponding author
- Orešič, Matej
- ORCID
- Venue
- Genome Medicine
- Published
- 2012-01-18
- Volume
- 4
- Issue
- 1
- Pages
- 1-1
- ISSN
- 1756-994X (ISSN-L)
- PMC
- PMC3334549
- OpenAlex
- W1272423043
- Cited by
- 5
- References
- 45
- Citations by year
- 2024: 1 · 2020: 3 · 2018: 1
- FWCI
- 0.00
- Type
- journal article
- Language
- en
- Open access
- gold
- doi.org
- Locations
- Genome Medicine (publishedVersion, cc-by)
- Europe PMC (PubMed Central) (publishedVersion, cc-by)
- PubMed Central (publishedVersion, cc-by)
- PubMed (publishedVersion)
- eScholarship (California Digital Library) (submittedVersion)
- Työväentutkimus Vuosikirja (submittedVersion)
- STM:n Hallinnonalan avoin julkaisuarkisto (Julkari) (submittedVersion)
- Funders
- European Commission (222720)
- Academy of Finland
- FP7 Food, Agriculture and Fisheries, Biotechnology
- Topics
- Health Sciences › Medicine › Psychiatry and Mental health › Schizophrenia research and treatment
- Life Sciences › Biochemistry, Genetics and Molecular Biology › Molecular Biology › Metabolomics and Mass Spectrometry Studies
- Health Sciences › Nursing › Nutrition and Dietetics › Fatty Acid Research and Health
- Keywords
- schizophrenia, insulin resistance, phospholipids, lysophosphatidylcholine, serum lipidomics, twin discordance, triglycerides, cognitive speed, phospholipase A2, polyunsaturated fatty acids, blood-brain barrier, gray matter density, neurocognitive function
About these checks
Registry, retraction, Cites and statistics results are computed, not judged, with one exception: a printed reference that no index lists is read once by a model before it counts as a citation error. Claims are extracted by a model and kept only when their quote appears verbatim in the text; each cited source is then checked, with a model’s help, for whether it says what the claim relies on. Those verdicts can be wrong — read the claim’s quote and the cited source before relying on one.
Statistics and arithmetic are recomputed, not judged.
Confidence bands are shown only for fields calibrated on our annotated test set. None is calibrated yet, so no band is shown.
What counts as a claim ›How we measure confidence ›How we check this ›
Are you an author, or do you see a problem with this page? Request a review
