

The DOI matches its Crossref record; 104 of the 104 references it cites were found in a registry or an index.
Phylogenomics provides a robust topology of the major cnidarian lineages and insights on the origins of key organismal traits
Open accessAbstract
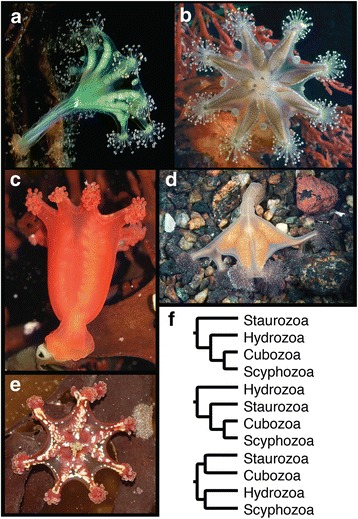
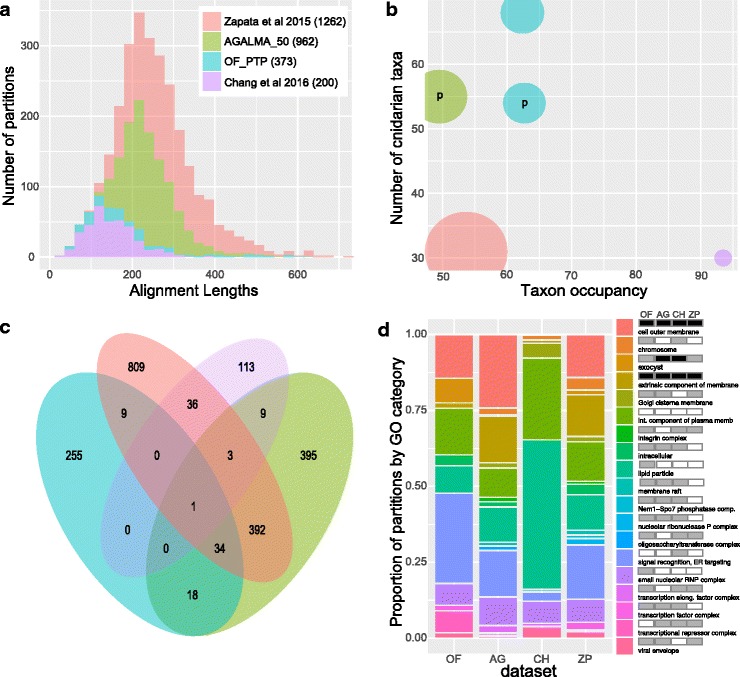
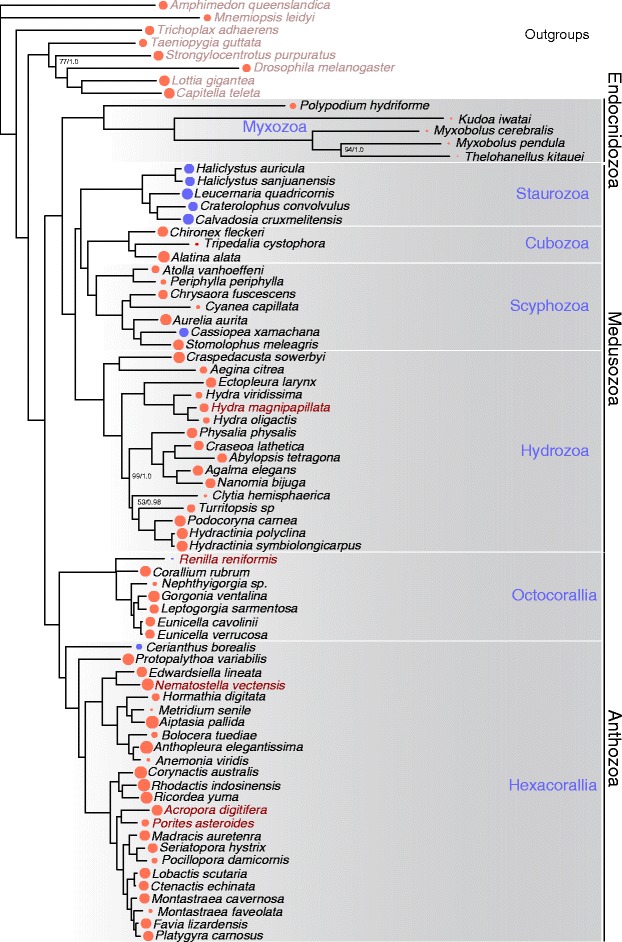
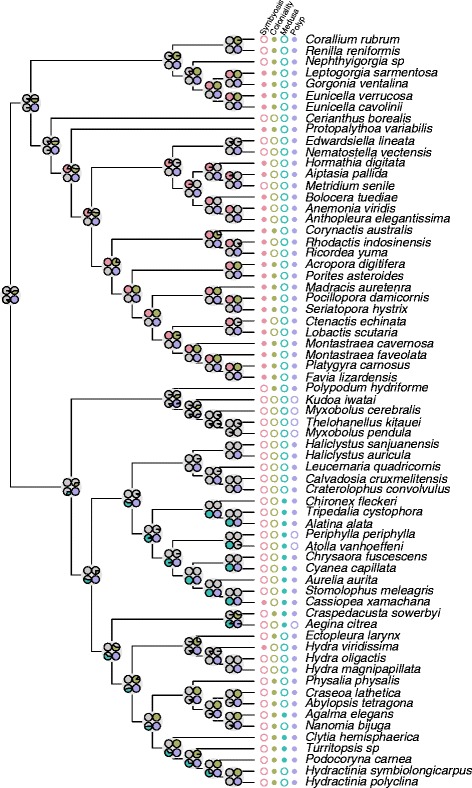
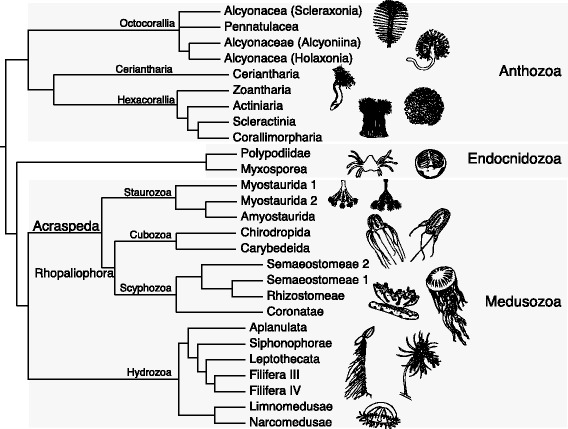
The phylogeny of Cnidaria has been a source of debate for decades, during which nearly all-possible relationships among the major lineages have been proposed. The ecological success of Cnidaria is predicated on several fascinating organismal innovations including stinging cells, symbiosis, colonial body plans and elaborate life histories. However, understanding the origins and subsequent diversification of these traits remains difficult due to persistent uncertainty surrounding the evolutionary relationships within Cnidaria. While recent phylogenomic studies have advanced our knowledge of the cnidarian tree of life, no analysis to date has included genome-scale data for each major cnidarian lineage. Here we describe a well-supported hypothesis for cnidarian phylogeny based on phylogenomic analyses of new and existing genome-scale data that includes representatives of all cnidarian classes. Our results are robust to alternative modes of phylogenetic estimation and phylogenomic dataset construction. We show that two popular phylogenomic matrix construction pipelines yield profoundly different datasets, both in the identities and in the functional classes of the loci they include, but resolve the same topology. We then leverage our phylogenetic resolution of Cnidaria to understand the character histories of several critical organismal traits. Ancestral state reconstruction analyses based on our phylogeny establish several notable organismal transitions in the evolutionary history of Cnidaria and depict the ancestral cnidarian as a solitary, non-symbiotic polyp that lacked a medusa stage. In addition, Bayes factor tests strongly suggest that symbiosis has evolved multiple times independently across the cnidarian radiation. Cnidaria have experienced more than 600 million years of independent evolution and in the process generated an array of organismal innovations. Our results add significant clarification on the cnidarian tree of life and the histories of some of these innovations. Further, we confirm the existence of Acraspeda (staurozoans plus scyphozoans and cubozoans), thus reviving an evolutionary hypothesis put forward more than a century ago.
Overview
The claims and statistics of this paper haven’t been checked yet.
Run the check — free, no account needed. It reads the open-access text and checks the sources it cites.
Integrity signals
Registry
Cites
Statistics
Figures
Verification
Claims the paper makes
The claims and statistics of this paper haven’t been checked yet.
Run the check — free, no account needed. It reads the open-access text and checks the sources it cites.
Claims other papers make about this one
Each is checked against this paper’s own text: does it say what the citing paper says it does?
The cited source says what the claim attributes to it.
In the citing paper
“A polypoid body plan has been inferred for the cnidarian ancestor [64”
From Cambrian Sessile, Suspension Feeding Stem-Group Ctenophores and Evolution of the Comb Jelly Body Plan (2019) · cites this paper as [64]
Self-check
Percentages, sums and reported differences re-computed from the paper’s own numbers.
The self-check needs the paper’s full text.
Citations
Cites
Basic local alignment search tool
Altschul, S. F., Gish, W., Miller, W., Myers, E. W., & Lipman, D. J. (1990) · Journal of Molecular Biology · doi:10.1006/jmbi.1990.9999 · Cited by 98,669
Trimmomatic: a flexible trimmer for Illumina sequence data
Bolger, A. M., Lohse, M., & Usadel, B. (2014) · Bioinformatics · doi:10.1093/bioinformatics/btu170 · Cited by 65,548
RAxML version 8: a tool for phylogenetic analysis and post-analysis of large phylogenies
Stamatakis, A. (2014) · Bioinformatics · doi:10.1093/bioinformatics/btu033 · Cited by 32,291
InterProScan 5: genome-scale protein function classification
JONES, P. M., Binns, D., Chang, H.-Y., Fraser, M., Li, W., McAnulla, C., McWilliam, H., Maslen, J., Mitchell, A., Nuka, G., et al. (2014) · Bioinformatics · doi:10.1093/bioinformatics/btu031 · Cited by 9,511
phytools: an R package for phylogenetic comparative biology (and other things)
Revell, L. J. (2011) · Methods in Ecology and Evolution · doi:10.1111/j.2041-210x.2011.00169.x · Cited by 9,439
Haas, B. J., Papanicolaou, A., Yassour, M., Grabherr, M., Blood, P. D., Bowden, J., Couger, M. B., Eccles, D., Li, B., Lieber, M., et al. (2013) · Nature Protocols · doi:10.1038/nprot.2013.084 · Cited by 8,464
REVIGO summarizes and visualizes long lists of gene ontology terms
Supek, F., Bošnjak, M., Škunca, N., & Šmuc, T. (2011) · PLoS ONE · doi:10.1371/journal.pone.0021800 · Cited by 6,264
OrthoMCL: Identification of Ortholog Groups for Eukaryotic Genomes
Li, L., Stoeckert, C. J., & Roos, D. S. (2003) · Genome Research · doi:10.1101/gr.1224503 · Cited by 5,707
Lanfear, R., Frandsen, P. B., Wright, A. M., Senfeld, T., & Calcott, B. (2016) · Molecular Biology and Evolution · doi:10.1093/molbev/msw260 · Cited by 5,319
Emms, D. M., & Kelly, S. (2015) · Genome Biology · doi:10.1186/s13059-015-0721-2 · Cited by 3,408
Research works printed but not linked: 19
- Wietrzykowski W. Recherches sur le de’veloppement des lucernaires. Arch Zool Exp Gen. 1912;5e Serie:1–95.
- Collins AG. Phylogeny, evolution, and systematics of the stalked jellyfishes (Cnidaria, Staurozoa). Integr Comp Biol. 2010;50:E32.
- Kiderlen H. Die Conularien. Über Bau and Leben der ersten Scyphozoa. Neues Jahrbuch für Mineralogie, Beilige-Band; 1937. p. 113–69.
- Collins AG, Schuchert P, Marques AC, Jankowski T, Medina M, Schierwater B. Medusozoan phylogeny and character evolution clarified by new large and small subunit rDNA data and an assessment of the utility of phylogenetic mixture models. Syst Biol. 2006a;55:97–115. https://doi.org/10.1080/10635150500433615 . · DOI
- Daly M, Fautin DG, Cappola VA. Systematics of the Hexacorallia (Cnidaria: Anthozoa). Zool J Linnean Soc. 2003b;139:419–37. https://doi.org/10.1046/J.1096-3642.2003.00084.X . · DOI
- Borowiec ML, Lee EK, Chiu JC, Plachetzki DC. Extracting phylogenetic signal and accounting for bias in whole-genome data sets supports the Ctenophora as sister to remaining Metazoa. BMC Genomics. 2015;16:987. https://doi.org/10.1186/s12864-015-2146-4 . · DOI · Paper page
- Schmidt H. On evolution in the Anthozoa. Proceedings of the 2nd International Coral Reef Symposium. 1974;1:533–560.
- Minin VN SM, Imholte GC. 2014. Indorigin: testing how many times a trait of interest was regained during evolution (R package).
- Thiel H. The evolution of Scyphozoa: a review. London: Academic Press; 1966.
- Haas, B. J., and A. Papanicolaou 2016. TransDecoder (find coding regions within transcripts).
- Vanhoeffen E. Untersuchungen ueber Anatomie und Entwicklung von Arachanctis albida, M. Sars. Bibliotheca Zoologica. 1895;20:1–14.
- Haeckel E. Das System der Medusen. I, 2: System der Acraspeden. Jenna: Gustav Fischer; 1880. p. 672.
- Goy J. Campagne de la Calypso au large des côtes atlantiques de l’Amérique du Sud Sud (1961–1962) - 35. In: Méduses. Resultats scientifiques des campagnes de la Calypso; 1979. p. 263–96.
- Cuvier G. Le Règne animal distribué d’après son organisation, pour servir de base à l’histoire naturelle des animaux et d’introduction à l’anatomie comparée. In: Tome IV Paris:: chez De’terville Libraire; 1817.
- Sars M. Fauna littoralis Norvegiae oder Beschreibung und Abbildungen neuer oder wenig bekannter Seethiere, nebst Beobachtungen u¨ber die Organisation, Lebensweise u. Entwickelung derselben. In: Christiania: Druck und Verlag von Johann Dahk; 1846.
- Hornell J. The Lucernarians as degenerate Scyphomedusae. A note upon the phylogeny of the Order. Nat Sci. 1893;3:204–8.
- Hurst CH. Biological theories. VI. The phylogeny of Lucernarians. In: Nat. Sci. London, New York; 1893. p. 208–17.
- Gegenbaur C. Versuch eines Systemes der Medusen, mit Beschreibung neuer oder wenig gekannter Formen; zugleich ein Beitrag zur Kenntnis der Fauna des Mittelmeeres. Z wiss Zool Leipzig. 1886;8:202–73.
- Ryan JF. alien_index: alien_index first release: zenodo. Salvini-Plawen lv 1978. On the origin and evolution of the lower Metazoa. J Zool Syst Evol Res. 2015;16:40–87.
Cited by
Sorted by citations
Items 201–259 of 259
Gene Family Complexity and Expression Divergence as a Mechanism of Adaptation In CoralPreprint
Dimos, B., Emery, M. A., MacKnight, N. J., Brandt, M. E., Demuth, J. P., & Mydlarz, L. D. (2021) · bioRxiv (Cold Spring Harbor Laboratory) · doi:10.1101/2021.04.28.441826
Population genomics of Pocillopora corals: insights from RAD-sequencingPreprint
Aurelle, D., Pratlong, M., Oury, N., Haguenauer, A., Gélin, P., Magalon, H., Adjeroud, M., Romans, P., Vidal‐Dupiol, J., Claereboudt, M. R., et al. (2021) · bioRxiv (Cold Spring Harbor Laboratory) · doi:10.1101/2021.05.04.442552
Investigating the Evolutionary Dynamics of Traits in Metazoa
Spillane, J. (2021) · University of New Hampshire Scholars Repository (University of New Hampshire at Manchester)
Godoy, I. V. F. D., Alberts, C. C., NESPOLO, C. H., de Oliveira, J., & Stampar, S. N. (2021) · Anais da Academia Brasileira de Ciências · doi:10.1590/0001-3765202120191468
Evolução do veneno em cnidários
Becerra, A. J. J. (2021) · doi:10.11606/t.41.2021.tde-30092021-102641
Characterising the functional venom profiles of sea anemones
Ashwood, L. M. (2022) · Queensland University of Technology · doi:10.5204/thesis.eprints.227457
Erofeeva, T. V., Grigorenko, A. P., Gusev, F. E., Kosevich, I. A., & Rogaev, E. I. (2022) · Biochemistry (Moscow) · doi:10.31857/s0320972522020075
Erofeeva, T. V., Grigorenko, A. P., Gusev, F. E., Kosevich, I. A., & Rogaev, E. I. (2022) · Biochemistry (Moscow) · doi:10.1134/s0006297922030075
Evolução de Cnidaria no tempo e espaço
Guerrero, A. M. M. (2021) · Digital Library of Theses and Dissertations (Universidade de São Paulo) · doi:10.11606/t.41.2021.tde-17032022-095859
Evolução genômica dos Medusozoa (Cnidaria), com ênfase em elementos repetitivos nos Scyphozoa
Santander, M. D. (2022) · Digital Library of Theses and Dissertations (Universidade de São Paulo) · doi:10.11606/d.41.2022.tde-11112022-151353
Hasegawa, N., Matsubara, S., Shiraishi, A., Satake, H., Shenkar, N., & Kajihara, H. (2023) · bioRxiv (Cold Spring Harbor Laboratory) · doi:10.1101/2023.12.27.573391
Análise comparada das estruturas gonadais de Cubozoa no contexto da evolução de Medusozoa (Cnidaria)
Rodríguez, J. G. (2024) · Digital Library of Theses and Dissertations (Universidade de São Paulo) · doi:10.11606/t.41.2024.tde-13052024-104419
Gao, Y., & Kong, L. (2024) · Research Square · doi:10.21203/rs.3.rs-4961541/v1
Ganguly, U., & France, S. C. (2025) · Research Square · doi:10.21203/rs.3.rs-6866112/v1
Huang, Y., Tian, J., Shuo, Z., Zheng, P., Chen, J., Zhou, K., & Wang, W. (2025) · Mitochondrial DNA Part B · doi:10.1080/23802359.2025.2554415
Additional file 8 of Evolution of myxozoan mitochondrial genomes: insights from myxobolids
Sandberg, T. O. M., Yahalomi, D., Bracha, N., Haddas‐Sasson, M., Pupko, T., Atkinson, S. D., Bartholomew, J. L., Zhang, J. Y., & Huchon, D. (2024) · Figshare · doi:10.6084/m9.figshare.26709710
McCulloch, K. J., Babonis, L. S., Liu, A., Daly, C. M. S., Martindale, M. Q., & Koenig, K. M. (2024) · Figshare · doi:10.6084/m9.figshare.26618719
McCulloch, K. J., Babonis, L. S., Liu, A., Daly, C. M. S., Martindale, M. Q., & Koenig, K. M. (2024) · Figshare · doi:10.6084/m9.figshare.26618716
Koch, T. L., & Grimmelikhuijzen, C. J. P. (2020) · Figshare · doi:10.6084/m9.figshare.13023707
Koch, T. L., & Grimmelikhuijzen, C. J. P. (2020) · Figshare · doi:10.6084/m9.figshare.13023698
Koch, T. L., & Grimmelikhuijzen, C. J. P. (2020) · Figshare · doi:10.6084/m9.figshare.13023713
Additional file 4 of Evolution of myxozoan mitochondrial genomes: insights from myxobolids
Sandberg, T. O. M., Yahalomi, D., Bracha, N., Haddas‐Sasson, M., Pupko, T., Atkinson, S. D., Bartholomew, J. L., Zhang, J. Y., & Huchon, D. (2024) · Figshare · doi:10.6084/m9.figshare.26709698
Koch, T. L., & Grimmelikhuijzen, C. J. P. (2020) · Figshare · doi:10.6084/m9.figshare.13023719
Additional file 7 of Evolution of myxozoan mitochondrial genomes: insights from myxobolids
Sandberg, T. O. M., Yahalomi, D., Bracha, N., Haddas‐Sasson, M., Pupko, T., Atkinson, S. D., Bartholomew, J. L., Zhang, J. Y., & Huchon, D. (2024) · Figshare · doi:10.6084/m9.figshare.26709707
Koch, T. L., & Grimmelikhuijzen, C. J. P. (2020) · Figshare · doi:10.6084/m9.figshare.13023710
Koch, T. L., & Grimmelikhuijzen, C. J. P. (2020) · Figshare · doi:10.6084/m9.figshare.13023716
Koch, T. L., & Grimmelikhuijzen, C. J. P. (2020) · Figshare · doi:10.6084/m9.figshare.13023695
Koch, T. L., & Grimmelikhuijzen, C. J. P. (2020) · Figshare · doi:10.6084/m9.figshare.13023704
Additional file 6 of Evolution of myxozoan mitochondrial genomes: insights from myxobolids
Sandberg, T. O. M., Yahalomi, D., Bracha, N., Haddas‐Sasson, M., Pupko, T., Atkinson, S. D., Bartholomew, J. L., Zhang, J. Y., & Huchon, D. (2024) · Figshare · doi:10.6084/m9.figshare.26709704
Koch, T. L., & Grimmelikhuijzen, C. J. P. (2020) · Figshare · doi:10.6084/m9.figshare.13023692
Additional file 1 of Evolution of myxozoan mitochondrial genomes: insights from myxobolids
Sandberg, T. O. M., Yahalomi, D., Bracha, N., Haddas‐Sasson, M., Pupko, T., Atkinson, S. D., Bartholomew, J. L., Zhang, J. Y., & Huchon, D. (2024) · Figshare · doi:10.6084/m9.figshare.25670120
Additional file 3 of Evolution of myxozoan mitochondrial genomes: insights from myxobolids
Sandberg, T. O. M., Yahalomi, D., Bracha, N., Haddas‐Sasson, M., Pupko, T., Atkinson, S. D., Bartholomew, J. L., Zhang, J. Y., & Huchon, D. (2024) · Figshare · doi:10.6084/m9.figshare.26709695
Koch, T. L., & Grimmelikhuijzen, C. J. P. (2020) · Figshare · doi:10.6084/m9.figshare.13023701
McCulloch, K. J., Babonis, L. S., Liu, A., Daly, C. M. S., Martindale, M. Q., & Koenig, K. M. (2024) · Figshare · doi:10.6084/m9.figshare.26618713
McCulloch, K. J., Babonis, L. S., Liu, A., Daly, C. M. S., Martindale, M. Q., & Koenig, K. M. (2024) · Figshare · doi:10.6084/m9.figshare.26618722
Additional file 2 of Evolution of myxozoan mitochondrial genomes: insights from myxobolids
Sandberg, T. O. M., Yahalomi, D., Bracha, N., Haddas‐Sasson, M., Pupko, T., Atkinson, S. D., Bartholomew, J. L., Zhang, J. Y., & Huchon, D. (2024) · Figshare · doi:10.6084/m9.figshare.25670292
Koch, T. L., & Grimmelikhuijzen, C. J. P. (2020) · Figshare · doi:10.6084/m9.figshare.13023689
Additional file 5 of Evolution of myxozoan mitochondrial genomes: insights from myxobolids
Sandberg, T. O. M., Yahalomi, D., Bracha, N., Haddas‐Sasson, M., Pupko, T., Atkinson, S. D., Bartholomew, J. L., Zhang, J. Y., & Huchon, D. (2024) · Figshare · doi:10.6084/m9.figshare.26709701
Cilia-driven surface currents characterize specific cnidarian groups and lifecycle stages
Koch, T., Araslanova, K. R., Bouderlique, T., Fetisov, A., Link, O., Klimovich, A. V., Mičić, M., Mičić, K., Boström, J., Frade, P. R., et al. (2026) · Communications Biology · doi:10.1038/s42003-026-09827-0
Stephens, T. G., Kulczyk, A., & Bhattacharya, D. (2026) · Genome Biology and Evolution · doi:10.1093/gbe/evag072 · Cited by 1
Bases cellulaires et moléculaires de la régénération chez la méduse Clytia hemisphaerica
Péron, S. (2019) · theses.fr (ABES) · doi:10.70675/ffef6377z3968z4ab7zb677z254b4877f6a0 · Cited by 1
Comparison of cell types across life cycle stages of the hydrozoan Clytia hemisphaerica
Ferraioli, A. (2022) · theses.fr (ABES) · doi:10.70675/3d74eba7z8f43z44c7zb7bbz37a96dd78d08 · Cited by 1
Structure et développement des muscles striés de Pelagia noctiluca
Salmon, B. (2025) · theses.fr (ABES) · doi:10.70675/e88112cez654fz4c1bz942ezafdc9e54973b
Comparative gonadal histology reveals complex reproductive traits in Cubozoa (Cnidaria: Medusozoa)
García‐Rodríguez, J., Ames, C. L., Cunha, A. F., Jaimes‐Becerra, A., Fonfría, E. S., Bordehore, C., Collins, A. G., & Marques, A. C. (2026) · Frontiers in Ecology and Evolution · doi:10.3389/fevo.2026.1825604
Self-citationConserved HSP60 structure with lineage- and context-specific regulation in cnidarians
Chowdhury, S., Kruger, A., & Roger, L. M. (2026) · Life Science Alliance · doi:10.26508/lsa.202503592
A morphological phylogenetic approach to the evolution of symmetry in animals
McDermott, J., Dunn, F. S., Marlétaz, F., & Rahman, I. A. (2026) · Proceedings of the Royal Society B Biological Sciences · doi:10.1098/rspb.2026.1111
Cnidarian Venoms in the Omics Era: Toxin Discovery and Bioactive Potential
Barroso, R. A., & Antunes, A. (2026) · Marine Drugs · doi:10.3390/md24090306
Tánori-Lozano, A., Gamero-Mora, E., Gonzalez-Rios, H., Martínez‐Porchas, M., Garibay-Valdéz, E., & Muhlia‐Almazán, A. (2026) · Regional Studies in Marine Science · doi:10.1016/j.rsma.2026.105454
Phagocytes in the mesoglea of the scyphozoan Cassiopea sp.
Miner, C., Kahn, C., Cayelli, E., & Martindale, M. Q. (2026) · Developmental & Comparative Immunology · doi:10.1016/j.dci.2026.105722
Hexacorallian UCEs and where to find them: genomic mapping and assessment of ultraconserved elements
Mera, H., Baird, A. H., & Cowman, P. F. (2026) · Molecular Phylogenetics and Evolution · doi:10.1016/j.ympev.2026.108743
Durán-Fuentes, J. A., Andrade, G. M. A., Prado, L. M. A., Reitzel, A. M., & Stampar, S. N. (2026) · Gene Reports · doi:10.1016/j.genrep.2026.102663
Metadata
- Authors
- Kayal, E., Bentlage, B., Sabrina Pankey, M., Ohdera, A. H., Medina, M., Plachetzki, D. C., Collins, A. G., & Ryan, J. F.
- Affiliations
- Smithsonian Institution (US)
- Pennsylvania State University (US)
- University of New Hampshire (US)
- University of Florida (US)
- Corresponding author
- Plachetzki, David C.
- Ryan, Joseph F.
- ORCID
- Venue
- BMC Evolutionary Biology
- Published
- 2018-04-13
- Volume
- 18
- Issue
- 1
- Pages
- 68
- ISSN
- 1471-2148 (ISSN-L)
- PMC
- PMC5932825
- OpenAlex
- W2807223659
- Cited by
- 255
- References
- 104
- Citations by year
- 2026: 15 · 2025: 28 · 2024: 35 · 2023: 37 · 2022: 28 · 2021: 40 · 2020: 40 · 2019: 28 · 2018: 4
- FWCI
- 20.61
- Type
- journal article
- Language
- en
- Open access
- gold
- doi.org
- Locations
- BMC Evolutionary Biology (publishedVersion, cc-by)
- Europe PMC (PubMed Central) (publishedVersion, other-oa)
- PubMed Central (publishedVersion, cc-by)
- HAL (submittedVersion, cc-by)
- DOAJ (DOAJ: Directory of Open Access Journals) (submittedVersion, cc-by-sa)
- NOAA Institutional Repository (submittedVersion)
- Funders
- Smithsonian Institution
- Directorate for Biological Sciences (OIA-1457769)
- National Institute of Food and Agriculture (Hatch Project 00654)
- Topics
- Life Sciences › Agricultural and Biological Sciences › Animal Science and Zoology › Marine Invertebrate Physiology and Ecology
- Life Sciences › Biochemistry, Genetics and Molecular Biology › Molecular Biology › Genomics and Phylogenetic Studies
- Life Sciences › Agricultural and Biological Sciences › Ecology, Evolution, Behavior and Systematics › Protist diversity and phylogeny
- Keywords
- genome-scale data, ancestral state reconstruction, symbiosis evolution, nematocysts, Scyphozoa, cubozoans
About these checks
Registry, retraction, Cites and statistics results are computed, not judged, with one exception: a printed reference that no index lists is read once by a model before it counts as a citation error. Claims are extracted by a model and kept only when their quote appears verbatim in the text; each cited source is then checked, with a model’s help, for whether it says what the claim relies on. Those verdicts can be wrong — read the claim’s quote and the cited source before relying on one.
Statistics and arithmetic are recomputed, not judged.
Confidence bands are shown only for fields calibrated on our annotated test set. None is calibrated yet, so no band is shown.
What counts as a claim ›How we measure confidence ›How we check this ›
Are you an author, or do you see a problem with this page? Request a review
