

The DOI matches its Crossref record; 80 of the 80 references it cites were found in a registry or an index.
Genetic mapping of canine fear and aggression
Open accessAbstract
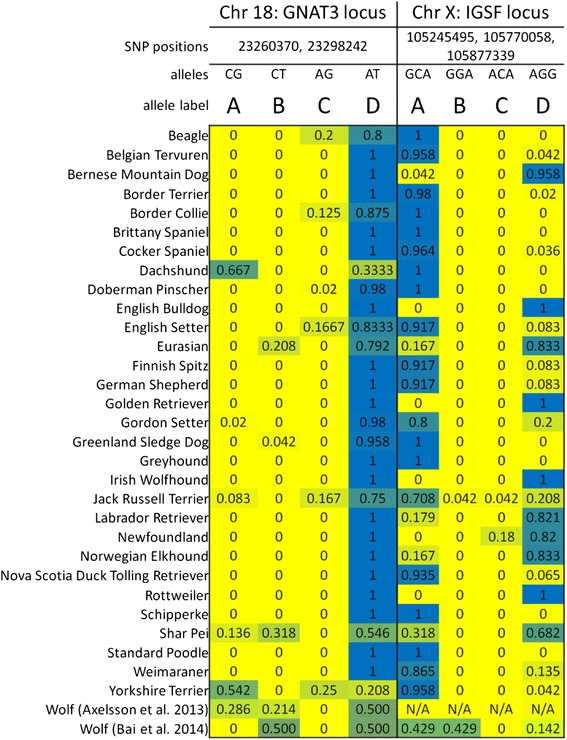
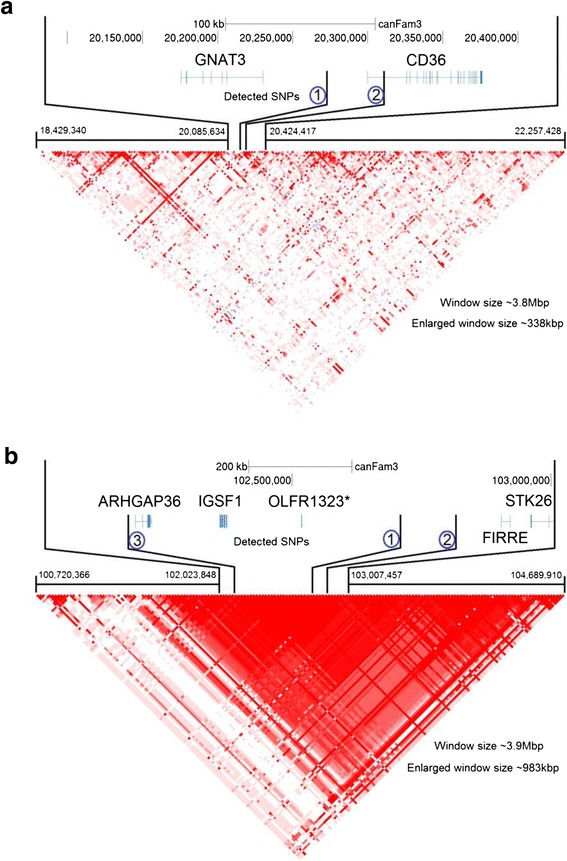
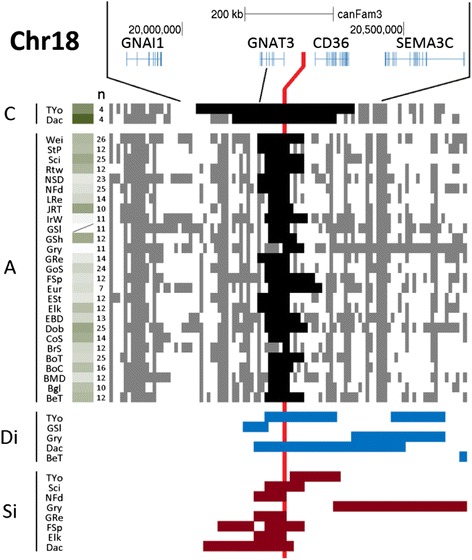
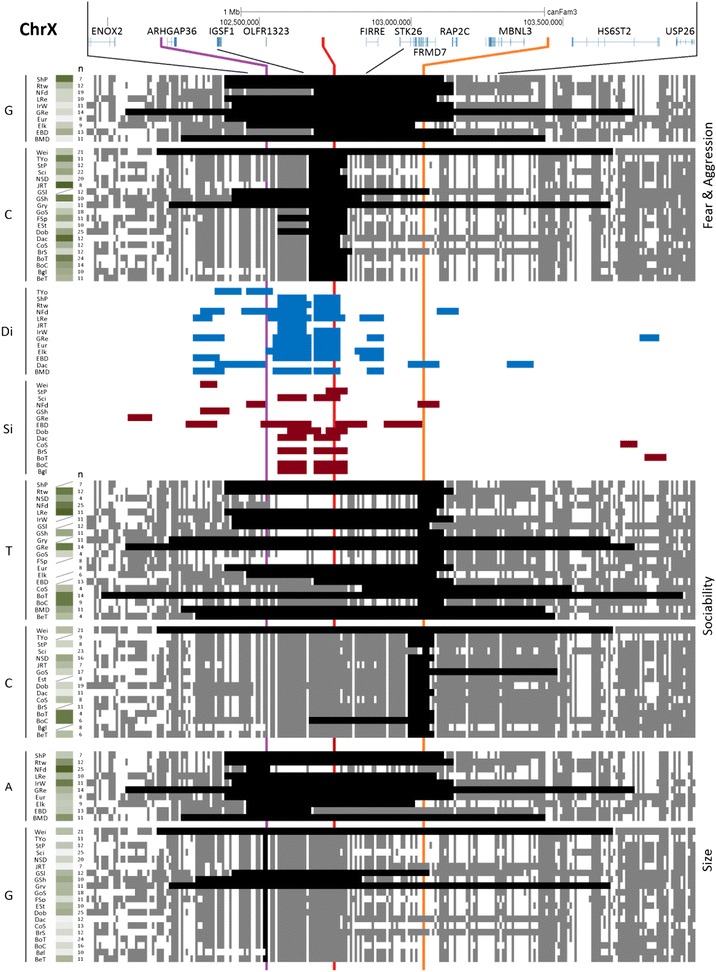
BACKGROUND: Fear/anxiety and anger/aggression greatly influence health, quality of life and social interactions. They are a huge burden to wellbeing, and personal and public economics. However, while much is known about the physiology and neuroanatomy of such emotions, little is known about their genetics - most importantly, why some individuals are more susceptible to pathology under stress. RESULTS: We conducted genomewide association (GWA) mapping of breed stereotypes for many fear and aggression traits across several hundred dogs from diverse breeds. We confirmed those findings using GWA in a second cohort of partially overlapping breeds. Lastly, we used the validated loci to create a model that effectively predicted fear and aggression stereotypes in a third group of dog breeds that were not involved in the mapping studies. We found that i) known IGF1 and HMGA2 loci variants for small body size are associated with separation anxiety, touch-sensitivity, owner directed aggression and dog rivalry; and ii) two loci, between GNAT3 and CD36 on chr18, and near IGSF1 on chrX, are associated with several traits, including touch-sensitivity, non-social fear, and fear and aggression that are directed toward unfamiliar dogs and humans. All four genome loci are among the most highly evolutionarily-selected in dogs, and each of those was previously shown to be associated with morphological traits. We propose that the IGF1 and HMGA2 loci are candidates for identical variation being associated with both behavior and morphology. In contrast, we show that the GNAT3-CD36 locus has distinct variants for behavior and morphology. The chrX region is a special case due to its extensive linkage disequilibrium (LD). Our evidence strongly suggests that sociability (which we propose is associated with HS6ST2) and fear/aggression are two distinct GWA loci within this LD block on chrX, but there is almost perfect LD between the peaks for fear/aggression and animal size. CONCLUSIONS: We have mapped many canine fear and aggression traits to single haplotypes at the GNAT3-CD36 and IGSF1 loci. CD36 is widely expressed, but areas of the amygdala and hypothalamus are among the brain regions with highest enrichment; and CD36-knockout mice are known to have significantly increased anxiety and aggression. Both of the other genes have very high tissue-specificity and are very abundantly expressed in brain regions that comprise the core anatomy of fear and aggression - the amygdala to hypothalamic-pituitary-adrenal (HPA) axis. We propose that reduced-fear variants at these loci may have been involved in the domestication process.
Overview
The claims and statistics of this paper haven’t been checked yet.
Run the check — free, no account needed. It reads the open-access text and checks the sources it cites.
Integrity signals
Registry
Cites
Statistics
Figures
Verification
Claims the paper makes
The claims and statistics of this paper haven’t been checked yet.
Run the check — free, no account needed. It reads the open-access text and checks the sources it cites.
Claims other papers make about this one
Each is checked against this paper’s own text: does it say what the citing paper says it does?
The source backs part of the claim, not all of it — or backs it for a different population, condition or comparison.
In the citing paper
“Aggression and fear are associated with the same genetic loci linked to small body size, as suggested by the correlation found in Zapata et al.’s studies [162,163].”
From Ethical Concerns about Fashionable Dog Breeding (2024) · cites this paper as [162]
Experimental — accuracy not yet measuredIn the citing paper
“We noted that non-genetic models, such as stress-induced aggression [27, 81] and other organisms [30, 31, 82], were not included in this study.”
From An integrated analysis of genes and functional pathways for aggression in human and rodent models (2019) · cites this paper as [82]
Self-check
Percentages, sums and reported differences re-computed from the paper’s own numbers.
The self-check needs the paper’s full text.
Citations
Cites
PLINK: a tool set for whole-genome association and population-based linkage analyses.
Purcell, S., Neale, B., Todd-Brown, K., Thomas, L., Ferreira, M. A. R., Bender, D., Maller, J., Sklar, P., de Bakker, P. I. W., Daly, M. J., et al. (2007) · The American Journal of Human Genetics · doi:10.1086/519795 · Cited by 34,089
Tissue-based map of the human proteome
Uhlén, M., Fagerberg, L., Hallström, B. M., Lindskog, C., Oksvold, P., Mardinoglu, A., Sivertsson, Å., Kampf, C., Sjöstedt, E., Asplund, A., et al. (2015) · Science · doi:10.1126/science.1260419 · Cited by 15,286
Haploview: analysis and visualization of LD and haplotype maps
Barrett, J. C., Fry, B., Maller, J., & Daly, M. J. (2004) · Bioinformatics · doi:10.1093/bioinformatics/bth457 · Cited by 14,551
The Human Genome Browser at UCSC
Kent, W. J., Sugnet, C. W., Furey, T. S., Roskin, K. M., Pringle, T. H., Zahler, A. M., & Haussler, A. D. (2002) · Genome Research · doi:10.1101/gr.229102 · Cited by 10,400
Genome-wide atlas of gene expression in the adult mouse brain
Lein, E. S., Hawrylycz, M. J., Ao, N., Ayres, M., Bensinger, A., Bernard, A., Boe, A. F., Boguski, M. S., Brockway, K. S., Byrnes, E. J., et al. (2007) · Nature · doi:10.1038/nature05453 · Cited by 5,572
Genome-wide efficient mixed-model analysis for association studies
Zhou, X., & Stephens, M. (2012) · Nature Genetics · doi:10.1038/ng.2310 · Cited by 3,627
The hitch-hiking effect of a favourable gene
Smith, J. M., & Haigh, J. (1974) · Genetical Research · doi:10.1017/s0016672300014634 · Cited by 3,415
The hitch-hiking effect of a favourable gene
Smith, J. M., & Haigh, J. (2007) · Genetics Research · doi:10.1017/s0016672308009579 · Cited by 2,675
Genome-wide detection and characterization of positive selection in human populations
The International HapMap Consortium, Sabeti, P. C., Varilly, P., Fry, B., Lohmueller, J., Hostetter, E., Cotsapas, C., Xie, X., Byrne, E. H., McCarroll, S. A., et al. (2007) · Nature · doi:10.1038/nature06250 · Cited by 2,131
A variant associated with nicotine dependence, lung cancer and peripheral arterial disease
Thorgeirsson, T. E., Geller, F., Sulem, P., Rafnar, T., Wiste, A., Magnusson, K. P., Manolescu, A., Thorleifsson, G., Stefansson, H., Ingason, A., et al. (2008) · Nature · doi:10.1038/nature06846 · Cited by 1,523
Cited by
Sorted by citations
Jagannathan, V., Drögemüller, C., & Leeb, T. (2019) · Animal Genetics · doi:10.1111/age.12834 · Cited by 195
Demographic history, selection and functional diversity of the canine genome
Ostrander, E. A., Wayne, R. K., Freedman, A. H., & Davis, B. W. (2017) · Nature Reviews Genetics · doi:10.1038/nrg.2017.67 · Cited by 186
Prevalence, comorbidity, and breed differences in canine anxiety in 13,700 Finnish pet dogs
Salonen, M., Sulkama, S., Mikkola, S., Puurunen, J., Hakanen, E., Tiira, K., Araujo, C., & Lohi, H. (2020) · Scientific Reports · doi:10.1038/s41598-020-59837-z · Cited by 182
Highly heritable and functionally relevant breed differences in dog behaviour
MacLean, E. L., Snyder-Mackler, N., vonHoldt, B. M., & Serpell, J. A. (2019) · Proceedings of the Royal Society B: Biological Sciences · doi:10.1098/rspb.2019.0716 · Cited by 144
Self-citationMeđugorac, I., Graf, A., Grohs, C., Rothammer, S., Zagdsuren, Y., Александровна, Г. Е., Zinovieva, N. A., Barbieri, J., Seichter, D., Ruß, I., et al. (2017) · Nature Genetics · doi:10.1038/ng.3775 · Cited by 135
Genetic Characterization of Dog Personality Traits
Ilska, J. J., Haskell, M. J., Blott, S. C., Sánchez-Molano, E., Polgár, Z., Lofgren, S. E., Clements, D. N., & Wiener, P. (2017) · Genetics · doi:10.1534/genetics.116.192674 · Cited by 100
An integrated analysis of genes and functional pathways for aggression in human and rodent models
Zhang-James, Y., Fernàndez-Castillo, N., Hess, J. L., Malki, K., Glatt, S. J., Cormand, B., & Faraone, S. V. (2019) · Molecular Psychiatry · doi:10.1038/s41380-018-0068-7 · Cited by 98
Puurunen, J., Hakanen, E., Salonen, M. K., Mikkola, S., Sulkama, S., Araujo, C., & Lohi, H. (2020) · Scientific Reports · doi:10.1038/s41598-020-60546-w · Cited by 96
Domestic dog lineages reveal genetic drivers of behavioral diversification
Dutrow, E. V., Serpell, J. A., & Ostrander, E. A. (2022) · Cell · doi:10.1016/j.cell.2022.11.003 · Cited by 100
Self-citationMcPeake, K. J., Collins, L., Zulch, H., & Mills, D. S. (2019) · Frontiers in Veterinary Science · doi:10.3389/fvets.2019.00152 · Cited by 80
Impulsivity and behaviour problems in dogs: A Reinforcement Sensitivity Theory perspective
Piotti, P., Satchell, L. P., & Lockhart, T. (2018) · Behavioural Processes · doi:10.1016/j.beproc.2018.03.012 · Cited by 66
RBFOX1, encoding a splicing regulator, is a candidate gene for aggressive behavior
Fernàndez‐Castillo, N., Gan, G., van Donkelaar, M. M. J., Vaht, M., Weber, H., Retz, W., Meyer‐Lindenberg, A., Franke, B., Harro, J., Reif, A., et al. (2017) · European Neuropsychopharmacology · doi:10.1016/j.euroneuro.2017.11.012 · Cited by 65
Fearful Fido: Investigating dog experience in the veterinary context in an effort to reduce distress
Edwards, P. T., Smith, B. P., McArthur, M. L., & Hazel, S. J. (2019) · Applied Animal Behaviour Science · doi:10.1016/j.applanim.2019.02.009 · Cited by 77
Behavioural correlations of the domestication syndrome are decoupled in modern dog breeds
Wheat, C. H., Fitzpatrick, J. L., Rogell, B., & Temrin, H. (2019) · Nature Communications · doi:10.1038/s41467-019-10426-3 · Cited by 61
Wallis, L., Szabó, D., & Kubinyi, E. (2020) · Frontiers in Veterinary Science · doi:10.3389/fvets.2019.00493 · Cited by 69
Two novel genomic regions associated with fearfulness in dogs overlap human neuropsychiatric loci
Sarviaho, R., Hakosalo, O., Tiira, K., Sulkama, S., Salmela, E., Hytönen, M. K., Sillanpää, M. J., & Lohi, H. (2019) · Translational Psychiatry · doi:10.1038/s41398-018-0361-x · Cited by 54
Shan, S., Xu, F., & Brenig, B. (2021) · Frontiers in Veterinary Science · doi:10.3389/fvets.2021.693290 · Cited by 49
Genetics and Brain Transcriptomics of Completed Suicide
Punzi, G., Ursini, G., Chen, Q., Radulescu, E., Tao, R., Huuki-Myers, L. A., Carlo, P. D., Collado‐Torres, L., Shin, J. H., Catanesi, R., et al. (2022) · American Journal of Psychiatry · doi:10.1176/appi.ajp.2021.21030299 · Cited by 46
Active and social life is associated with lower non-social fearfulness in pet dogs
Hakanen, E., Mikkola, S., Salonen, M., Puurunen, J., Sulkama, S., Araujo, C., & Lohi, H. (2020) · Scientific Reports · doi:10.1038/s41598-020-70722-7 · Cited by 44
Hecht, E. E., Zapata, I., Alvarez, C. E., Gutman, D. A., Preuss, T. M., Kent, M., & Serpell, J. A. (2021) · Brain Structure and Function · doi:10.1007/s00429-021-02368-8 · Cited by 46
Self-citationGenetic testing of dogs predicts problem behaviors in clinical and nonclinical samples
Zapata, I., Lilly, M. L., Herron, M. E., Serpell, J. A., & Alvarez, C. E. (2022) · BMC Genomics · doi:10.1186/s12864-022-08351-9 · Cited by 40
Self-citationBreed Differences in Dog Cognition Associated with Brain-Expressed Genes and Neurological Functions
Gnanadesikan, G. E., Hare, B. A., Snyder‐Mackler, N., Call, J., Kaminski, J., Miklósi, Á., & MacLean, E. L. (2020) · Integrative and Comparative Biology · doi:10.1093/icb/icaa112 · Cited by 42
Behavior Differences Between Search-and-Rescue and Pet Dogs
Hare, E., Kelsey, K. M., Serpell, J. A., & Otto, C. M. (2018) · Frontiers in Veterinary Science · doi:10.3389/fvets.2018.00118 · Cited by 33
Self-citationElephants as an animal model for self-domestication
Raviv, L., Jacobson, S. L., Plotnik, J. M., Bowman, J. D., Lynch, V. J., & Benítez‐Burraco, A. (2023) · Proceedings of the National Academy of Sciences · doi:10.1073/pnas.2208607120 · Cited by 35
Genetic dissection of complex behaviour traits in German Shepherd dogs
Friedrich, J., Strandberg, E., Arvelius, P., Sánchez-Molano, E., Pong‐Wong, R., Hickey, J. M., Haskell, M. J., & Wiener, P. (2019) · Heredity · doi:10.1038/s41437-019-0275-2 · Cited by 33
Dobos, P., & Pongrácz, P. (2023) · Animals · doi:10.3390/ani13122001 · Cited by 30
The behavioral genetics of nonhuman primates: Status and prospects
Rogers, J. (2018) · American Journal of Physical Anthropology · doi:10.1002/ajpa.23384 · Cited by 28
Zapata, I., Moraes, L. E., Fiala, E. M., Zaldívar‐López, S., Couto, C. G., Rowell, J., & Alvarez, C. E. (2019) · BMC Genomics · doi:10.1186/s12864-019-5531-6 · Cited by 27
Self-citationDNA methylation in canine brains is related to domestication and dog-breed formation
Sundman, A.-S., Pértille, F., Coutinho, L. L., JAZIN, E. E., Guerrero‐Bosagna, C., & Jensen, P. (2020) · PLoS ONE · doi:10.1371/journal.pone.0240787 · Cited by 29
Чадаева, И. В., Ponomarenko, M. P., Рассказов, Д. А., Sharypova, E. B., Kashina, E. V., Matveeva, M. Y., Arshinova, T. V., Пономаренко, П. М., Arkova, O. V., Bondar, N. P., et al. (2016) · BMC Genomics · doi:10.1186/s12864-016-3353-3 · Cited by 25
Lee, M. O., Li, J., Davis, B. W., Upadhyay, S., Muhisen, H. M. A., Suva, L. J., Clement, T. M., & Andersson, L. (2021) · G3 Genes Genomes Genetics · doi:10.1093/g3journal/jkab417 · Cited by 23
Friedrich, J., Talenti, A., Arvelius, P., Strandberg, E., Haskell, M. J., & Wiener, P. (2020) · Advanced Genetics · doi:10.1002/ggn2.10024 · Cited by 21
Latent class analysis of behavior across dog breeds reveal underlying temperament profiles
Zapata, I., Eyre, A. W., Alvarez, C. E., & Serpell, J. A. (2022) · Scientific Reports · doi:10.1038/s41598-022-20053-6 · Cited by 25
Self-citationRisk factors of separation-related behaviours in Australian retrievers
van Rooy, D., Thomson, P. C., McGreevy, P. D., & Wade, C. M. (2018) · Applied Animal Behaviour Science · doi:10.1016/j.applanim.2018.09.001 · Cited by 21
Expression of Behavioural Traits in Goldendoodles and Labradoodles
Shouldice, V. L., Edwards, A. M., Serpell, J. A., Niel, L., & Robinson, J. A. B. (2019) · Animals · doi:10.3390/ani9121162 · Cited by 23
Self-citationHammond, A., Rowland, T., Mills, D. S., & Pilot, M. (2022) · Evolutionary Applications · doi:10.1111/eva.13479 · Cited by 23
The influence of X chromosome variants on trait neuroticism
Luciano, M., Davies, G., SUMMERS, K. M., Hill, W. D., Hayward, C., Liewald, D. C. M., Porteous, D. J., Galé, C. R., McIntosh, A. M., & Deary, I. J. (2019) · Molecular Psychiatry · doi:10.1038/s41380-019-0388-2 · Cited by 20
A novel genomic region on chromosome 11 associated with fearfulness in dogs
Sarviaho, R., Hakosalo, O., Tiira, K., Sulkama, S., Niskanen, J. E., Hytönen, M. K., Sillanpää, M. J., & Lohi, H. (2020) · Translational Psychiatry · doi:10.1038/s41398-020-0849-z · Cited by 21
Ethical Concerns about Fashionable Dog Breeding
Menor-Campos, D. J. (2024) · Animals · doi:10.3390/ani14050756 · Cited by 20
“Aggression and fear are associated with the same genetic loci linked to small body size, as suggested by the correlation found in Zapata et al.’s studies [162,163].”
BackgroundFenner, K., Dashper, K. L., Serpell, J. A., McLean, A. N., Wilkins, C. L., Klinck, M. P., Wilson, B. J., & McGreevy, P. D. (2020) · Animals · doi:10.3390/ani10111960 · Cited by 20
Self-citationGenetic parameter and breeding value estimation of donkeys' problem-focused coping styles
González, F. J. N., Jordana, J., Jurado, J. M. L., Arbulu, A. A., McLean, A., & Bermejo, J. V. D. (2018) · Behavioural Processes · doi:10.1016/j.beproc.2018.05.008 · Cited by 19
Genome wide association study of 40 clinical measurements in eight dog breeds
Momozawa, Y., Merveille, A., Battaille, G., Wiberg, M. E., Koch, J., Willesen, J. L., Proschowsky, H. F., Gouni, V., Chetboul, V., Tiret, L., et al. (2020) · Scientific Reports · doi:10.1038/s41598-020-63457-y · Cited by 18
Benítez‐Burraco, A., Chekalin, E., Bruskin, S. A., Tatarinova, T. V., & Morozova, I. (2021) · Annals of Human Biology · doi:10.1080/03014460.2021.1936634 · Cited by 18
Li, T., Jin, M., Wang, H., Zhang, W., Yuan, Z., & Wei, C. (2024) · Animals · doi:10.3390/ani14050687 · Cited by 19
van der Borg, J. A. M., Graat, E. A. M., & Beerda, B. (2017) · Applied Animal Behaviour Science · doi:10.1016/j.applanim.2017.06.004 · Cited by 17
Витальевна, Ч. И., Ponomarenko, P. M., Рассказов, Д. А., Sharypova, E. B., Kashina, E. V., Kleshchev, M. A., Ponomarenko, M. P., Naumenko, V. S., Savinkova, L. K., Kolchanov, N. A., et al. (2019) · Frontiers in Genetics · doi:10.3389/fgene.2019.00073 · Cited by 16
Binversie, E. E., Momen, M. M., Rosa, G. J. M., Davis, B. W., & Muir, P. (2022) · Frontiers in Genetics · doi:10.3389/fgene.2022.913354 · Cited by 16
Doane, M., & Sarenbo, S. (2019) · Applied Animal Behaviour Science · doi:10.1016/j.applanim.2019.02.012 · Cited by 16
Eyre, A. W., Zapata, I., Hare, E., Serpell, J. A., Otto, C. M., & Alvarez, C. E. (2023) · Scientific Reports · doi:10.1038/s41598-023-39112-7 · Cited by 14
Self-citationAn exome sequencing based approach for genome-wide association studies in the dog
Broeckx, B. J. G., Derrien, T., Mottier, S., Wucher, V., Cadieu, É., Hédan, B., Béguec, C. L., Botherel, N., Lindblad‐Toh, K., Saunders, J. H., et al. (2017) · Scientific Reports · doi:10.1038/s41598-017-15947-9 · Cited by 14
Чадаева, И. В., Пономаренко, П. М., Kozhemyakina, R. V., Suslov, V. V., Bogomolov, A. G., Klimova, N. V., Шихевич, С. Г., Savinkova, L. K., Oshchepkov, D. Y., Kolchanov, N. A., et al. (2021) · Animals · doi:10.3390/ani11092667 · Cited by 20
Zapata, I., Hecht, E. E., Serpell, J. A., & Alvarez, C. E. (2020) · bioRxiv (Cold Spring Harbor Laboratory) · doi:10.1101/2020.07.19.211078 · Cited by 15
Self-citationCobb, M., Jiménez, A. G., & Dreschel, N. A. (2025) · Journal of Applied Animal Welfare Science · doi:10.1080/10888705.2025.2572616 · Cited by 20
Bogaerts, E., Moons, C. P. H., Nieuwerburgh, F. V., Peelman, L. J., Saunders, J. H., & Broeckx, B. J. G. (2019) · PLoS ONE · doi:10.1371/journal.pone.0218339 · Cited by 13
Influence of early life adversity and breed on aggression and fear in dogs
Espinosa, J., Zapata, I., Alvarez, C. E., Serpell, J. A., Kukekova, A. V., & Hecht, E. E. (2025) · Scientific Reports · doi:10.1038/s41598-025-18226-0 · Cited by 15
Self-citationGenetic dissection of behavioral traits related to successful training of drug detection dogs
Matsumoto, Y., Konno, A., Ishihara, G., & Inoue‐Murayama, M. (2023) · Scientific Reports · doi:10.1038/s41598-023-33638-6 · Cited by 12
Baslington-Davies, A., Howell, H., Hogue, T. E., & Mills, D. S. (2023) · Animals · doi:10.3390/ani13142329 · Cited by 12
Resilience In Dogs? Lessons From Other Species
Tiira, K. (2019) · Veterinary Medicine Research and Reports · doi:10.2147/vmrr.s189566 · Cited by 14
Genome scanning of behavioral selection in a canine olfactory detection breeding cohort
Eyre, A. W., Zapata, I., Hare, E., Lee, K. M. N., Bellis, C., Essler, J. L., Otto, C. M., Serpell, J. A., & Alvarez, C. E. (2022) · Scientific Reports · doi:10.1038/s41598-022-18698-4 · Cited by 12
Self-citationPerspectives on two temperamental biases
Kagan, J. (2018) · Philosophical Transactions of the Royal Society B Biological Sciences · doi:10.1098/rstb.2017.0158 · Cited by 11
Blades, M., Freyer, J., Donner, J., Foran, R. C., & Forman, O. P. (2022) · PLoS ONE · doi:10.1371/journal.pone.0267604 · Cited by 11
Association of DNA methylation with energy and fear-related behaviors in canines
Sanders, A. R., Bhongir, N., vonHoldt, B. M., & Pellegrini, M. A. (2022) · Frontiers in Psychology · doi:10.3389/fpsyg.2022.1025494 · Cited by 13
Oshchepkov, D. Y., Ponomarenko, M. P., Klimova, N. V., Чадаева, И. В., Брагин, А. О., Sharypova, E. B., Шихевич, С. Г., & Kozhemyakina, R. V. (2019) · Frontiers in Genetics · doi:10.3389/fgene.2019.01267 · Cited by 11
Short-term imepitoin treatment reduces stress level in dogs with generalized anxiety disorder
Forster, B., Engel, O., Erhard, M., & Bartels, A. (2020) · Journal of Veterinary Behavior · doi:10.1016/j.jveb.2020.05.006 · Cited by 11
Ponomarenko, M. P., Kleshchev, M. A., Ponomarenko, P. M., Витальевна, Ч. И., Sharypova, E. B., Рассказов, Д. А., Kolmykov, S. K., Drachkova, I. A., Vasiliev, G. V., Gutorova, N., et al. (2020) · BMC Genetics · doi:10.1186/s12863-020-00896-6 · Cited by 11
Carrier, L. O., Ricketts, C. J., Perry, E. A., Anderson, R. E., & Walsh, C. J. (2016) · Journal of Veterinary Behavior · doi:10.1016/j.jveb.2016.12.011 · Cited by 10
Ma, Z., Chang, Y., Brito, L. F., Li, Y., Yang, T. P., Wang, Y., & Yang, N. (2023) · Journal of Dairy Science · doi:10.3168/jds.2023-23462 · Cited by 11
Zaldívar‐López, S., Rowell, J., Fiala, E. M., Zapata, I., Couto, C. G., & Alvarez, C. E. (2017) · BMC Genomics · doi:10.1186/s12864-017-3513-0 · Cited by 10
Self-citationPharmacotherapeutics in clinical ethology: treatment efficacy, clinical pathology and outcome
Overall, K. L. (2021) · Behaviour · doi:10.1163/1568539x-bja10096 · Cited by 8
Can laboratory animals violate behavioural norms? Towards a preclinical model of conduct disorder
Macrı̀, S., Zoratto, F., Chiarotti, F., & Giovanni Laviola, A. (2017) · Neuroscience & Biobehavioral Reviews · doi:10.1016/j.neubiorev.2017.01.047 · Cited by 8
Peťková, B., Skurková, L., Florián, M., Slivková, M., Kasičová, Z., & Kottferová, J. (2024) · Animals · doi:10.3390/ani14182695 · Cited by 8
Vasiliev, G. V., Чадаева, И. В., Рассказов, Д. А., Пономаренко, П. М., Sharypova, E. B., Drachkova, I. A., Bogomolov, A. G., Savinkova, L. K., Ponomarenko, M. P., Kolchanov, N. A., et al. (2021) · International Journal of Molecular Sciences · doi:10.3390/ijms22052346 · Cited by 7
Pritchett, M. E., Barnard, S., & Croney, C. (2021) · Animals · doi:10.3390/ani11030890 · Cited by 7
Bennett, N. E., Torres, S. E. M., & Gray, P. B. (2022) · PLoS ONE · doi:10.1371/journal.pone.0261694 · Cited by 7
Síndrome de Ansiedade por Separação em Animais de Companhia: Uma Revisão
Machado, D. D. S., & Sant’Anna, A. C. (2017) · Revista Brasileira de Zoociências · doi:10.34019/2596-3325.2017.v18.24682 · Cited by 9
The Shepherd and the Hunter: A Genomic Comparison of Italian Dog Breeds
Bionda, A., Cortellari, M., Liotta, L., & Crepaldi, P. (2023) · Animals · doi:10.3390/ani13152438 · Cited by 6
Potential Adaptive Introgression From Dogs in Iberian Grey Wolves ( Canis lupus )
Sarabia, C., Salado, I., Fernández‐Gil, A., vonHoldt, B. M., Hofreiter, M., Vilà, C., & Leonard, J. A. (2025) · Molecular Ecology · doi:10.1111/mec.17639 · Cited by 12
Витальевна, Ч. И., Рассказов, Д. А., Sharypova, E. B., Savinkova, L. K., Ponomarenko, P. M., & Ponomarenko, M. P. (2017) · Russian Journal of Genetics Applied Research · doi:10.1134/s2079059717050045 · Cited by 6
Breed function and behaviour correlate with endocranial volume in domestic dogs
Balcarcel, A. M., Sánchez-Villagra, M. R., Evin, A., Nussbaumer, M., Hemelsdaël, A., & Geiger, M. (2024) · Biology Letters · doi:10.1098/rsbl.2024.0342 · Cited by 5
Bhowmik, N., Cook, S. R., Croney, C., Barnard, S., Romaniuk, A. C., & Ekenstedt, K. J. (2024) · Genes · doi:10.3390/genes15121611 · Cited by 5
Benítez‐Burraco, A. (2019) · Molecular Syndromology · doi:10.1159/000505116 · Cited by 4
Polasik, D., Konieczna, A., Terman, A., & Dybus, A. (2021) · Acta Veterinaria Brno · doi:10.2754/avb202190030295 · Cited by 5
Are feralization and domestication truly mirror processes?
Niego, A., & Benítez‐Burraco, A. (2021) · Ethology Ecology & Evolution · doi:10.1080/03949370.2021.1975314 · Cited by 6
Veterinary education and experience shape beliefs about dog breeds. Part 2: Trust
Caddiell, R. M. P., White, P. A., Lascelles, B. D. X., Royal, K. D., Heugten, K. A., & Gruen, M. E. (2023) · Scientific Reports · doi:10.1038/s41598-023-40464-3 · Cited by 4
Fagen, A. (2024) · Elsevier eBooks · doi:10.1016/b978-0-7020-8214-6.00026-7 · Cited by 4
Mahmoodi, M. S., Mehrgardi, A. A., Momen, M. M., Serpell, J. A., & Esmailizadeh, A. (2024) · The Veterinary Journal · doi:10.1016/j.tvjl.2024.106251 · Cited by 4
Self-citationAn Evolutionary Perspective on Dog Behavioral Genetics
Lord, K. A., Chen, F. L., & Karlsson, E. K. (2024) · Annual Review of Animal Biosciences · doi:10.1146/annurev-animal-111523-101954 · Cited by 9
Dog behaviour : Intricate picture of genetics, epigenetics, and human-dog relations
Sundman, A.-S. (2019) · Linköping studies in science and technology. Dissertations · doi:10.3384/diss.diva-156353 · Cited by 4
Adaptation in the Alleyways: Candidate Genes Under Potential Selection in Urban Coyotes
Kreling, S. E. S., Vance, S. E., & Carlen, E. J. (2024) · Genome Biology and Evolution · doi:10.1093/gbe/evae279 · Cited by 5
Alex, E., Gennotte, P., Morros-Nuevo, A., Yu, Y., Keep, B., Sullivan, M., Mills, D. S., Warrier, V., & Raffan, E. (2025) · Proceedings of the National Academy of Sciences · doi:10.1073/pnas.2421757122 · Cited by 3
Wray, R. E., Barton, S. A., & Hecht, E. E. (2026) · Applied Animal Behaviour Science · doi:10.1016/j.applanim.2026.106959 · Cited by 3
Study of Behavioural Traits in Can de Palleiro (Galician Shepherd Dog)
de Miguel, S. M., Diéguez, F. J., da Silva-Monteiro, J. P., Ferreiro-Mazón, B. P., & González‐Martínez, Á. (2021) · Animals · doi:10.3390/ani11113198 · Cited by 3
Genomic analysis of firework fear and noise reactivity in standard poodles
Handegård, K. W., Storengen, L. M., Joergensen, D., & Lingaas, F. (2023) · Canine Medicine and Genetics · doi:10.1186/s40575-023-00125-0 · Cited by 3
Koller, D., Benítez‐Burraco, A., & Polimanti, R. A. (2023) · Human Genetics · doi:10.1007/s00439-023-02541-5 · Cited by 3
Animal welfare issues in space settlement expeditions
Pozzebon, M. (2024) · Futures · doi:10.1016/j.futures.2024.103443 · Cited by 3
CyberGenomics: Application of Behavioral Genetics in Cybersecurity
Domarkienė, I., Ambrozaitytė, L., Bukauskas, L., Rančelis, T., Sütterlin, S., Knox, B. J., Maennel, K., Maennel, O., Parish, K., Lugo, R. G., et al. (2021) · Behavioral Sciences · doi:10.3390/bs11110152 · Cited by 3
Abnormal features of human self‐domestication in bipolar disorder
Benítez‐Burraco, A., & Hansen, E. J. (2023) · European Journal of Neuroscience · doi:10.1111/ejn.15959 · Cited by 2
Behavioral Genetics of Dog Breeds
van Rooy, D., & Wade, C. M. (2018) · Elsevier eBooks · doi:10.1016/b978-0-12-809633-8.90059-1 · Cited by 3
Nanaei, H. A., Ghanatsaman, Z. A., Farahvashi, M. A., Mousavi, S. F., Banabazi, M. H., & Fozi, M. A. (2024) · Tropical Animal Health and Production · doi:10.1007/s11250-024-04002-1 · Cited by 2
Masson, S., Bleuer‐Elsner, S., Muller, G., Médam, T., Chevallier, J., & Gaultier, E. (2024) · Springer eBooks · doi:10.1007/978-3-031-53012-8_8 · Cited by 2
Metadata
- Authors
- Zapata, I., Serpell, J. A., & Alvarez, C. E.
- Affiliations
- Nationwide Children's Hospital (US)
- University of Pennsylvania (US)
- Corresponding author
- Alvarez, Carlos E.
- Venue
- BMC Genomics
- Published
- 2016-08-08
- Volume
- 17
- Issue
- 1
- Pages
- 572-572
- ISSN
- 1471-2164 (ISSN-L)
- PMC
- PMC4977763
- OpenAlex
- W2518047727
- Cited by
- 168
- References
- 80
- Citations by year
- 2026: 14 · 2025: 17 · 2024: 19 · 2023: 26 · 2022: 20 · 2021: 14 · 2020: 16 · 2019: 18 · 2018: 11 · 2017: 10 · 2016: 3
- FWCI
- 11.30
- Type
- journal article
- Language
- en
- Open access
- gold
- doi.org
- Locations
- BMC Genomics (publishedVersion, cc-by)
- Europe PMC (PubMed Central) (publishedVersion, cc-by)
- PubMed Central (publishedVersion, cc-by)
- PubMed (publishedVersion)
- Funders
- Congressionally Directed Medical Research Programs (W81XWH-11-2-0224)
- American Kennel Club Canine Health Foundation (01660)
- Morris Animal Foundation (D13CA-073)
- Topics
- Life Sciences › Agricultural and Biological Sciences › Animal Science and Zoology › Human-Animal Interaction Studies
- Life Sciences › Biochemistry, Genetics and Molecular Biology › Genetics › Genetic and phenotypic traits in livestock
- Life Sciences › Biochemistry, Genetics and Molecular Biology › Genetics › Genetic Mapping and Diversity in Plants and Animals
- Keywords
- insulin-like growth factor I, HMGA2, IGSF1, separation anxiety, tactile sensitivity, sociability, amygdala, hypothalamic-pituitary-adrenal axis
- MeSH terms
- Aggression, Alleles, Animals, Behavior, Animal, Breeding, Chromosome Mapping, Dogs, Fear, Haplotypes, Linkage Disequilibrium, Genome, Genome-Wide Association Study, Genetic Association Studies
About these checks
Registry, retraction, Cites and statistics results are computed, not judged, with one exception: a printed reference that no index lists is read once by a model before it counts as a citation error. Claims are extracted by a model and kept only when their quote appears verbatim in the text; each cited source is then checked, with a model’s help, for whether it says what the claim relies on. Those verdicts can be wrong — read the claim’s quote and the cited source before relying on one.
Statistics and arithmetic are recomputed, not judged.
Confidence bands are shown only for fields calibrated on our annotated test set. None is calibrated yet, so no band is shown.
What counts as a claim ›How we measure confidence ›How we check this ›
Are you an author, or do you see a problem with this page? Request a review
