

The DOI matches its Crossref record; 1 of the 1 references it cites were found in a registry or an index.
Characterization and remediation of sample index swaps by non-redundant dual indexing on massively parallel sequencing platforms
Published version of a preprint
Overview
The claims and statistics of this paper haven’t been checked yet.
Run the check — free, no account needed. It reads the open-access text and checks the sources it cites.
Integrity signals
Registry
Cites
Statistics
Figures
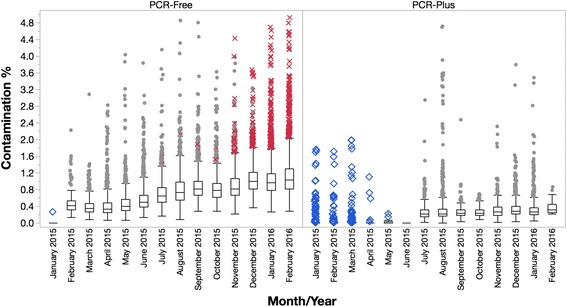
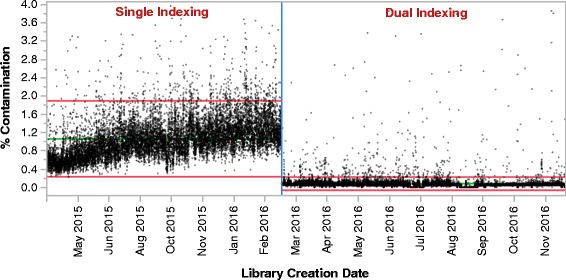
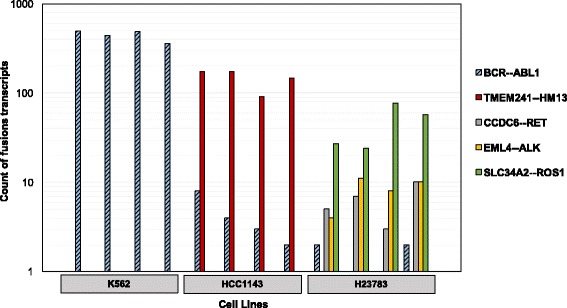
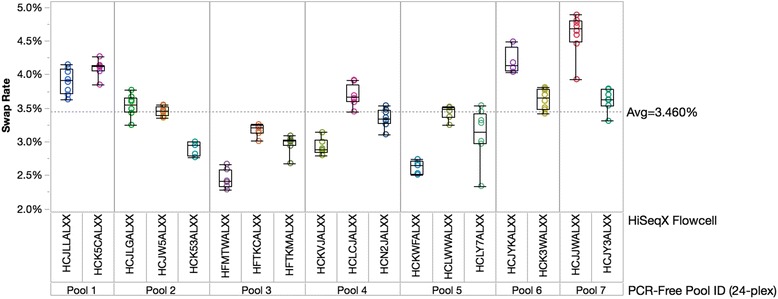
Verification
Claims the paper makes
The claims and statistics of this paper haven’t been checked yet.
Run the check — free, no account needed. It reads the open-access text and checks the sources it cites.
Claims other papers make about this one
Each is checked against this paper’s own text: does it say what the citing paper says it does?
The cited source says what the claim attributes to it.
In the citing paper
“During sequencing preparation, , it is also important to take steps to mitigate index hopping when using Illumina platforms, especially those using patterned flow cells and isothermal cluster generation by exclusion amplification, such as the HiSeq4000, HiSeqX and NovaSeq platforms 173 .”
From Ancient DNA analysis (2021) · cites this paper as [173]
Self-check
Percentages, sums and reported differences re-computed from the paper’s own numbers.
The self-check needs the paper’s full text.
Citations
Cites
Double indexing overcomes inaccuracies in multiplex sequencing on the Illumina platform
Kircher, M., Sawyer, S., & Meyer, M. (2012) · Nucleic Acids Research · doi:10.1093/nar/gkr771 · Cited by 1,106 · cited 1×
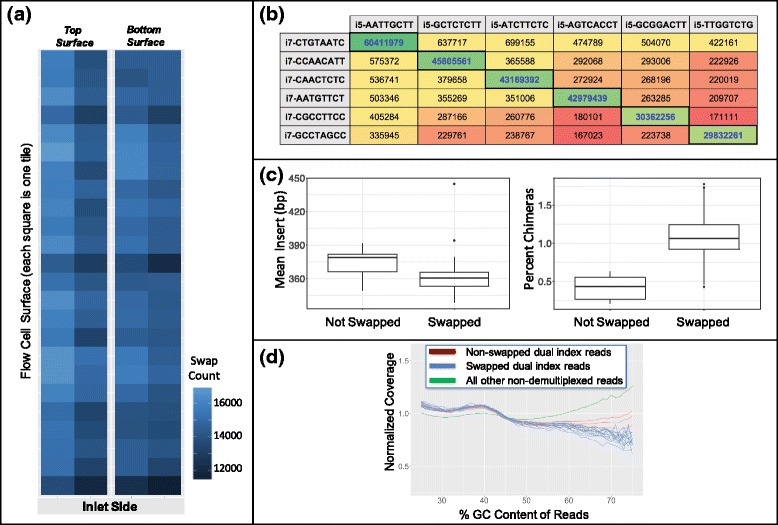
“The results in Table 1 demonstrate that different library preparation methods can have drastically different swap rates and that random cluster amplification se-quencers like MiSeq, NextSeq, or HiSeq 2500 can also introduce a baseline level of index swapping, although the rate is generally low [12].”
Background
Research works printed but not linked: 16
- Illumina, Inc. Illumina HiSeqX series specification sheet. 2017. https://www.illumina.com/content/dam/illumina-marketing/documents/products/datasheets/datasheet-hiseq-x-ten.pdf . Accessed 15 Nov 2017.
- Illumina, Inc. Illumina NovaSeq specification sheet. 2017. https://www.illumina.com/content/dam/illumina-marketing/documents/products/datasheets/novaseq-6000-system-specification-sheet-770-2016-025.pdf . Accessed 15 Nov 2017.
- Sinha R, Stanley G, Gulati GS, Ezran C, Travaglini KJ, Wei E, et al. Index switching causes ‘spreading-of-signal’ among multiplexed samples in illumina HiSeq 4000 DNA sequencing. bioRxiv. 2017; https://doi.org/10.1101/125724 . · DOI
- Illumina, Inc. Effects of index Misassignment on multiplexing and downstream analysis. 2017. https://www.illumina.com/content/dam/illumina-marketing/documents/products/whitepapers/index-hopping-white-paper-770-2017-004.pdf?linkId=36607862 . Accessed 15 Nov 2017.
- Griffiths JA, ATL L, Richard AC, Bach K, Marioni JC. Detection and removal of barcode swapping in single-cell RNA-Seq data. bioRxiv. 2017; https://doi.org/10.1101/177048 . · DOI
- Vodak D, Lorenz S, Nakken S, Aashein LB, Holte H, Bai B, Myklebost, O, Meza-Zepeda, LA, Hovig, E. Sample-index misassignment impacts tumor exome sequencing. bioRxiv. 2017. doi.org : https://doi.org/10.1101/182659 9. · DOI
- Van der Valk T, Vezzi F, Ormestad M, Dalen L, Guschanski K. Low rate of index hopping on the illumina HiSeq X platform. bioRxiv. 2017; https://doi.org/10.1101/179028 . · DOI
- Jun G, Flickinger M, Hetrick KN, Romm JM, Doheny KF, Abecasis GR, Boehnke M, Kang HM. Detecting and estimating contamination of human DNA samples in sequencing and array-based genotype data. Am J Hum Genet. 2012;91(5):839–48. · DOI · Paper page
- Owens GL, Todesco M, Drummond EBM, Yeaman S, Rieseberg LH. A novel post hoc method for detecting index switching finds no evidence for increased switching on the Illumina HiSeq X. Mol Ecol Resour. 2017;00:1–7. https://doi.org/10.1111/1755-0998.12713 . · DOI
- Larsson AJ, Stanley G, Sinha R, Weissman IL, Sandberg R. Computational correction of cross-contamination due to exclusion amplification barcode spreading. bioRxiv. 2017; https://doi.org/10.1101/176537 . · DOI
- Shagin DA, Lukyanov KA, Vagner LL, Matz MV. Regulation of average length of complex PCR product. Nucleic Acids Res. 1999;27(18):e23. · DOI
- Cibulskis K, Lawrence MS, Carter SL, Sivachenko A, Jaffe D, Sougnez C, Gabriel S, Meyerson M, Lander ES, Getz G. Sensitive detection of somatic point mutations in impure and heterogeneous cancer samples. Nat Biotechnol. 2013;31(3):213–9. · DOI
- Wan JCM, Massie C, Garcia-Corbacho J, Mouliere F, Brenton JD, Caldas C, Pacey S, Baird R, Rosenfeld N. Liquid biopsies come of age: towards implementation of circulating tumour DNA. Nat Rev Cancer. 2017;17:223–38. · DOI · Paper page
- Stover DG, Parsons HA, Ha G, Freeman SS, Barry WT, Guo H, Choudhury AD, Gydush G, Reed SC, Rhoades J, Rotem D, Hughes ME, Dillon DA, Partridge AH, Wagle N, Krop IE, Getz G, Golub TR, Love JC, Winer EP, Tolaney SM, Lin NU, Adalsteinsson VA. Association of Cell-Free DNA tumor fraction and somatic copy number alterations with survival in metastatic triple-negative breast Cancer. J Clin Oncol. 2018;36:543–53. https://doi.org/10.1200/JCO.2017.76.0033 . · DOI
- Xu C, Nezami Ranjbar MR, Wu Z, DiCarlo J, Wang Y. Detecting very low allele fraction variants using targeted DNA sequencing and a novel molecular barcode-aware variant caller. BMC Genomics. 2017;18(1):5. · DOI
- Fisher S, Barry A, Abreu J, Minie B, Nolan J, Delorey TM, et al. A scalable, fully automated process for construction of sequence-ready human exome targeted capture libraries. Genome Biol. 2011;12(1):R1. https://doi.org/10.1186/gb-2011-12-1-r1 . · DOI
Cited by
Sorted by citations
Contamination in Low Microbial Biomass Microbiome Studies: Issues and Recommendations
Eisenhofer, R., Minich, J. J., Marotz, C., Cooper, A., Knight, R., & Weyrich, L. S. (2019) · Trends in Microbiology · doi:10.1016/j.tim.2018.11.003 · Cited by 1,146
Decontamination of ambient RNA in single-cell RNA-seq with DecontX
Yang, S., Corbett, S. E., Koga, Y., Wang, Z., Johnson, W. E., Yajima, M., & Campbell, J. D. (2020) · Genome Biology · doi:10.1186/s13059-020-1950-6 · Cited by 635
Orlando, L., Allaby, R., Skoglund, P., Der Sarkissian, C., Stockhammer, P. W., Ávila-Arcos, M. C., Fu, Q., Krause, J., Willerslev, E., Stone, A. C., et al. (2021) · Nature Reviews Methods Primers · doi:10.1038/s43586-020-00011-0 · Cited by 411
Identifying biases and their potential solutions in human microbiome studies
Nearing, J. T., Comeau, A. M., & Langille, M. G. I. (2021) · Microbiome · doi:10.1186/s40168-021-01059-0 · Cited by 240
Altered Skin and Gut Microbiome in Hidradenitis Suppurativa
McCarthy, S., Barrett, M., Kirthi, S., Pellanda, P., Vlckova, K., Tobin, A.-M., Murphy, M., Shanahan, F., & O’Toole, P. W. (2022) · Journal of Investigative Dermatology · doi:10.1016/j.jid.2021.05.036 · Cited by 98
Metadata
- Authors
- Costello, M., Fleharty, M., Abreu, J., Farjoun, Y., Ferriera, S., Holmes, L., Granger, B., Green, L., Howd, T., Mason, T., Vicente, G., Dasilva, M., Brodeur, W., DeSmet, T., Dodge, S., Lennon, N. J., & Gabriel, S.
- ORCID
- Costello, Maura
- Venue
- BMC Genomics
- Published
- 2018-05-08
- Volume
- 19
- Issue
- 1
- ISSN
- 1471-2164
- PMC
- PMC5941783
- Cited by
- 260
- References
- 1
- Language
- en
- Funders
- Center for Common Disease (UM1HG008895)
About these checks
Registry, retraction, Cites and statistics results are computed, not judged, with one exception: a printed reference that no index lists is read once by a model before it counts as a citation error. Claims are extracted by a model and kept only when their quote appears verbatim in the text; each cited source is then checked, with a model’s help, for whether it says what the claim relies on. Those verdicts can be wrong — read the claim’s quote and the cited source before relying on one.
Statistics and arithmetic are recomputed, not judged.
Confidence bands are shown only for fields calibrated on our annotated test set. None is calibrated yet, so no band is shown.
What counts as a claim ›How we measure confidence ›How we check this ›
Are you an author, or do you see a problem with this page? Request a review
