

The DOI matches its Crossref record; 101 of the 104 references it cites were found in a registry or an index; none of the 27 sources its claims cite is checked for support yet.
The advantages of the Matthews correlation coefficient (MCC) over F1 score and accuracy in binary classification evaluation
Open accessAbstract
Background: To evaluate binary classifications and their confusion matrices, scientific researchers can employ several statistical rates, accordingly to the goal of the experiment they are investigating. Despite being a crucial issue in machine learning, no widespread consensus has been reached on a unified elective chosen measure yet. Accuracy and F 1 score computed on confusion matrices have been (and still are) among the most popular adopted metrics in binary classification tasks. However, these statistical measures can dangerously show overoptimistic inflated results, especially on imbalanced datasets. Results: The Matthews correlation coefficient (MCC), instead, is a more reliable statistical rate which produces a high score only if the prediction obtained good results in all of the four confusion matrix categories (true positives, false negatives, true negatives, and false positives), proportionally both to the size of positive elements and the size of negative elements in the dataset. Conclusions: In this article, we show how MCC produces a more informative and truthful score in evaluating binary classifications than accuracy and F 1 score, by first explaining the mathematical properties, and then the asset of MCC in six synthetic use cases and in a real genomics scenario. We believe that the Matthews correlation coefficient should be preferred to accuracy and F 1 score in evaluating binary classification tasks by all scientific communities.
Overview
AI snapshot
Written from the paper’s full text.
TL;DR
The paper argues that the Matthews correlation coefficient (MCC) is a more reliable metric than accuracy and F1 score for evaluating binary classifications, especially on imbalanced datasets, because MCC requires good performance on both positive and negative classes. It supports this through mathematical analysis, six synthetic use cases, and a real colon cancer gene expression experiment.
Key findings
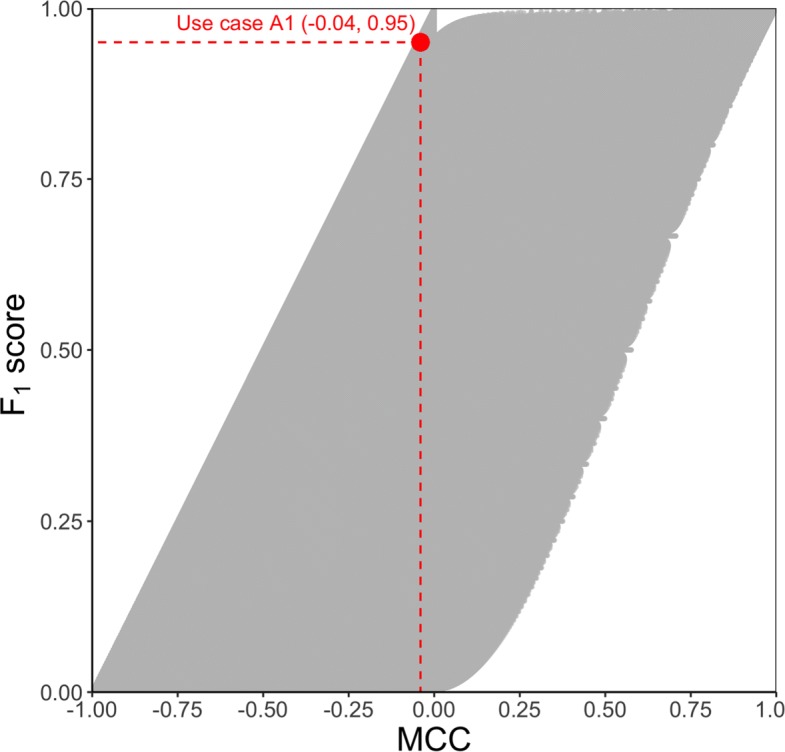
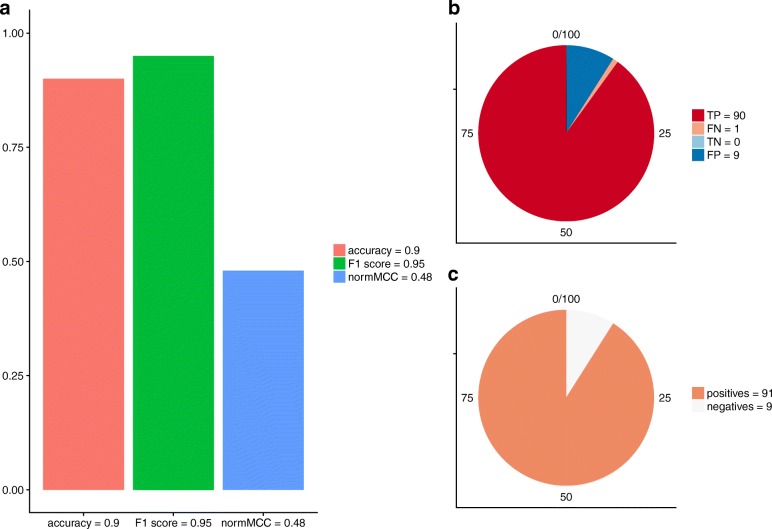
- In six synthetic use cases, MCC was the only metric that correctly indicated the prediction problem in all six. For Use case A1 (91 positives, 9 negatives; TP=90, FN=1, TN=0, FP=9), accuracy=0.90 and F1=0.95, but MCC=−0.03. For Use case C2 (11 positives, 89 negatives; TP=2, FN=9, TN=88, FP=1), accuracy=0.90, F1=0.29, and MCC=+0.31.
- Correlation analysis over all possible confusion matrices showed MCC and accuracy were strongly correlated, while F1 correlated less than 0.8 with the other two measures. For N=1000, PCC(MCC,F1)=0.775982, PCC(MCC,accuracy)=0.921030, and PCC(accuracy,F1)=0.778652.
- In the colon cancer gene expression dataset (2,000 gene probesets, 62 patients: 22 healthy controls and 40 colon cancer; 35.48% negatives, 64.52% positives), rankings differed by metric. MCC ranked gradient boosting top (MCC=+0.55, TP rate=0.85, TN rate=0.69), while F1 and accuracy ranked k-NN top (F1=0.87, accuracy=0.80, TP rate=0.92, TN rate=0.52). Radial SVM had F1=0.75 and accuracy=0.67 but TN rate=0.40 and MCC=+0.29.
- MCC produces a high score only if the classifier correctly predicts the majority of positive and negative instances; F1 is independent of true negatives and is not symmetric for class swapping, while accuracy can be overoptimistic on imbalanced datasets.
Methods
- The paper defines accuracy, MCC, and F1 score mathematically, explores their relationships using Pearson correlation coefficient over all possible confusion matrices for N≥10 up to 1000, and plots all 21,084,251 possible confusion matrices for a 500-sample dataset on the MCC/F1 plane.
- Six synthetic use cases vary class balance and imbalance with specified confusion matrices to compare metric behavior.
- The real genomics experiment uses colon cancer gene expression data from Alon et al. via the plsgenomics R package, applying gradient boosting, decision tree, k-nearest neighbors, linear SVM, and radial SVM. Training/test splits were 80/20 or 60/20/20 with validation for hyperparameter grid search; experiments were repeated ten times and averaged for MCC, F1, accuracy, TP rate, and TN rate.
Limitations
- The paper states that additional comparisons with other rates such as Cohen’s Kappa, Cramér’s V, and K measure would have provided further information, but the authors focused on accuracy and F1 because they are more commonly used in biomedical machine learning studies.
- The paper notes that MCC can be undefined when a whole row or column of the confusion matrix is zero, and handles these cases via an approximation using an arbitrarily small value ε; it also cites situations where MCC can display large fluctuations due to imbalanced outcomes.
- Evident from the text: the real-world validation uses a single colon cancer gene expression dataset, the six use cases are synthetic, and Table 5 excludes standard deviations to keep the table simple.
Model-written summary. Check it against the paper before relying on it.
Integrity signals
Registry
Cites
Statistics
Figures
Verification
Claims the paper makes
29 Own interpretation · 28 Own result · 15 Not checked yet · 13 No basis given
The paper states this without a source or data behind it here, so there is nothing to check it against. The quote shows it is in the paper.
In the paper
“A potential problem with MCC lies in the fact that MCC is undefined when a whole row or column of M is zero, as it happens in the previously cited case of the trivial majority classifier.”
§ The advantages of the Matthews correlation coefficient (MCC) over F1 score and accuracy in binary classification evaluation > Methods > Notation and mathematical foundations
plainn = 4- Asserted: passes — The authors put it forward as true.
- Checkable: passes — It can be checked against evidence.
- Load-bearing: passes — The paper’s conclusions depend on it.
- Based: passes — The paper gives a reason why it holds.
The paper states this without a source or data behind it here, so there is nothing to check it against. The quote shows it is in the paper.
In the paper
“Second, F1 score is independent from the number of samples correctly classified as negative.”
§ The advantages of the Matthews correlation coefficient (MCC) over F1 score and accuracy in binary classification evaluation > Background
plain- Asserted: passes — The authors put it forward as true.
- Checkable: passes — It can be checked against evidence.
- Load-bearing: passes — The paper’s conclusions depend on it.
- Based: passes — The paper gives a reason why it holds.
A result the paper reports from its own data — it cites no other source for it, so there is none to check. The quote shows it is in the paper.
In the paper
“she/he would notice good results (F1 score = 0.75 and accuracy = 0.67)”
§ The advantages of the Matthews correlation coefficient (MCC) over F1 score and accuracy in binary classification evaluation > Results and discussion > Genomics scenario: colon cancer gene expression
hedged- Asserted: passes — The authors put it forward as true.
- Checkable: passes — It can be checked against evidence.
- Load-bearing: unclear — It is unclear whether the paper’s conclusions depend on it.
- Based: passes — The paper gives a reason why it holds.
A result the paper reports from its own data — it cites no other source for it, so there is none to check. The quote shows it is in the paper.
In the paper
“For the Use case A1 (negatively imbalanced dataset), the machine learning classifier was unable to correctly predict negative data instances, and it therefore produced confusion matrices featuring few true negatives (TN).”
§ The advantages of the Matthews correlation coefficient (MCC) over F1 score and accuracy in binary classification evaluation > Results and discussion > Use cases
plaindirect- Asserted: passes — The authors put it forward as true.
- Checkable: passes — It can be checked against evidence.
- Load-bearing: passes — The paper’s conclusions depend on it.
- Based: passes — The paper gives a reason why it holds.
A result the paper reports from its own data — it cites no other source for it, so there is none to check. The quote shows it is in the paper.
In the paper
“First, the top classifier changes when we consider the ranking based on MCC, F1 score, or accuracy.”
§ The advantages of the Matthews correlation coefficient (MCC) over F1 score and accuracy in binary classification evaluation > Results and discussion > Genomics scenario: colon cancer gene expression
plaindirect- Asserted: passes — The authors put it forward as true.
- Checkable: passes — It can be checked against evidence.
- Load-bearing: passes — The paper’s conclusions depend on it.
- Based: passes — The paper gives a reason why it holds.
A result the paper reports from its own data — it cites no other source for it, so there is none to check. The quote shows it is in the paper.
In the paper
“MCC = +0.31 in the [–1, +1] interval”
§ The advantages of the Matthews correlation coefficient (MCC) over F1 score and accuracy in binary classification evaluation > Results and discussion > Use cases
plain- Asserted: passes — The authors put it forward as true.
- Checkable: passes — It can be checked against evidence.
- Load-bearing: unclear — It is unclear whether the paper’s conclusions depend on it.
- Based: passes — The paper gives a reason why it holds.
A result the paper reports from its own data — it cites no other source for it, so there is none to check. The quote shows it is in the paper.
In the paper
“In the Use case B1 (balanced dataset), the machine learning method was unable to correctly predict negative data instances, and therefore produced a confusion matrix featuring few true negatives (TN).”
§ The advantages of the Matthews correlation coefficient (MCC) over F1 score and accuracy in binary classification evaluation > Results and discussion > Use cases
plaindirect- Asserted: passes — The authors put it forward as true.
- Checkable: passes — It can be checked against evidence.
- Load-bearing: passes — The paper’s conclusions depend on it.
- Based: passes — The paper gives a reason why it holds.
A result the paper reports from its own data — it cites no other source for it, so there is none to check. The quote shows it is in the paper.
In the paper
“Finally, in the last Use case C2 (positively imbalanced dataset), the prediction technique failed in predicting negative elements, and therefore its confusion matrix showed a low percentage of true negatives.”
§ The advantages of the Matthews correlation coefficient (MCC) over F1 score and accuracy in binary classification evaluation > Results and discussion > Use cases
plaindirect- Asserted: passes — The authors put it forward as true.
- Checkable: passes — It can be checked against evidence.
- Load-bearing: passes — The paper’s conclusions depend on it.
- Based: passes — The paper gives a reason why it holds.
A result the paper reports from its own data — it cites no other source for it, so there is none to check. The quote shows it is in the paper.
In the paper
“F1 score = 0.29 in the [0, 1] interval”
§ The advantages of the Matthews correlation coefficient (MCC) over F1 score and accuracy in binary classification evaluation > Results and discussion > Use cases
plain- Asserted: passes — The authors put it forward as true.
- Checkable: passes — It can be checked against evidence.
- Load-bearing: unclear — It is unclear whether the paper’s conclusions depend on it.
- Based: passes — The paper gives a reason why it holds.
A result the paper reports from its own data — it cites no other source for it, so there is none to check. The quote shows it is in the paper.
In the paper
“the radial SVM has performed poorly on the true negatives (TN rate = 0.40), by correctly predicting less than half patients.”
§ The advantages of the Matthews correlation coefficient (MCC) over F1 score and accuracy in binary classification evaluation > Results and discussion > Genomics scenario: colon cancer gene expression
plain- Asserted: passes — The authors put it forward as true.
- Checkable: passes — It can be checked against evidence.
- Load-bearing: passes — The paper’s conclusions depend on it.
- Based: passes — The paper gives a reason why it holds.
A result the paper reports from its own data — it cites no other source for it, so there is none to check. The quote shows it is in the paper.
In the paper
“while in the F1 score ranking and in the accuracy ranking the best classifier resulted being k-NN (F1 score = 0.87 and accuracy = 0.81).”
§ The advantages of the Matthews correlation coefficient (MCC) over F1 score and accuracy in binary classification evaluation > Results and discussion > Genomics scenario: colon cancer gene expression
plain- Asserted: passes — The authors put it forward as true.
- Checkable: passes — It can be checked against evidence.
- Load-bearing: unclear — It is unclear whether the paper’s conclusions depend on it.
- Based: passes — The paper gives a reason why it holds.
The paper states this without a source or data behind it here, so there is nothing to check it against. The quote shows it is in the paper.
In the paper
“Even if accuracy showed an excessively high result score”
§ The advantages of the Matthews correlation coefficient (MCC) over F1 score and accuracy in binary classification evaluation > Results and discussion > Use cases
plain- Asserted: passes — The authors put it forward as true.
- Checkable: passes — It can be checked against evidence.
- Load-bearing: passes — The paper’s conclusions depend on it.
- Based: passes — The paper gives a reason why it holds.
A result the paper reports from its own data — it cites no other source for it, so there is none to check. The quote shows it is in the paper.
In the paper
“The classifier did not find enough true positives for the Use case B2 (balanced dataset), too.”
§ The advantages of the Matthews correlation coefficient (MCC) over F1 score and accuracy in binary classification evaluation > Results and discussion > Use cases
plain- Asserted: passes — The authors put it forward as true.
- Checkable: passes — It can be checked against evidence.
- Load-bearing: unclear — It is unclear whether the paper’s conclusions depend on it.
- Based: passes — The paper gives a reason why it holds.
A result the paper reports from its own data — it cites no other source for it, so there is none to check. The quote shows it is in the paper.
In the paper
“In our example, in fact, the top MCC ranking classifier gradient boosting did quite well both on the recall (TP rate = 0.85) and on the specificity (TN rate = 0.69).”
§ The advantages of the Matthews correlation coefficient (MCC) over F1 score and accuracy in binary classification evaluation > Results and discussion > Genomics scenario: colon cancer gene expression
plain- Asserted: passes — The authors put it forward as true.
- Checkable: passes — It can be checked against evidence.
- Load-bearing: passes — The paper’s conclusions depend on it.
- Based: passes — The paper gives a reason why it holds.
A result the paper reports from its own data — it cites no other source for it, so there is none to check. The quote shows it is in the paper.
In the paper
“In the MCC ranking, in fact, the top performing method is gradient boosting (MCC = +0.55)”
§ The advantages of the Matthews correlation coefficient (MCC) over F1 score and accuracy in binary classification evaluation > Results and discussion > Genomics scenario: colon cancer gene expression
plain- Asserted: passes — The authors put it forward as true.
- Checkable: passes — It can be checked against evidence.
- Load-bearing: passes — The paper’s conclusions depend on it.
- Based: passes — The paper gives a reason why it holds.
A result the paper reports from its own data — it cites no other source for it, so there is none to check. The quote shows it is in the paper.
In the paper
“while in the F1 score ranking and in the accuracy ranking the best classifier resulted being k-NN (F1 score = 0.87 and accuracy = 0.81).”
§ The advantages of the Matthews correlation coefficient (MCC) over F1 score and accuracy in binary classification evaluation > Results and discussion > Genomics scenario: colon cancer gene expression
plain- Asserted: passes — The authors put it forward as true.
- Checkable: passes — It can be checked against evidence.
- Load-bearing: unclear — It is unclear whether the paper’s conclusions depend on it.
- Based: passes — The paper gives a reason why it holds.
A result the paper reports from its own data — it cites no other source for it, so there is none to check. The quote shows it is in the paper.
In the paper
“she/he would notice good results (F1 score = 0.75 and accuracy = 0.67)”
§ The advantages of the Matthews correlation coefficient (MCC) over F1 score and accuracy in binary classification evaluation > Results and discussion > Genomics scenario: colon cancer gene expression
hedged- Asserted: passes — The authors put it forward as true.
- Checkable: passes — It can be checked against evidence.
- Load-bearing: unclear — It is unclear whether the paper’s conclusions depend on it.
- Based: passes — The paper gives a reason why it holds.
A result the paper reports from its own data — it cites no other source for it, so there is none to check. The quote shows it is in the paper.
In the paper
“In the Use case A2 (positively imbalanced dataset), instead, the method did not predict correctly enough positive data instances, and therefore showed few true positives.”
§ The advantages of the Matthews correlation coefficient (MCC) over F1 score and accuracy in binary classification evaluation > Results and discussion > Use cases
plaindirect- Asserted: passes — The authors put it forward as true.
- Checkable: passes — It can be checked against evidence.
- Load-bearing: unclear — It is unclear whether the paper’s conclusions depend on it.
- Based: passes — The paper gives a reason why it holds.
A result the paper reports from its own data — it cites no other source for it, so there is none to check. The quote shows it is in the paper.
In the paper
“Also in the Use case C1 (positively imbalanced dataset), the machine learning method was unable to correctly recognize negative data instances, and therefore produced a confusion matrix with a low number of true negative (TN).”
§ The advantages of the Matthews correlation coefficient (MCC) over F1 score and accuracy in binary classification evaluation > Results and discussion > Use cases
plaindirect- Asserted: passes — The authors put it forward as true.
- Checkable: passes — It can be checked against evidence.
- Load-bearing: passes — The paper’s conclusions depend on it.
- Based: passes — The paper gives a reason why it holds.
A result the paper reports from its own data — it cites no other source for it, so there is none to check. The quote shows it is in the paper.
In the paper
“Decision tree changes its position from one ranking to another, too.”
§ The advantages of the Matthews correlation coefficient (MCC) over F1 score and accuracy in binary classification evaluation > Results and discussion > Genomics scenario: colon cancer gene expression
plaincorrelational- Asserted: passes — The authors put it forward as true.
- Checkable: passes — It can be checked against evidence.
- Load-bearing: unclear — It is unclear whether the paper’s conclusions depend on it.
- Based: passes — The paper gives a reason why it holds.
A conclusion the paper draws from its own results — it cites no other source for it, so there is none to check. The quote shows it is in the paper.
In the paper
“However, these statistical measures can dangerously show overoptimistic inflated results, especially on imbalanced datasets.”
§ The advantages of the Matthews correlation coefficient (MCC) over F1 score and accuracy in binary classification evaluation > Abstract > Background
plainconditional- Asserted: passes — The authors put it forward as true.
- Checkable: passes — It can be checked against evidence.
- Load-bearing: passes — The paper’s conclusions depend on it.
- Based: unclear — It is unclear why the paper says it holds.
A conclusion the paper draws from its own results — it cites no other source for it, so there is none to check. The quote shows it is in the paper.
In the paper
“The Matthews correlation coefficient (MCC), instead, is a more reliable statistical rate which produces a high score only if the prediction obtained good results in all of the four confusion matrix categories (true positives, false negatives, true negatives, and false positives), proportionally both to the size of positive elements and the size of negative elements in the dataset.”
§ The advantages of the Matthews correlation coefficient (MCC) over F1 score and accuracy in binary classification evaluation > Abstract > Results
plaindirect- Asserted: passes — The authors put it forward as true.
- Checkable: passes — It can be checked against evidence.
- Load-bearing: passes — The paper’s conclusions depend on it.
- Based: passes — The paper gives a reason why it holds.
A conclusion the paper draws from its own results — it cites no other source for it, so there is none to check. The quote shows it is in the paper.
In the paper
“By seeing a value close to zero in the [–1, +1] interval, he/she would be able to understand that the machine learning method has performed poorly.”
§ The advantages of the Matthews correlation coefficient (MCC) over F1 score and accuracy in binary classification evaluation > Results and discussion > Use cases
hedgedcorrelationalSingle case- Asserted: passes — The authors put it forward as true.
- Checkable: passes — It can be checked against evidence.
- Load-bearing: passes — The paper’s conclusions depend on it.
- Based: passes — The paper gives a reason why it holds.
A conclusion the paper draws from its own results — it cites no other source for it, so there is none to check. The quote shows it is in the paper.
In the paper
“In this article, we show how MCC produces a more informative and truthful score in evaluating binary classifications than accuracy and F1 score”
§ The advantages of the Matthews correlation coefficient (MCC) over F1 score and accuracy in binary classification evaluation > Abstract > Conclusions
boosteddirectn = 6- Asserted: passes — The authors put it forward as true.
- Checkable: passes — It can be checked against evidence.
- Load-bearing: passes — The paper’s conclusions depend on it.
- Based: passes — The paper gives a reason why it holds.
- Rests on an assumption: The synthetic use cases are realistic representations of binary classification scenarios.
None of the sources cited for this claim have been checked yet.
In the paper
“However, when the dataset is unbalanced (the number of samples in one class is much larger than the number of samples in the other classes), accuracy cannot be considered a reliable measure anymore, because it provides an overoptimistic estimation of the classifier ability on the majority class [32–35].”
§ The advantages of the Matthews correlation coefficient (MCC) over F1 score and accuracy in binary classification evaluation > Background
What the sources say
- Not checked yetcites [32] Sokolova M, Japkowicz N, Szpakowicz S. Beyond accuracy, F-score and ROC: a family of discriminant measures for performance evaluation. In: Proceedings of Advances in Artificial Intelligence (AI 2006), Lecture Notes in Computer Science, vol. 4304. Heidelberg: Springer: 2006. p. 1015–21.
- Not checked yetcites [33] Gu Q, Zhu L, Cai Z. Evaluation measures of the classification performance of imbalanced data sets. In: Proceedings of ISICA 2009 – the 4th International Symposium on Computational Intelligence and Intelligent Systems, Communications in Computer and Information Science, vol. 51. Heidelberg: Springer: 2009. p. 461–71.
- Not checked yetcites [34] Bekkar M, Djemaa HK, Alitouche TA. Evaluation measures for models assessment over imbalanced data sets. J Informa Eng Appl. 2013; 3(10):27–38.
- Not checked yetcites [35] Akosa JS. Predictive accuracy: a misleading performance measure for highly imbalanced data. In: Proceedings of the SAS Global Forum 2017 Conference. Cary, North Carolina: SAS Institute Inc.: 2017. p. 942–2017.
plaindirect- Asserted: passes — The authors put it forward as true.
- Checkable: passes — It can be checked against evidence.
- Load-bearing: passes — The paper’s conclusions depend on it.
- Based: passes — The paper gives a reason why it holds.
A conclusion the paper draws from its own results — it cites no other source for it, so there is none to check. The quote shows it is in the paper.
In the paper
“At this point, if one decided to evaluate the performance of this classifier by considering only accuracy and F1 score, he/she would overoptimistically think that the computational method generated excellent predictions.”
§ The advantages of the Matthews correlation coefficient (MCC) over F1 score and accuracy in binary classification evaluation > Results and discussion > Use cases
hedgeddirectSingle case- Asserted: passes — The authors put it forward as true.
- Checkable: passes — It can be checked against evidence.
- Load-bearing: passes — The paper’s conclusions depend on it.
- Based: passes — The paper gives a reason why it holds.
None of the sources cited for this claim have been checked yet.
In the paper
“MCC is the only binary classification rate that generates a high score only if the binary predictor was able to correctly predict the majority of positive data instances and the majority of negative data instances [80, 97].”
§ The advantages of the Matthews correlation coefficient (MCC) over F1 score and accuracy in binary classification evaluation > Methods > Notation and mathematical foundations
What the sources say
- Not checked yetcites [80] Jurman G, Riccadonna S, Furlanello C. A comparison of MCC and CEN error measures in multi-class prediction. PLoS ONE. 2012; 7(8):41882. source
- Not checked yetcites [97] Chicco D. Ten quick tips for machine learning in computational biology. BioData Min. 2017; 10(35):1–17.
plaincorrelational- Asserted: passes — The authors put it forward as true.
- Checkable: passes — It can be checked against evidence.
- Load-bearing: passes — The paper’s conclusions depend on it.
- Based: passes — The paper gives a reason why it holds.
A conclusion the paper draws from its own results — it cites no other source for it, so there is none to check. The quote shows it is in the paper.
In the paper
“As we explained earlier, the key advantage of the Matthews correlation coefficient is that it generates a high quality score only if the prediction correctly classified a high percentage of negative data instances and a high percentage of positive data instances, with any class balance or imbalance.”
- Also stated in: § Conclusions · plain
“The criterion of MCC is intuitive and straightforward: to get a high quality score, the classifier has to make correct predictions both on the majority of the negative cases, and on the majority of the positive cases, independently of their ratios in the overall dataset.”
§ The advantages of the Matthews correlation coefficient (MCC) over F1 score and accuracy in binary classification evaluation > Results and discussion > Use cases
plaindirect- Asserted: passes — The authors put it forward as true.
- Checkable: passes — It can be checked against evidence.
- Load-bearing: passes — The paper’s conclusions depend on it.
- Based: passes — The paper gives a reason why it holds.
- Also stated in: § Conclusions · plain
A conclusion the paper draws from its own results — it cites no other source for it, so there is none to check. The quote shows it is in the paper.
In the paper
“Here, accuracy again generated an overoptimistic inflated score”
§ The advantages of the Matthews correlation coefficient (MCC) over F1 score and accuracy in binary classification evaluation > Results and discussion > Use cases
plaindirect- Asserted: passes — The authors put it forward as true.
- Checkable: passes — It can be checked against evidence.
- Load-bearing: passes — The paper’s conclusions depend on it.
- Based: passes — The paper gives a reason why it holds.
A conclusion the paper draws from its own results — it cites no other source for it, so there is none to check. The quote shows it is in the paper.
In the paper
“In this case, F1 generated an overoptimistic result”
§ The advantages of the Matthews correlation coefficient (MCC) over F1 score and accuracy in binary classification evaluation > Results and discussion > Use cases
plaindirectSingle case- Asserted: passes — The authors put it forward as true.
- Checkable: passes — It can be checked against evidence.
- Load-bearing: passes — The paper’s conclusions depend on it.
- Based: passes — The paper gives a reason why it holds.
A conclusion the paper draws from its own results — it cites no other source for it, so there is none to check. The quote shows it is in the paper.
In the paper
“while for the Use case A2, B2, C1, all the three rates (accuracy, F1, and MCC) are able to show this information.”
§ The advantages of the Matthews correlation coefficient (MCC) over F1 score and accuracy in binary classification evaluation > Results and discussion > Use cases
plaincorrelational- Asserted: passes — The authors put it forward as true.
- Checkable: passes — It can be checked against evidence.
- Load-bearing: unclear — It is unclear whether the paper’s conclusions depend on it.
- Based: passes — The paper gives a reason why it holds.
A conclusion the paper draws from its own results — it cites no other source for it, so there is none to check. The quote shows it is in the paper.
In the paper
“For the Use case B1, MCC and accuracy are able to inform about the poor performance of the classifier in the prediction of negative data instances”
- Also stated in: § Use cases · plain
“while accuracy and the MCC correctly produced low results that highlight an issue in the prediction.”
§ The advantages of the Matthews correlation coefficient (MCC) over F1 score and accuracy in binary classification evaluation > Results and discussion > Use cases
plaincorrelational- Asserted: passes — The authors put it forward as true.
- Checkable: passes — It can be checked against evidence.
- Load-bearing: passes — The paper’s conclusions depend on it.
- Based: passes — The paper gives a reason why it holds.
- Also stated in: § Use cases · plain
A conclusion the paper draws from its own results — it cites no other source for it, so there is none to check. The quote shows it is in the paper.
In the paper
“while for the Use case A2, B2, C1, all the three rates (accuracy, F1, and MCC) are able to show this information.”
§ The advantages of the Matthews correlation coefficient (MCC) over F1 score and accuracy in binary classification evaluation > Results and discussion > Use cases
plaincorrelational- Asserted: passes — The authors put it forward as true.
- Checkable: passes — It can be checked against evidence.
- Load-bearing: unclear — It is unclear whether the paper’s conclusions depend on it.
- Based: passes — The paper gives a reason why it holds.
A conclusion the paper draws from its own results — it cites no other source for it, so there is none to check. The quote shows it is in the paper.
In the paper
“while F1 and the MCC correctly produced low results that indicated a problem in the prediction process.”
§ The advantages of the Matthews correlation coefficient (MCC) over F1 score and accuracy in binary classification evaluation > Results and discussion > Use cases
plaindirect- Asserted: passes — The authors put it forward as true.
- Checkable: passes — It can be checked against evidence.
- Load-bearing: passes — The paper’s conclusions depend on it.
- Based: passes — The paper gives a reason why it holds.
A conclusion the paper draws from its own results — it cites no other source for it, so there is none to check. The quote shows it is in the paper.
In the paper
“she/he would be correctly informed about the low quality of the prediction (Additional file 5a).”
- Also stated in: § Use cases · plain
“For the Use case C2, the MCC and F1 are able to recognize the weak performance of the algorithm in predicting one of the two original dataset classes.”
- Also stated in: § Use cases · plain
“while F1 and MCC were able to produce a low score that correctly reflected the prediction issue.”
§ The advantages of the Matthews correlation coefficient (MCC) over F1 score and accuracy in binary classification evaluation > Results and discussion > Use cases
plaincorrelational- Asserted: passes — The authors put it forward as true.
- Checkable: passes — It can be checked against evidence.
- Load-bearing: passes — The paper’s conclusions depend on it.
- Based: passes — The paper gives a reason why it holds.
- Also stated in: § Use cases · plain
A conclusion the paper draws from its own results — it cites no other source for it, so there is none to check. The quote shows it is in the paper.
In the paper
“Similar to the synthetic Use case A1 previously described (Fig. 2 and Table 4), the Matthews correlation coefficient is the only aggregate rate highlighting the weak performance of the classifier here.”
§ The advantages of the Matthews correlation coefficient (MCC) over F1 score and accuracy in binary classification evaluation > Results and discussion > Genomics scenario: colon cancer gene expression
plain- Asserted: passes — The authors put it forward as true.
- Checkable: passes — It can be checked against evidence.
- Load-bearing: passes — The paper’s conclusions depend on it.
- Based: passes — The paper gives a reason why it holds.
A conclusion the paper draws from its own results — it cites no other source for it, so there is none to check. The quote shows it is in the paper.
In the paper
“In summary, even if F1 and accuracy results were able to reflect the prediction issue in some of the six analyzed use cases, the Matthews correlation coefficient was the only score which correctly indicated the prediction problem in all six examples (Table 4).”
§ The advantages of the Matthews correlation coefficient (MCC) over F1 score and accuracy in binary classification evaluation > Results and discussion > Use cases
plainn = 6- Asserted: passes — The authors put it forward as true.
- Checkable: passes — It can be checked against evidence.
- Load-bearing: passes — The paper’s conclusions depend on it.
- Based: passes — The paper gives a reason why it holds.
A conclusion the paper draws from its own results — it cites no other source for it, so there is none to check. The quote shows it is in the paper.
In the paper
“while the Matthews correlation coefficient was the only statistical rate which identified the aforementioned prediction problem, and therefore to provide a low truthful quality score.”
- Also stated in: § Use cases · plain
“For the Use case A1, MCC is the only statistical rate able to truthfully inform the readership about the poor performance of the classifier.”
- Also stated in: § Use cases · plain
“Particularly, in the Use case A1 (a prediction which generated many true positives and few true negatives on a positively imbalanced dataset), the MCC was the only statistical rate able to truthfully highlight the classification problem, while the other two rates showed misleading results (Fig. 2).”
§ The advantages of the Matthews correlation coefficient (MCC) over F1 score and accuracy in binary classification evaluation > Results and discussion > Use cases
plaindirect- Asserted: passes — The authors put it forward as true.
- Checkable: passes — It can be checked against evidence.
- Load-bearing: passes — The paper’s conclusions depend on it.
- Based: passes — The paper gives a reason why it holds.
- Also stated in: § Use cases · plain
A conclusion the paper draws from its own results — it cites no other source for it, so there is none to check. The quote shows it is in the paper.
In the paper
“the values of F1 and MCC correctly reflected the low quality of the prediction.”
§ The advantages of the Matthews correlation coefficient (MCC) over F1 score and accuracy in binary classification evaluation > Results and discussion > Use cases
plaincorrelational- Asserted: passes — The authors put it forward as true.
- Checkable: passes — It can be checked against evidence.
- Load-bearing: unclear — It is unclear whether the paper’s conclusions depend on it.
- Based: passes — The paper gives a reason why it holds.
A conclusion the paper draws from its own results — it cites no other source for it, so there is none to check. The quote shows it is in the paper.
In the paper
“The MCC ranking, instead, takes into account this information.”
§ The advantages of the Matthews correlation coefficient (MCC) over F1 score and accuracy in binary classification evaluation > Results and discussion > Genomics scenario: colon cancer gene expression
plaindirect- Asserted: passes — The authors put it forward as true.
- Checkable: passes — It can be checked against evidence.
- Load-bearing: passes — The paper’s conclusions depend on it.
- Based: passes — The paper gives a reason why it holds.
A conclusion the paper draws from its own results — it cites no other source for it, so there is none to check. The quote shows it is in the paper.
In the paper
“while for the Use case A2, B2, C1, all the three rates (accuracy, F1, and MCC) are able to show this information.”
- Also stated in: § Use cases · plain
“In this case, all the analyzed rates (accuracy, F1, and MCC) produced average or low results which correctly represented the prediction issue.”
§ The advantages of the Matthews correlation coefficient (MCC) over F1 score and accuracy in binary classification evaluation > Results and discussion > Use cases
plaincorrelational- Asserted: passes — The authors put it forward as true.
- Checkable: passes — It can be checked against evidence.
- Load-bearing: unclear — It is unclear whether the paper’s conclusions depend on it.
- Based: passes — The paper gives a reason why it holds.
- Also stated in: § Use cases · plain
- Probably not a substantial claim. 15
- The quote only partly states this claim. 5
- It may state two separate claims as one. 36
A result the paper reports from its own data — it cites no other source for it, so there is none to check. The quote shows it is in the paper.
In the paper
“Here, accuracy showed a high value: 0.90 in the [0, 1] interval.”
§ The advantages of the Matthews correlation coefficient (MCC) over F1 score and accuracy in binary classification evaluation > Results and discussion > Use cases
plain- Asserted: passes — The authors put it forward as true.
- Checkable: passes — It can be checked against evidence.
- Load-bearing: passes — The paper’s conclusions depend on it.
- Based: passes — The paper gives a reason why it holds.
Probably not a substantial claim. The quote only partly states this claim.
A result the paper reports from its own data — it cites no other source for it, so there is none to check. The quote shows it is in the paper.
In the paper
“In this case, all three statistical rates showed a low score which emphasized the deficiency in the prediction process (accuracy = 0.24, F1 score = 0.12, and MCC = −0.24).”
§ The advantages of the Matthews correlation coefficient (MCC) over F1 score and accuracy in binary classification evaluation > Results and discussion > Use cases
plain- Asserted: passes — The authors put it forward as true.
- Checkable: passes — It can be checked against evidence.
- Load-bearing: unclear — It is unclear whether the paper’s conclusions depend on it.
- Based: passes — The paper gives a reason why it holds.
It may state two separate claims as one.
The paper states this without a source or data behind it here, so there is nothing to check it against. The quote shows it is in the paper.
In the paper
“It ranges in the interval [−1,+1], with extreme values –1 and +1 reached in case of perfect misclassification and perfect classification, respectively, while MCC=0 is the expected value for the coin tossing classifier.”
§ The advantages of the Matthews correlation coefficient (MCC) over F1 score and accuracy in binary classification evaluation > Methods > Notation and mathematical foundations
plain- Asserted: passes — The authors put it forward as true.
- Checkable: passes — It can be checked against evidence.
- Load-bearing: passes — The paper’s conclusions depend on it.
- Based: passes — The paper gives a reason why it holds.
Probably not a substantial claim. It may state two separate claims as one.
The paper states this without a source or data behind it here, so there is nothing to check it against. The quote shows it is in the paper.
In the paper
“F1 ranges in [0,1], where the minimum is reached for TP=0, that is, when all the positive samples are misclassified, and the maximum for FN=FP=0, that is for perfect classification.”
§ The advantages of the Matthews correlation coefficient (MCC) over F1 score and accuracy in binary classification evaluation > Methods > Notation and mathematical foundations
plain- Asserted: passes — The authors put it forward as true.
- Checkable: passes — It can be checked against evidence.
- Load-bearing: fails — The paper’s conclusions may not depend on it.
- Based: passes — The paper gives a reason why it holds.
Probably not a substantial claim. The paper’s conclusions may not depend on it. It may state two separate claims as one.
A result the paper reports from its own data — it cites no other source for it, so there is none to check. The quote shows it is in the paper.
In the paper
“Like for the Use case A2, accuracy, F1 and MCC show average or low result scores (accuracy = 0.56, F1 score = 0.31, and MCC = +0.17), correctly informing you about the non-optimal performance of the prediction method (Additional file 3a).”
§ The advantages of the Matthews correlation coefficient (MCC) over F1 score and accuracy in binary classification evaluation > Results and discussion > Use cases
plain- Asserted: passes — The authors put it forward as true.
- Checkable: passes — It can be checked against evidence.
- Load-bearing: unclear — It is unclear whether the paper’s conclusions depend on it.
- Based: passes — The paper gives a reason why it holds.
It may state two separate claims as one.
The paper states this without a source or data behind it here, so there is nothing to check it against. The quote shows it is in the paper.
In the paper
“If M has only one non-zero entry, this means that all samples in the dataset belong to one class, and they are either all correctly (for TP≠0 or TN≠0) or incorrectly (for FP≠0 or FN≠0) classified. In this situations, MCC=1 for the former case and MCC=−1 for the latter case.”
§ The advantages of the Matthews correlation coefficient (MCC) over F1 score and accuracy in binary classification evaluation > Methods > Notation and mathematical foundations
plaindirectSingle case- Asserted: passes — The authors put it forward as true.
- Checkable: passes — It can be checked against evidence.
- Load-bearing: unclear — It is unclear whether the paper’s conclusions depend on it.
- Based: passes — The paper gives a reason why it holds.
It may state two separate claims as one.
The paper states this without a source or data behind it here, so there is nothing to check it against. The quote shows it is in the paper.
In the paper
“If the dataset is highly unbalanced, ni≈1, and thus the accuracy measure gives an unreliable estimation of the goodness of the classifier.”
§ The advantages of the Matthews correlation coefficient (MCC) over F1 score and accuracy in binary classification evaluation > Methods > Notation and mathematical foundations
plaindirect- Asserted: passes — The authors put it forward as true.
- Checkable: passes — It can be checked against evidence.
- Load-bearing: passes — The paper’s conclusions depend on it.
- Based: passes — The paper gives a reason why it holds.
It may state two separate claims as one.
A result the paper reports from its own data — it cites no other source for it, so there is none to check. The quote shows it is in the paper.
In the paper
“Checking only F1, one would read a good value (0.66 in the [0, 1] interval), and would be overall satisfied about the prediction (Additional file 2a).”
- Also stated in: § Use cases · hedged
“The Matthews correlation coefficient, instead, by showing a score close to random guessing (+0.07 in the [–1, +1] interval) would be able to inform that the machine learning method has been on the wrong track. Also, it is worth noticing that accuracy would provide with an informative result in this case (0.52 in the [0, 1] interval).”
§ The advantages of the Matthews correlation coefficient (MCC) over F1 score and accuracy in binary classification evaluation > Results and discussion > Use cases
hedged- Asserted: passes — The authors put it forward as true.
- Checkable: passes — It can be checked against evidence.
- Load-bearing: passes — The paper’s conclusions depend on it.
- Based: passes — The paper gives a reason why it holds.
It may state two separate claims as one. The quote only partly states this claim.
- Also stated in: § Use cases · hedged
A result the paper reports from its own data — it cites no other source for it, so there is none to check. The quote shows it is in the paper.
In the paper
“However, accuracy and of F1 showed high values in this case: accuracy = 0.90 and F1 score = 0.95, both close to the best possible value 1.00 in the [0, 1] interval (Fig. 2a).”
- Also stated in: § Use cases · hedged
“Instead, if one decided to take advantage of the Matthews correlation coefficient in the Use case A1, he/she would notice the resulting MCC = –0.03 (Fig. 2a).”
§ The advantages of the Matthews correlation coefficient (MCC) over F1 score and accuracy in binary classification evaluation > Results and discussion > Use cases
plainSingle case- Asserted: passes — The authors put it forward as true.
- Checkable: passes — It can be checked against evidence.
- Load-bearing: passes — The paper’s conclusions depend on it.
- Based: passes — The paper gives a reason why it holds.
It may state two separate claims as one. The quote only partly states this claim.
- Also stated in: § Use cases · hedged
A result the paper reports from its own data — it cites no other source for it, so there is none to check. The quote shows it is in the paper.
In the paper
“Similar to the Use case A2 and B2, all three statistical scores generated low results that reflect the mediocre quality of the prediction: F1 score = 0.17 and accuracy = 0.10 in the [0, 1] interval, and MCC = −0.19 in the [–1, +1] interval (Additional file 4a).”
§ The advantages of the Matthews correlation coefficient (MCC) over F1 score and accuracy in binary classification evaluation > Results and discussion > Use cases
plainSingle case- Asserted: passes — The authors put it forward as true.
- Checkable: passes — It can be checked against evidence.
- Load-bearing: unclear — It is unclear whether the paper’s conclusions depend on it.
- Based: passes — The paper gives a reason why it holds.
It may state two separate claims as one.
The paper states this without a source or data behind it here, so there is nothing to check it against. The quote shows it is in the paper.
In the paper
“On the other hand, for a given value MCC=μ, the F1 score can range in [0,μ+1] if μ≤0 and in [μ,1] if μ>0, so that the width of the range is 1−|μ|, that is, it depends on the MCC value μ.”
§ The advantages of the Matthews correlation coefficient (MCC) over F1 score and accuracy in binary classification evaluation > Methods > Relationship between measures
plaincorrelational- Asserted: passes — The authors put it forward as true.
- Checkable: passes — It can be checked against evidence.
- Load-bearing: passes — The paper’s conclusions depend on it.
- Based: passes — The paper gives a reason why it holds.
It may state two separate claims as one.
The paper states this without a source or data behind it here, so there is nothing to check it against. The quote shows it is in the paper.
In the paper
“The two measures are reasonably concordant, but the scatterplot cloud is wide, implying that for each value of F1 score there is a corresponding range of values of MCC and vice versa, although with different width.”
§ The advantages of the Matthews correlation coefficient (MCC) over F1 score and accuracy in binary classification evaluation > Methods > Relationship between measures
plaincorrelational- Asserted: passes — The authors put it forward as true.
- Checkable: passes — It can be checked against evidence.
- Load-bearing: passes — The paper’s conclusions depend on it.
- Based: passes — The paper gives a reason why it holds.
It may state two separate claims as one.
The paper states this without a source or data behind it here, so there is nothing to check it against. The quote shows it is in the paper.
In the paper
“Overall, accuracy, F1, and MCC show reliable concordant scores for predictions that correctly classify both positives and negatives (having therefore many TP and TN), and for predictions that incorrectly classify both positives and negatives (having therefore few TP and TN); however, these measures show discordant behaviors when the prediction performs well just with one of the two binary classes.”
§ The advantages of the Matthews correlation coefficient (MCC) over F1 score and accuracy in binary classification evaluation > Methods > Relationship between measures
plaincorrelational- Asserted: passes — The authors put it forward as true.
- Checkable: passes — It can be checked against evidence.
- Load-bearing: passes — The paper’s conclusions depend on it.
- Based: passes — The paper gives a reason why it holds.
It may state two separate claims as one.
The paper states this without a source or data behind it here, so there is nothing to check it against. The quote shows it is in the paper.
In the paper
“First, F1 varies for class swapping, while MCC is invariant if the positive class is renamed negative and vice versa.”
§ The advantages of the Matthews correlation coefficient (MCC) over F1 score and accuracy in binary classification evaluation > Background
plaindirect- Asserted: passes — The authors put it forward as true.
- Checkable: passes — It can be checked against evidence.
- Load-bearing: passes — The paper’s conclusions depend on it.
- Based: passes — The paper gives a reason why it holds.
It may state two separate claims as one.
A result the paper reports from its own data — it cites no other source for it, so there is none to check. The quote shows it is in the paper.
In the paper
“Interestingly, the correlation grows with N, but the increments are limited.”
§ The advantages of the Matthews correlation coefficient (MCC) over F1 score and accuracy in binary classification evaluation > Methods > Relationship between measures
plaincorrelational- Asserted: passes — The authors put it forward as true.
- Checkable: passes — It can be checked against evidence.
- Load-bearing: fails — The paper’s conclusions may not depend on it.
- Based: passes — The paper gives a reason why it holds.
Probably not a substantial claim. The paper’s conclusions may not depend on it. It may state two separate claims as one.
The paper states this without a source or data behind it here, so there is nothing to check it against. The quote shows it is in the paper.
In the paper
“With these positions MCC is now defined for all confusion matrices M. As a consequences, MCC=0 for the trivial majority classifier, and 0 is also the expected value for the coin tossing classifier.”
§ The advantages of the Matthews correlation coefficient (MCC) over F1 score and accuracy in binary classification evaluation > Methods > Notation and mathematical foundations
plainn = 4- Asserted: passes — The authors put it forward as true.
- Checkable: passes — It can be checked against evidence.
- Load-bearing: passes — The paper’s conclusions depend on it.
- Based: passes — The paper gives a reason why it holds.
Probably not a substantial claim. It may state two separate claims as one.
A result the paper reports from its own data — it cites no other source for it, so there is none to check. The quote shows it is in the paper.
In the paper
“MCC and accuracy resulted strongly correlated, while the Pearson coefficient is less than 0.8 for the correlation of F1 with the other two measures (Table 3).”
§ The advantages of the Matthews correlation coefficient (MCC) over F1 score and accuracy in binary classification evaluation > Methods > Relationship between measures
boostedcorrelational- Asserted: passes — The authors put it forward as true.
- Checkable: passes — It can be checked against evidence.
- Load-bearing: passes — The paper’s conclusions depend on it.
- Based: passes — The paper gives a reason why it holds.
It may state two separate claims as one.
The paper states this without a source or data behind it here, so there is nothing to check it against. The quote shows it is in the paper.
In the paper
“In fact, for any value F1=ϕ, the MCC varies approximately between [ϕ−1,ϕ], so that the width of the variability range is 1, independent from the value of ϕ.”
§ The advantages of the Matthews correlation coefficient (MCC) over F1 score and accuracy in binary classification evaluation > Methods > Relationship between measures
hedgedcorrelational- Asserted: passes — The authors put it forward as true.
- Checkable: passes — It can be checked against evidence.
- Load-bearing: passes — The paper’s conclusions depend on it.
- Based: passes — The paper gives a reason why it holds.
It may state two separate claims as one.
None of the sources cited for this claim have been checked yet.
In the paper
“The micro/macro averaged F1 is invariant for class swapping and its behaviour is more similar to MCC.”
§ The advantages of the Matthews correlation coefficient (MCC) over F1 score and accuracy in binary classification evaluation > Background
plaincorrelational- Asserted: passes — The authors put it forward as true.
- Checkable: passes — It can be checked against evidence.
- Load-bearing: unclear — It is unclear whether the paper’s conclusions depend on it.
- Based: passes — The paper gives a reason why it holds.
It may state two separate claims as one.
A result the paper reports from its own data — it cites no other source for it, so there is none to check. The quote shows it is in the paper.
In the paper
“Here, accuracy showed a high value: 0.90 in the [0, 1] interval.”
§ The advantages of the Matthews correlation coefficient (MCC) over F1 score and accuracy in binary classification evaluation > Results and discussion > Use cases
plain- Asserted: passes — The authors put it forward as true.
- Checkable: passes — It can be checked against evidence.
- Load-bearing: fails — The paper’s conclusions may not depend on it.
- Based: passes — The paper gives a reason why it holds.
Probably not a substantial claim. The paper’s conclusions may not depend on it.
A result the paper reports from its own data — it cites no other source for it, so there is none to check. The quote shows it is in the paper.
In the paper
“linear SVM is ranked forth in the MCC ranking and in the accuracy ranking, but ranked second in the F1 score ranking.”
§ The advantages of the Matthews correlation coefficient (MCC) over F1 score and accuracy in binary classification evaluation > Results and discussion > Genomics scenario: colon cancer gene expression
plain- Asserted: passes — The authors put it forward as true.
- Checkable: passes — It can be checked against evidence.
- Load-bearing: unclear — It is unclear whether the paper’s conclusions depend on it.
- Based: passes — The paper gives a reason why it holds.
It may state two separate claims as one.
A result the paper reports from its own data — it cites no other source for it, so there is none to check. The quote shows it is in the paper.
In the paper
“k-NN, that is the top performing method both in the F1 score ranking and in the accuracy ranking, instead, obtained an excellent score for recall (TP rate = 0.92) but just sufficient on the specificity (TN rate = 0.52).”
§ The advantages of the Matthews correlation coefficient (MCC) over F1 score and accuracy in binary classification evaluation > Results and discussion > Genomics scenario: colon cancer gene expression
plain- Asserted: passes — The authors put it forward as true.
- Checkable: passes — It can be checked against evidence.
- Load-bearing: passes — The paper’s conclusions depend on it.
- Based: passes — The paper gives a reason why it holds.
It may state two separate claims as one.
None of the sources cited for this claim have been checked yet.
In the paper
“However, ROC AUC presents several flaws [92], and it is sensitive to class imbalance [93].”
§ The advantages of the Matthews correlation coefficient (MCC) over F1 score and accuracy in binary classification evaluation > Background
What the sources say
- Not checked yetcites [92] Lobo JM, Jiménez-Valverde A, Real R. AUC: a misleading measure of the performance of predictive distribution models. Glob Ecol Biogeogr. 2008; 17(2):145–51. source
- Not checked yetcites [93] Hanczar B, Hua J, Sima C, Weinstein J, Bittner M, Dougherty ER. Small-sample precision of ROC-related estimates. Bioinformatics. 2010; 26(6):822–30. source
plaincorrelational- Asserted: passes — The authors put it forward as true.
- Checkable: passes — It can be checked against evidence.
- Load-bearing: passes — The paper’s conclusions depend on it.
- Based: passes — The paper gives a reason why it holds.
It may state two separate claims as one.
A conclusion the paper draws from its own results — it cites no other source for it, so there is none to check. The quote shows it is in the paper.
In the paper
“Once again, this score would hide the truth: the classification algorithm has performed poorly on the negative subset.”
§ The advantages of the Matthews correlation coefficient (MCC) over F1 score and accuracy in binary classification evaluation > Results and discussion > Use cases
hedgeddirect- Asserted: passes — The authors put it forward as true.
- Checkable: passes — It can be checked against evidence.
- Load-bearing: passes — The paper’s conclusions depend on it.
- Based: passes — The paper gives a reason why it holds.
It may state two separate claims as one. The quote only partly states this claim.
None of the sources cited for this claim have been checked yet.
In the paper
“The effectiveness of MCC has been shown in other scientific fields as well [43, 44].”
§ The advantages of the Matthews correlation coefficient (MCC) over F1 score and accuracy in binary classification evaluation > Background
What the sources say
- Not checked yetcites [43] Liu Y, Cheng J, Yan C, Wu X, Chen F. Research on the Matthews correlation coefficients metrics of personalized recommendation algorithm evaluation. Int J Hybrid Informa Technol. 2015; 8(1):163–72. source
- Not checked yetcites [44] Naulaerts S, Dang CC, Ballester PJ. Precision and recall oncology: combining multiple gene mutations for improved identification of drug-sensitive tumours. Oncotarget. 2017; 8(57):97025. source
plain- Asserted: passes — The authors put it forward as true.
- Checkable: passes — It can be checked against evidence.
- Load-bearing: fails — The paper’s conclusions may not depend on it.
- Based: passes — The paper gives a reason why it holds.
Probably not a substantial claim. The paper’s conclusions may not depend on it.
None of the sources cited for this claim have been checked yet.
In the paper
“Even if less common than the ROC curve, several scientists consider the PR curve more informative than the ROC curve, especially on imbalanced biological and medical datasets [48, 97, 98].”
§ The advantages of the Matthews correlation coefficient (MCC) over F1 score and accuracy in binary classification evaluation > Background
What the sources say
- Not checked yetcites [48] Saito T, Rehmsmeier M. The precision-recall plot is more informative than the ROC plot when evaluating binary classifiers on imbalanced datasets. PLoS ONE. 2015; 10(3):0118432. source
- Not checked yetcites [97] Chicco D. Ten quick tips for machine learning in computational biology. BioData Min. 2017; 10(35):1–17.
- Not checked yetcites [98] Ozenne B, Subtil F, Maucort-Boulch D. The precision–recall curve overcame the optimism of the receiver operating characteristic curve in rare diseases. J Clin Epidemiol. 2015; 68(8):855–9. source
plain- Asserted: passes — The authors put it forward as true.
- Checkable: passes — It can be checked against evidence.
- Load-bearing: fails — The paper’s conclusions may not depend on it.
- Based: passes — The paper gives a reason why it holds.
Probably not a substantial claim. The paper’s conclusions may not depend on it.
None of the sources cited for this claim have been checked yet.
In the paper
“MCC was re-proposed by Baldi and colleagues [39] in 2000 as a standard performance metric for machine learning with a natural extension to the multiclass case [40].”
§ The advantages of the Matthews correlation coefficient (MCC) over F1 score and accuracy in binary classification evaluation > Background
What the sources say
- Not checked yetcites [39] Baldi P, Brunak S, Chauvin Y, Andersen CA, Nielsen H. Assessing the accuracy of prediction algorithms for classification: an overview. Bioinformatics. 2000; 16(5):412–24. source
- Not checked yetcites [40] Gorodkin J. Comparing two K-category assignments by a K-category correlation coefficient. Comput Biol Chem. 2004; 28(5–6):367–74. source
plain- Asserted: passes — The authors put it forward as true.
- Checkable: passes — It can be checked against evidence.
- Load-bearing: fails — The paper’s conclusions may not depend on it.
- Based: passes — The paper gives a reason why it holds.
Probably not a substantial claim. The paper’s conclusions may not depend on it. It may state two separate claims as one.
None of the sources cited for this claim have been checked yet.
In the paper
“For example, when Whalen and colleagues released TargetFinder, a tool to predict enhancer-promoters interactions in genomics, they showed its results measured only by F1 score [13], making it impossible to detect the actual true positive rate and true negative rate of their tests [69].”
§ The advantages of the Matthews correlation coefficient (MCC) over F1 score and accuracy in binary classification evaluation > Background
What the sources say
- Not checked yetcites [13] Whalen S, Truty RM, Pollard KS. Enhancer–promoter interactions are encoded by complex genomic signatures on looping chromatin. Nat Genet. 2016; 48(5):488. source
- Not checked yetcites [69] Xi W, Beer MA. Local epigenomic state cannot discriminate interacting and non-interacting enhancer–promoter pairs with high accuracy. PLoS Comput Biol. 2018; 14(12):1006625. source
plaindirect- Asserted: passes — The authors put it forward as true.
- Checkable: passes — It can be checked against evidence.
- Load-bearing: fails — The paper’s conclusions may not depend on it.
- Based: passes — The paper gives a reason why it holds.
Probably not a substantial claim. The paper’s conclusions may not depend on it. It may state two separate claims as one.
In the paper
“Although being widely acknowledged as a reliable metric, there are situations - albeit extreme - where either MCC cannot be defined or it displays large fluctuations [45], due to imbalanced outcomes in the classification.”
§ The advantages of the Matthews correlation coefficient (MCC) over F1 score and accuracy in binary classification evaluation > Background
What the sources say
- Not checked yetcites [45] Brown JB. Classifiers and their metrics quantified. Mol Inform. 2018; 37:1700127. source
plaindirect- Asserted: passes — The authors put it forward as true.
- Checkable: passes — It can be checked against evidence.
- Load-bearing: fails — The paper’s conclusions may not depend on it.
- Based: passes — The paper gives a reason why it holds.
Probably not a substantial claim. The paper’s conclusions may not depend on it. It may state two separate claims as one.
In the paper
“An effective solution overcoming the class imbalance issue comes from the Matthews correlation coefficient (MCC), a special case of the ϕ phi coefficient [36].”
§ The advantages of the Matthews correlation coefficient (MCC) over F1 score and accuracy in binary classification evaluation > Background
What the sources say
- Not checked yetcites [36] Guilford JP. Psychometric Methods. New York City: McGraw-Hill; 1954.
plain- Asserted: passes — The authors put it forward as true.
- Checkable: passes — It can be checked against evidence.
- Load-bearing: fails — The paper’s conclusions may not depend on it.
- Based: passes — The paper gives a reason why it holds.
Probably not a substantial claim. The paper’s conclusions may not depend on it.
None of the sources cited for this claim have been checked yet.
In the paper
“for instance, the Food and Drug Administration (FDA) agency of the USA employed the MCC as the main evaluation measure in the MicroArray II / Sequencing Quality Control (MAQC/SEQC) projects [41, 42].”
§ The advantages of the Matthews correlation coefficient (MCC) over F1 score and accuracy in binary classification evaluation > Background
What the sources say
- Not checked yetcites [41] The MicroArray Quality Control (MAQC) Consortium. The MAQC-II Project: a comprehensive study of common practices for the development and validation of microarray-based predictive models. Nat Biotechnol. 2010; 28(8):827–38. source
- Not checked yetcites [42] The SEQC/MAQC-III Consortium. A comprehensive assessment of RNA-seq accuracy, reproducibility and information content by the Sequence Quality Control consortium. Nat Biotechnol. 2014; 32:903–14. source
plain- Asserted: passes — The authors put it forward as true.
- Checkable: passes — It can be checked against evidence.
- Load-bearing: fails — The paper’s conclusions may not depend on it.
- Based: passes — The paper gives a reason why it holds.
Probably not a substantial claim. The paper’s conclusions may not depend on it.
In the paper
“However, this procedure is biased [65], and it is still far from being accepted as a standard practice by the community.”
§ The advantages of the Matthews correlation coefficient (MCC) over F1 score and accuracy in binary classification evaluation > Background
What the sources say
- Not checked yetcites [65] Van Asch V. Macro-and micro-averaged evaluation measures. Technical report. 2013:1–27.
plain- Asserted: passes — The authors put it forward as true.
- Checkable: passes — It can be checked against evidence.
- Load-bearing: unclear — It is unclear whether the paper’s conclusions depend on it.
- Based: passes — The paper gives a reason why it holds.
It may state two separate claims as one.
A conclusion the paper draws from its own results — it cites no other source for it, so there is none to check. The quote shows it is in the paper.
In the paper
“In this case, the algorithm showed its ability to predict the positive data instances (90 sick patients out of 91 were correctly predicted), but it also displayed its lack of talent in identifying healthy controls (only 1 healthy individual out of 9 was correctly recognized) (Fig. 2b). Therefore, the overall performance should be judged poor.”
§ The advantages of the Matthews correlation coefficient (MCC) over F1 score and accuracy in binary classification evaluation > Results and discussion > Use cases
plaindirectSingle case- Asserted: passes — The authors put it forward as true.
- Checkable: passes — It can be checked against evidence.
- Load-bearing: passes — The paper’s conclusions depend on it.
- Based: passes — The paper gives a reason why it holds.
It may state two separate claims as one.
A conclusion the paper draws from its own results — it cites no other source for it, so there is none to check. The quote shows it is in the paper.
In the paper
“Similar to the Use case A1 and B1, the method was able to correctly identify multiple negative data instances (88 healthy patients out of 89), but unable to correctly predict most of sick patients (only 2 true positives out of 11 possible elements).”
§ The advantages of the Matthews correlation coefficient (MCC) over F1 score and accuracy in binary classification evaluation > Results and discussion > Use cases
plainn = 88- Asserted: passes — The authors put it forward as true.
- Checkable: passes — It can be checked against evidence.
- Load-bearing: passes — The paper’s conclusions depend on it.
- Based: passes — The paper gives a reason why it holds.
It may state two separate claims as one.
In the paper
“Originally developed by Matthews in 1975 for comparison of chemical structures [38]”
§ The advantages of the Matthews correlation coefficient (MCC) over F1 score and accuracy in binary classification evaluation > Background
What the sources say
- Not checked yetcites [38] Matthews BW. Comparison of the predicted and observed secondary structure of T4 phage lysozyme. Biochim Biophys Acta (BBA) Protein Struct. 1975; 405(2):442–51. source
plain- Asserted: passes — The authors put it forward as true.
- Checkable: passes — It can be checked against evidence.
- Load-bearing: fails — The paper’s conclusions may not depend on it.
- Based: passes — The paper gives a reason why it holds.
Probably not a substantial claim. The paper’s conclusions may not depend on it.
None of the sources cited for this claim have been checked yet.
In the paper
“Despite its popularity, in the learning context there are a number of issues causing the kappa measure to produce unreliable results (for instance, its high sensitivity to the distribution of the marginal totals [73–75])”
§ The advantages of the Matthews correlation coefficient (MCC) over F1 score and accuracy in binary classification evaluation > Background
What the sources say
- Not checked yetcites [73] Flight L, Julious SA. The disagreeable behaviour of the kappa statistic. Pharm Stat. 2015; 14:74–8. source
- Not checked yetcites [74] Powers DMW. The problem with Kappa. In: Proceedings of EACL 2012 – the 13th Conference of the European Chapter of the Association for Computational Linguistics. Avignon: ACL: 2012. p. 345–55.
- Not checked yetcites [75] Delgado R, Tibau X-A. Why Cohen’s Kappa should be avoided as performance measure in classification. PloS ONE. 2019; 14(9):0222916.
plaindirect- Asserted: passes — The authors put it forward as true.
- Checkable: passes — It can be checked against evidence.
- Load-bearing: passes — The paper’s conclusions depend on it.
- Based: passes — The paper gives a reason why it holds.
It may state two separate claims as one.
A conclusion the paper draws from its own results — it cites no other source for it, so there is none to check. The quote shows it is in the paper.
In the paper
“In fact, when a prediction displays many true positives but few true negatives (or many true negatives but few true positives) we will show that F1 and accuracy can provide misleading information, while MCC always generates results that reflect the overall prediction issues.”
§ The advantages of the Matthews correlation coefficient (MCC) over F1 score and accuracy in binary classification evaluation > Methods > Relationship between measures
plaindirect- Asserted: passes — The authors put it forward as true.
- Checkable: passes — It can be checked against evidence.
- Load-bearing: passes — The paper’s conclusions depend on it.
- Based: passes — The paper gives a reason why it holds.
It may state two separate claims as one.
A conclusion the paper draws from its own results — it cites no other source for it, so there is none to check. The quote shows it is in the paper.
In the paper
“These results show that, while accuracy and F1 score often generate high scores that do not inform the user about ongoing prediction issues, the MCC is a robust, useful, reliable, truthful statistical measure able to correctly reflect the deficiency of any prediction in any dataset.”
§ The advantages of the Matthews correlation coefficient (MCC) over F1 score and accuracy in binary classification evaluation > Results and discussion > Use cases
boosteddirectn = 6- Asserted: passes — The authors put it forward as true.
- Checkable: passes — It can be checked against evidence.
- Load-bearing: passes — The paper’s conclusions depend on it.
- Based: passes — The paper gives a reason why it holds.
It may state two separate claims as one. The quote only partly states this claim.
A conclusion the paper draws from its own results — it cites no other source for it, so there is none to check. The quote shows it is in the paper.
In the paper
“Here accuracy again generated overoptimistic, misleading, and inflated high results”
§ The advantages of the Matthews correlation coefficient (MCC) over F1 score and accuracy in binary classification evaluation > Results and discussion > Use cases
plaindirectSingle case- Asserted: passes — The authors put it forward as true.
- Checkable: passes — It can be checked against evidence.
- Load-bearing: passes — The paper’s conclusions depend on it.
- Based: passes — The paper gives a reason why it holds.
It may state two separate claims as one.
A conclusion the paper draws from its own results — it cites no other source for it, so there is none to check. The quote shows it is in the paper.
In the paper
“The F1 score ranking and the accuracy ranking, in conclusion, are hiding this important flaw of the top classifier: k-NN was unable top correctly predict a high percentage of patients.”
§ The advantages of the Matthews correlation coefficient (MCC) over F1 score and accuracy in binary classification evaluation > Results and discussion > Genomics scenario: colon cancer gene expression
boosteddirect- Asserted: passes — The authors put it forward as true.
- Checkable: passes — It can be checked against evidence.
- Load-bearing: passes — The paper’s conclusions depend on it.
- Based: passes — The paper gives a reason why it holds.
It may state two separate claims as one.
A conclusion the paper draws from its own results — it cites no other source for it, so there is none to check. The quote shows it is in the paper.
In the paper
“There, accuracy and F1 generated overoptimistic and inflated results”
§ The advantages of the Matthews correlation coefficient (MCC) over F1 score and accuracy in binary classification evaluation > Results and discussion > Use cases
plaindirect- Asserted: passes — The authors put it forward as true.
- Checkable: passes — It can be checked against evidence.
- Load-bearing: passes — The paper’s conclusions depend on it.
- Based: passes — The paper gives a reason why it holds.
It may state two separate claims as one.
A conclusion the paper draws from its own results — it cites no other source for it, so there is none to check. The quote shows it is in the paper.
In the paper
“Accuracy and F1 score, although popular, can generate misleading results on imbalanced datasets, because they fail to consider the ratio between positive and negative elements.”
- Also stated in: § Conclusions · plain
“F1 and accuracy, instead, generate reliable results only when applied to balanced datasets, and produce misleading results when applied to imbalanced cases.”
§ The advantages of the Matthews correlation coefficient (MCC) over F1 score and accuracy in binary classification evaluation > Conclusions
plaindirect- Asserted: passes — The authors put it forward as true.
- Checkable: passes — It can be checked against evidence.
- Load-bearing: passes — The paper’s conclusions depend on it.
- Based: passes — The paper gives a reason why it holds.
It may state two separate claims as one.
- Also stated in: § Conclusions · plain
A conclusion the paper draws from its own results — it cites no other source for it, so there is none to check. The quote shows it is in the paper.
In the paper
“With its low value (MCC = +0.29), the MCC informs the readers about the poor general outcome of the radial SVM, while the accuracy and F1 score show misleading values.”
§ The advantages of the Matthews correlation coefficient (MCC) over F1 score and accuracy in binary classification evaluation > Results and discussion > Genomics scenario: colon cancer gene expression
plaindirect- Asserted: passes — The authors put it forward as true.
- Checkable: passes — It can be checked against evidence.
- Load-bearing: passes — The paper’s conclusions depend on it.
- Based: passes — The paper gives a reason why it holds.
It may state two separate claims as one.
In the paper
“The dataset contains 2,000 gene probsets for 62 patients, of which 22 are healthy controls and 40 have colon cancer (35.48% negatives and 64.52% positives) [106].”
§ The advantages of the Matthews correlation coefficient (MCC) over F1 score and accuracy in binary classification evaluation > Results and discussion > Genomics scenario: colon cancer gene expression
What the sources say
- Not checked yetcites [106] Alon U, Barkai N, Notterman DA, Gish K, Ybarra S, Mack D, Levine AJ. Data pertaining to the article ‘Broad patterns of gene expression revealed by clustering of tumor and normal colon tissues probed by oligonucleotide arrays’. 2000. http://genomics-pubs.princeton.edu/oncology/affydata/index.html. Accessed 10 Dec 2019.
plainn = 62- Asserted: passes — The authors put it forward as true.
- Checkable: passes — It can be checked against evidence.
- Load-bearing: fails — The paper’s conclusions may not depend on it.
- Based: passes — The paper gives a reason why it holds.
Probably not a substantial claim. The paper’s conclusions may not depend on it.
The paper relies on this without support.
Accuracy and F1 score are the most common metrics used for binary classification in machine learning.
“We decided to focus on accuracy and F1 score because they are the most common metrics used for binary classification in machine learning.”
The paper relies on this without support.
The synthetic use cases are realistic representations of binary classification scenarios.
“here we describe some synthetic, realistic scenarios where MCC results are more informative and truthful than the other two measures analyzed.”
The paper relies on this without support.
Accuracy and F1 score are more commonly used in machine learning studies related to biomedical applications than other rates.
“because accuracy and F1 score are more commonly used in machine learning studies related to biomedical applications.”
Claims other papers make about this one
Each is checked against this paper’s own text: does it say what the citing paper says it does?
The cited source says what the claim attributes to it.
In the citing paper
“MCC is a more reliable metric, whereby a high score is assigned only if the prediction was correct for the four base categories (TP, FP, TN and FP), taking into account the size of P and N [85].”
From A Survey of Underwater Acoustic Data Classification Methods Using Deep Learning for Shoreline Surveillance (2022) · cites this paper as [85]
In the citing paper
“since it has been shown to present a balanced score when dealing with imbalanced data [11, 6] as is our case with fewer manipulated images.”
From BioFors: A Large Biomedical Image Forensics Dataset (2021) · cites this paper as [11]
In the citing paper
“(3) the absolute value of F1 changes by simply switching the outcome labels (ie, when 1 becomes 0 and 0 becomes 1).”
From Evaluation of performance measures in predictive artificial intelligence models to support medical decisions: overview and guidance (2025) · cites this paper as [77]
In the citing paper
“(2) F1 has no intuitive interpretation”
From Evaluation of performance measures in predictive artificial intelligence models to support medical decisions: overview and guidance (2025) · cites this paper as [77]
In the citing paper
“(1) F1 ignores true negatives”
From Evaluation of performance measures in predictive artificial intelligence models to support medical decisions: overview and guidance (2025) · cites this paper as [77]
In the citing paper
“F1 and MCC were introduced to address the challenges caused by class imbalance, where classification accuracy can be inflated by classifying all patients as low risk when the event is rare.”
From Evaluation of performance measures in predictive artificial intelligence models to support medical decisions: overview and guidance (2025) · cites this paper as [77]
Self-check
Percentages, sums and reported differences re-computed from the paper’s own numbers.
Each contradiction between two passages listed here was confirmed by an independent check.
Rated major: it would touch a result — a value a result rests on, reported and recomputed p-values on opposite sides of the significance level, two passages that conflict with no sign which is right, or a cited work retracted before this paper was published.
In the paper
§ The advantages of the Matthews correlation coefficient (MCC) over F1 score and accuracy in binary classification evaluation > Results and discussion > Use cases
“Here, accuracy again generated an overoptimistic inflated score”
§ The advantages of the Matthews correlation coefficient (MCC) over F1 score and accuracy in binary classification evaluation > Results and discussion > Use cases
“all three statistical scores generated low results that reflect the mediocre quality of the prediction: F1 score = 0.17 and accuracy = 0.10 in the [0, 1] interval”
Rated minor: it would not touch a result — a value no result rests on, a p-value that stays on the same side of the significance level, or a conflict that is clerical, resolved elsewhere in the paper, or outside its own findings.
In the paper
§ The advantages of the Matthews correlation coefficient (MCC) over F1 score and accuracy in binary classification evaluation > Results and discussion > Use cases
“the prediction technique failed in predicting negative elements, and therefore its confusion matrix showed a low percentage of true negatives”
§ The advantages of the Matthews correlation coefficient (MCC) over F1 score and accuracy in binary classification evaluation > Results and discussion > Use cases
“the method was able to correctly identify multiple negative data instances (88 healthy patients out of 89), but unable to correctly predict most of sick patients (only 2 true positives out of 11 possible elements)”
Rated minor: it would not touch a result — a value no result rests on, a p-value that stays on the same side of the significance level, or a conflict that is clerical, resolved elsewhere in the paper, or outside its own findings.
In the paper
§ The advantages of the Matthews correlation coefficient (MCC) over F1 score and accuracy in binary classification evaluation > Results and discussion > Use cases
“Even if accuracy showed an excessively high result score”
§ The advantages of the Matthews correlation coefficient (MCC) over F1 score and accuracy in binary classification evaluation > Results and discussion > Use cases
“all three statistical rates showed a low score which emphasized the deficiency in the prediction process (accuracy = 0.24, F1 score = 0.12, and MCC = −0.24)”
Rated minor: it would not touch a result — a value no result rests on, a p-value that stays on the same side of the significance level, or a conflict that is clerical, resolved elsewhere in the paper, or outside its own findings.
In the paper
§ The advantages of the Matthews correlation coefficient (MCC) over F1 score and accuracy in binary classification evaluation > Results and discussion > Genomics scenario: colon cancer gene expression
“the best classifier resulted being k-NN (F1 score = 0.87 and accuracy = 0.81)”
§ The advantages of the Matthews correlation coefficient (MCC) over F1 score and accuracy in binary classification evaluation > Results and discussion > Genomics scenario: colon cancer gene expression
“k-nearest neighbors | +0.48 | 0.87 | 0.80 | 0.92 | 0.52”
Rated minor: it would not touch a result — a value no result rests on, a p-value that stays on the same side of the significance level, or a conflict that is clerical, resolved elsewhere in the paper, or outside its own findings.
In the paper
§ The advantages of the Matthews correlation coefficient (MCC) over F1 score and accuracy in binary classification evaluation > Results and discussion > Use cases
“only 1 healthy individual out of 9 was correctly recognized”
§ The advantages of the Matthews correlation coefficient (MCC) over F1 score and accuracy in binary classification evaluation > Results and discussion > Use cases
“TP=90, FN=1, TN=0, FP=9”
Rated minor: it would not touch a result — a value no result rests on, a p-value that stays on the same side of the significance level, or a conflict that is clerical, resolved elsewhere in the paper, or outside its own findings.
In the paper
§ The advantages of the Matthews correlation coefficient (MCC) over F1 score and accuracy in binary classification evaluation > Results and discussion > Use cases
“Finally, in the last Use case C2 (positively imbalanced dataset)”
§ The advantages of the Matthews correlation coefficient (MCC) over F1 score and accuracy in binary classification evaluation > Results and discussion > Use cases
“Use case C2 Negatively imbalanced dataset | 11 | 89 | 2 | 9 | 88 | 1”
Rated minor: it would not touch a result — a value no result rests on, a p-value that stays on the same side of the significance level, or a conflict that is clerical, resolved elsewhere in the paper, or outside its own findings.
In the paper
§ The advantages of the Matthews correlation coefficient (MCC) over F1 score and accuracy in binary classification evaluation > Results and discussion > Use cases
“For the Use case A1 (negatively imbalanced dataset)”
§ The advantages of the Matthews correlation coefficient (MCC) over F1 score and accuracy in binary classification evaluation > Results and discussion > Use cases
“made of 9 healthy individuals (negatives =9%) and 91 sick patients (positives =91%)”
Rated minor: it would not touch a result — a value no result rests on, a p-value that stays on the same side of the significance level, or a conflict that is clerical, resolved elsewhere in the paper, or outside its own findings.
In the paper
§ The advantages of the Matthews correlation coefficient (MCC) over F1 score and accuracy in binary classification evaluation > Results and discussion > Use cases
“Also in the Use case C1 (positively imbalanced dataset)”
§ The advantages of the Matthews correlation coefficient (MCC) over F1 score and accuracy in binary classification evaluation > Results and discussion > Use cases
“90 healthy controls (negatives =90%) and 10 sick patients (positives =10%)”
Rated minor: it would not touch a result — a value no result rests on, a p-value that stays on the same side of the significance level, or a conflict that is clerical, resolved elsewhere in the paper, or outside its own findings.
In the paper
§ The advantages of the Matthews correlation coefficient (MCC) over F1 score and accuracy in binary classification evaluation > Results and discussion > Use cases
“only 5 sick patients out of 70”
§ The advantages of the Matthews correlation coefficient (MCC) over F1 score and accuracy in binary classification evaluation > Results and discussion > Use cases
“TP = 5, FN = 70, TN = 19, FP = 6”
Rated minor: it would not touch a result — a value no result rests on, a p-value that stays on the same side of the significance level, or a conflict that is clerical, resolved elsewhere in the paper, or outside its own findings.
In the paper
§ The advantages of the Matthews correlation coefficient (MCC) over F1 score and accuracy in binary classification evaluation > Results and discussion > Use cases
“the resulting MCC = –0.03”
§ The advantages of the Matthews correlation coefficient (MCC) over F1 score and accuracy in binary classification evaluation > Methods > Relationship between measures
“In red, the (−0.04, 0.95) point corresponding to use case A1”
Citations
Cites
Breiman, L. (2001) · Machine Learning · doi:10.1023/a:1010933404324 · Cited by 133,538
LeCun, Y., Bengio, Y., & Hinton, G. (2015) · Nature · doi:10.1038/nature14539 · Cited by 84,126
The Measurement of Observer Agreement for Categorical Data
Landis, J. R., & Koch, G. G. (1977) · Biometrics · doi:10.2307/2529310 · Cited by 81,148
XGBoost: A Scalable Tree Boosting System
Chen, T., & Guestrin, C. (2016) · Proceedings of the 22nd ACM SIGKDD International Conference on Knowledge Discovery and Data Mining · doi:10.1145/2939672.2939785 · Cited by 54,569
A Coefficient of Agreement for Nominal Scales
Cohen, J. (1960) · Educational and Psychological Measurement · doi:10.1177/001316446002000104 · Cited by 42,398
An introduction to ROC analysis
Fawcett, T. (2006) · Pattern Recognition Letters · doi:10.1016/j.patrec.2005.10.010 · Cited by 21,879
The meaning and use of the area under a receiver operating characteristic (ROC) curve.
Hanley, J. A., & McNeil, B. J. (1982) · Radiology · doi:10.1148/radiology.143.1.7063747 · Cited by 21,856
Interrater reliability: The kappa statistic
McHugh, M. L. (2012) · Biochemia Medica · doi:10.11613/bm.2012.031 · Cited by 19,877
Measures of the Amount of Ecologic Association Between Species
Dice, L. R. (1945) · Ecology · doi:10.2307/1932409 · Cited by 12,187
Statistical Comparisons of Classifiers over Multiple Data Sets
Demšar, J. (2006) · doi:10.5555/1248547.1248548 · Cited by 12,051
Research works printed but not linked: 7
- Akosa JS. Predictive accuracy: a misleading performance measure for highly imbalanced data. In: Proceedings of the SAS Global Forum 2017 Conference. Cary, North Carolina: SAS Institute Inc.: 2017. p. 942–2017.
- Guilford JP. Psychometric Methods. New York City: McGraw-Hill; 1954.
- van Rijsbergen CJ, Joost C. Information Retrieval. New York City: Butterworths; 1979.
- Sasaki Y. The truth of the F-measure. Teach Tutor Mater. 2007; 1(5):1–5.
- Dubey A, Tarar S. Evaluation of approximate rank-order clustering using Matthews correlation coefficient. Int J Eng Adv Technol. 2018; 8(2):106–13.
- Suresh Babu N. Various performance measures in binary classification – An overview of ROC study. Int J Innov Sci Eng Technol. 2015; 2(9):596–605.
- Ferri C, Hernández-Orallo J, Flach PA. A coherent interpretation of AUC as a measure of aggregated classification performance. In: Proceedings of ICML 2011 – the 28th International Conference on Machine Learning. Norristown: Omnipress: 2011. p. 657–64.
Cited by
Sorted by citations
Chicco, D., Warrens, M. J., & Jurman, G. (2021) · PeerJ Computer Science · doi:10.7717/peerj-cs.623 · Cited by 5,380
“…of determination more reliable and trustworthy: similarly to the Matthews correlation coef fi cient (MCC) ( Matthews, 1975 ) in binary classi fi cation ( Chicco & Jurman, 2020 ; Chicco, Tötsch & Jurman, 2021 ; Tötsch & Hoffmann, 2021 ; Chicco, Starovoitov & Jurman, 2021 ; Chicco, Warrens &…”
Self-citationXiong, G., Wu, Z., Yi, J., Fu, L., Yang, Z., Hsieh, C., Yin, M., Zeng, X., Wu, C., Lü, A., et al. (2021) · Nucleic Acids Research · doi:10.1093/nar/gkab255 · Cited by 3,023
Fu, L., Shi, S., Yi, J., Wang, N., He, Y., Wu, Z., Peng, J., Deng, Y., Wang, W., Wu, C., et al. (2024) · Nucleic Acids Research · doi:10.1093/nar/gkae236 · Cited by 1,396
“…the performance of the models, R-square (R 2 ), root mean squared error (RMSE), and mean absolute error (MAE) were applied for regression tasks, while the area under the ROC curve (AUC), accuracy (ACC), and Matthews correlation coefficient (MCC) ( 39 ) were applied for classification tasks.”
Chicco, D., Tötsch, N., & Jurman, G. (2021) · BioData Mining · doi:10.1186/s13040-021-00244-z · Cited by 893
Self-citationDeepLoc 2.0: multi-label subcellular localization prediction using protein language models
Thumuluri, V., Armenteros, J. J. A., Johansen, A. R., Nielsen, H., & Winther, O. (2022) · Nucleic Acids Research · doi:10.1093/nar/gkac278 · Cited by 736
“A threshold for each output label is computed by maximizing Matthew’s Correlation Coefficient (MCC) (30) on the training data.”
Influential
Metadata
- Authors
- Chicco, D., & Jurman, G.
- Affiliations
- Krembil Research Institute (CA)
- Fondazione Bruno Kessler (IT)
- Corresponding author
- Chicco, Davide
- Venue
- BMC Genomics
- Published
- 2020-01-02
- Volume
- 21
- Issue
- 1
- Pages
- 6-6
- ISSN
- 1471-2164 (ISSN-L)
- PMC
- PMC6941312
- OpenAlex
- W2999309192
- Semantic Scholar
- 44858b662822d291a5e1e9e3501ad19a9f1572c2
- Cited by
- 6,143
- References
- 104
- Citations by year
- 2026: 1118 · 2025: 1152 · 2024: 1060 · 2023: 1032 · 2022: 883 · 2021: 682 · 2020: 211
- FWCI
- 276.55
- Type
- journal article
- Language
- en
- Open access
- gold
- doi.org
- Locations
- BMC Genomics (publishedVersion, cc-by)
- Europe PMC (PubMed Central) (publishedVersion, cc-by)
- PubMed Central (publishedVersion, cc-by)
- PubMed (publishedVersion)
- BOA (University of Milano-Bicocca) (submittedVersion, cc-by)
- DOAJ (DOAJ: Directory of Open Access Journals) (submittedVersion)
- Iris (University of Trento) (submittedVersion)
- Funders
- University of Toronto
- Topics
- Physical Sciences › Computer Science › Artificial Intelligence › Imbalanced Data Classification Techniques
- Physical Sciences › Computer Science › Artificial Intelligence › Machine Learning and Data Classification
- Physical Sciences › Mathematics › Statistics and Probability › Statistical Methods in Epidemiology
- Keywords
- Matthews correlation coefficient, F1 score, accuracy, confusion matrix, class imbalance, classification metrics
- MeSH terms
- Machine Learning, Correlation of Data, Algorithms, Data Interpretation, Statistical, Computational Biology
About these checks
Registry, retraction, Cites and statistics results are computed, not judged, with one exception: a printed reference that no index lists is read once by a model before it counts as a citation error. Claims are extracted by a model and kept only when their quote appears verbatim in the text; each cited source is then checked, with a model’s help, for whether it says what the claim relies on. Those verdicts can be wrong — read the claim’s quote and the cited source before relying on one.
A language model drew the claims from the paper on 2026-10-09, under version 3 of the claim definition (model deepseek-v4.1-flash, prompt extract-v3).
A second model labelled each claim on 2026-10-09 (model jev-1.13-20260917, definition revision gold-guideline-v0.2).
Statistics and arithmetic are recomputed, not judged.
Confidence bands are shown only for fields calibrated on our annotated test set. None is calibrated yet, so no band is shown.
What counts as a claim ›How we measure confidence ›How we check this ›
Are you an author, or do you see a problem with this page? Request a review
