

The DOI matches its Crossref record; 2 of the 2 references it cites were found in a registry or an index.
Optimizations for identifying reference genes in bone and cartilage bioengineering
Open accessPublished version of a preprint
Abstract
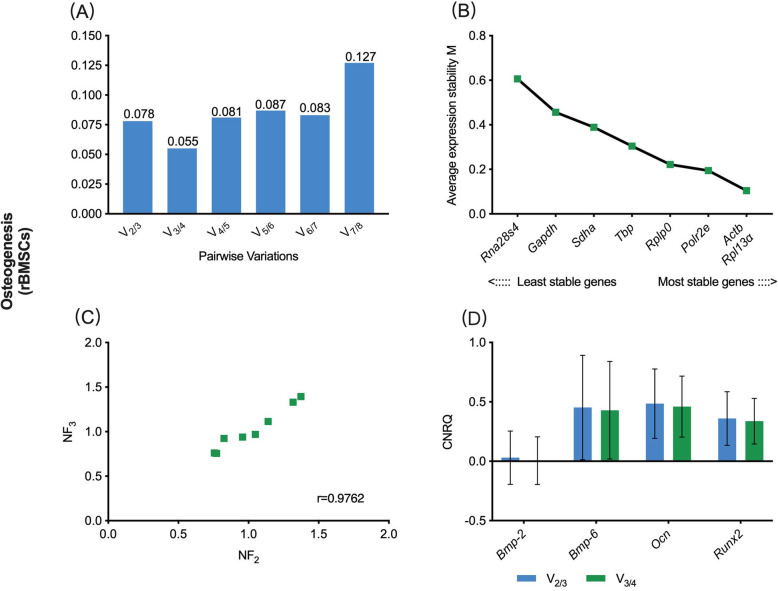
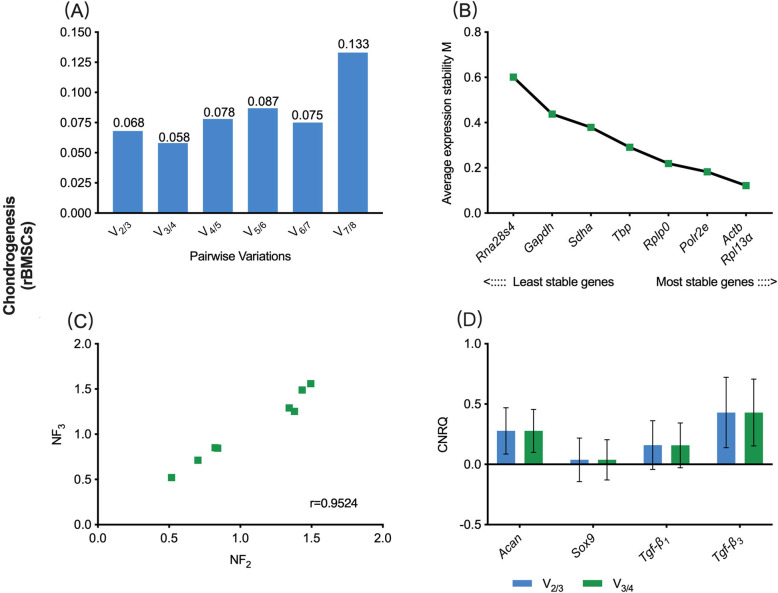
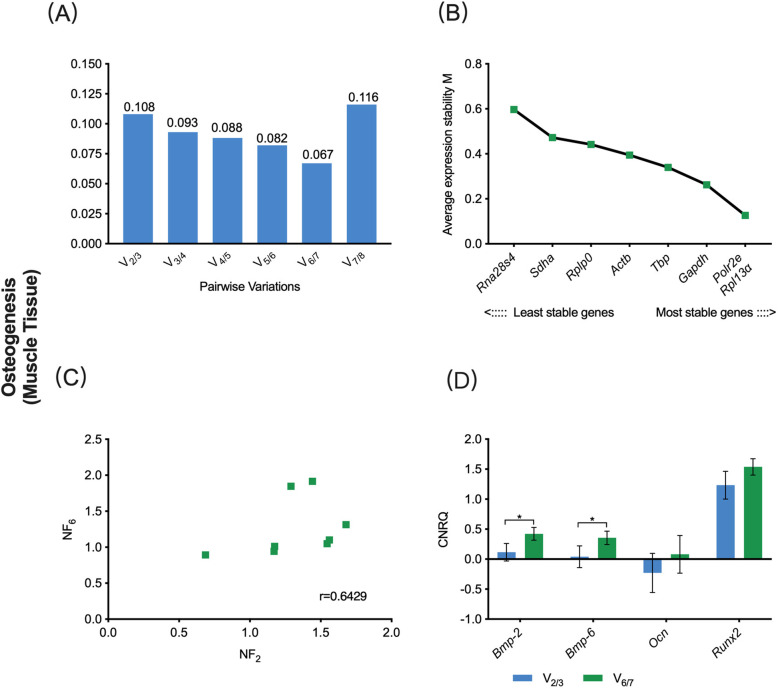
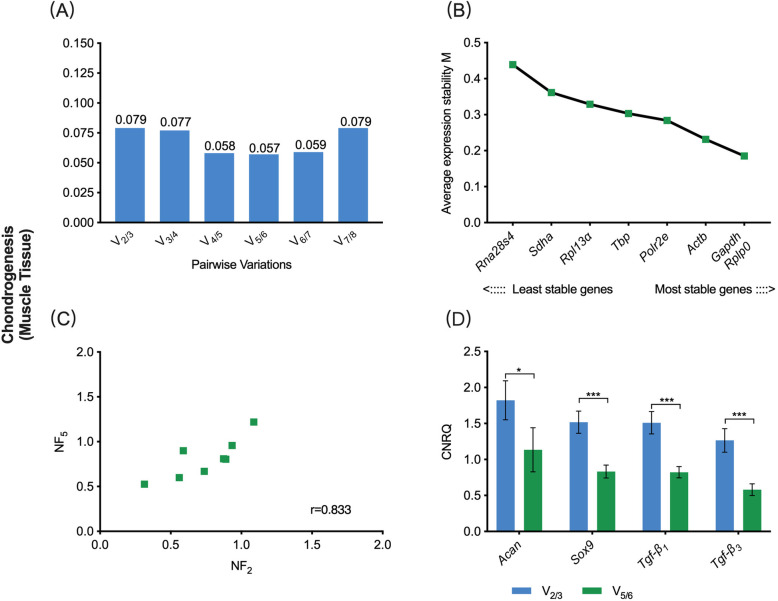
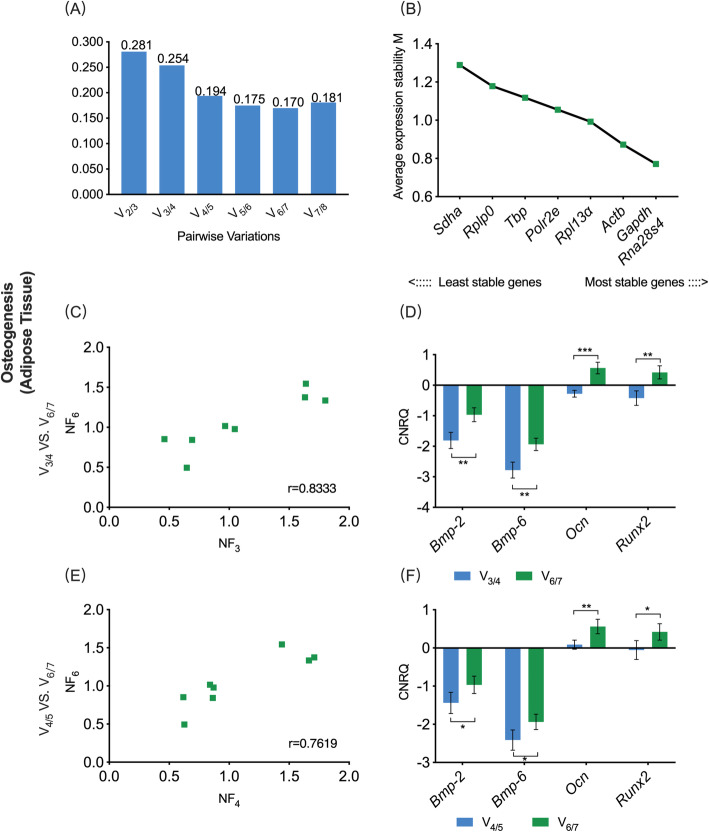
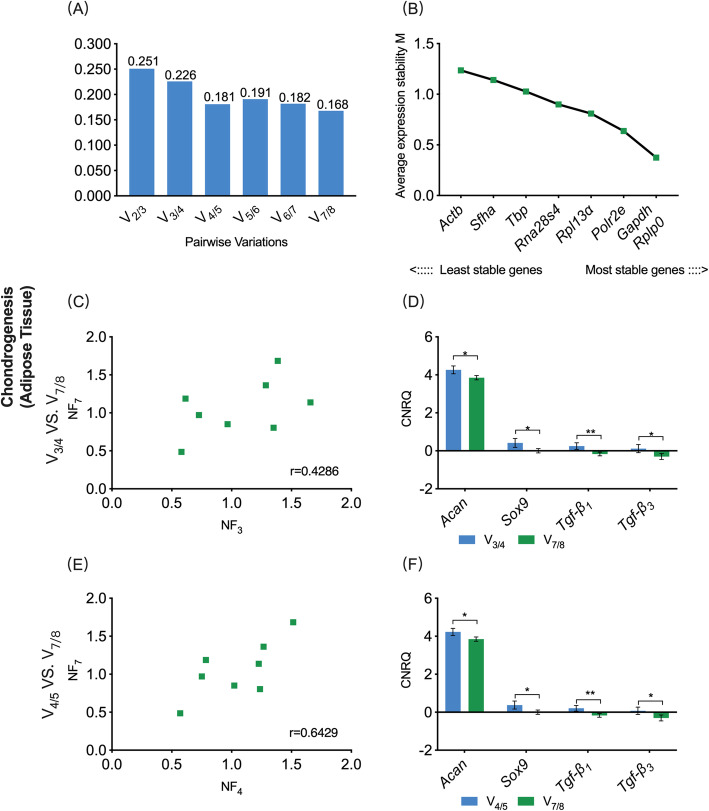
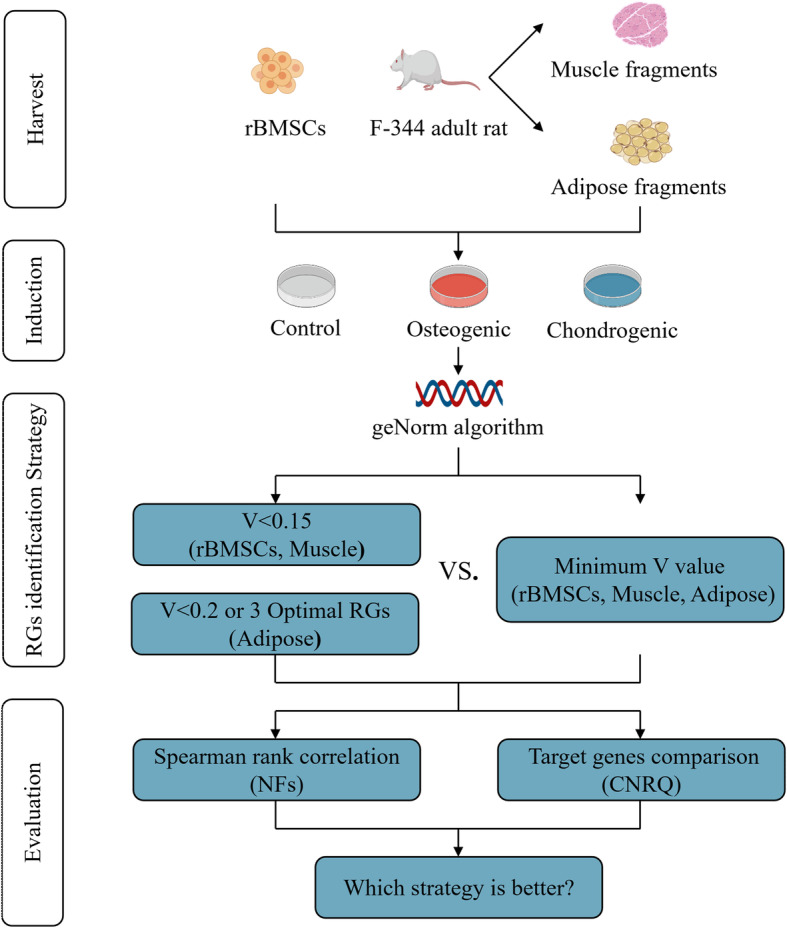
Background: Reverse transcription quantitative real-time polymerase chain reaction (RT-qPCR) remains one of the best-established techniques to assess gene expression patterns. However, appropriate reference gene(s) selection remains a critical and challenging subject in which inappropriate reference gene selction can distort results leading to false interpretations. To date, mixed opinions still exist in how to choose the most optimal reference gene sets in accodrance to the Minimum Information for Publication of Quantitative Real-Time PCR Experiments (MIQE) guideline. Therefore, the purpose of this study was to investigate which schemes were the most feasible for the identification of reference genes in a bone and cartilage bioengineering experimental setting. In this study, rat bone mesenchymal stem cells (rBMSCs), skeletal muscle tissue and adipose tissue were utilized, undergoing either chondrogenic or osteogenic induction, to investigate the optimal reference gene set identification scheme that would subsequently ensure stable and accurate interpretation of gene expression in bone and cartilage bioengineering. Results: The stability and pairwise variance of eight candidate reference genes were analyzed using geNorm. The V 0.15 - vs. V min -based normalization scheme in rBMSCs had no significant effect on the eventual normalization of target genes. In terms of the muscle tissue, the results of the correlation of NF values between the V 0.15 and V min schemes and the variance of target genes expression levels generated by these two schemes showed that different schemes do indeed have a significant effect on the eventual normalization of target genes. Three selection schemes were adopted in terms of the adipose tissue, including the three optimal reference genes (Opt 3 ), V 0.20 and V min schemes, and the analysis of NF values with eventual normalization of target genes showed that the different selection schemes also have a significant effect on the eventual normalization of target genes. Conclusions: Based on these results, the proposed cut-off value of Vn/n + 1 under 0.15, according to the geNorm algorithm, should be considered with caution. For cell only experiments, at least rBMSCs, a Vn/n + 1 under 0.15 is sufficient in RT-qPCR studies. However, when using certain tissue types such as skeletal muscle and adipose tissue the minimum Vn/n + 1 should be used instead as this provides a far superior mode of generating accurate gene expression results. We thus recommended that when the stability and variation of a candidate reference genes in a specific study is unclear the minimum Vn/n + 1 should always be used as this ensures the best and most accurate gene expression value is achieved during RT-qPCR assays.
Overview
The claims and statistics of this paper haven’t been checked yet.
Run the check — free, no account needed. It reads the open-access text and checks the sources it cites.
Integrity signals
Registry
Cites
Statistics
Figures
Verification
Claims the paper makes
The claims and statistics of this paper haven’t been checked yet.
Run the check — free, no account needed. It reads the open-access text and checks the sources it cites.
Self-check
Percentages, sums and reported differences re-computed from the paper’s own numbers.
The self-check needs the paper’s full text.
Citations
Cites
The MIQE guidelines: minimum information for publication of quantitative real-time PCR experiments
Bustin, S. A., Benes, V., Garson, J. A., Hellemans, J., Huggett, J., Kubista, M., Mueller, R., Nolan, T., Pfaffl, M. W., Shipley, G. L., et al. (2009) · Clinical Chemistry · doi:10.1373/clinchem.2008.112797 · Cited by 16,303
Global quantification of mammalian gene expression control
Schwanhäusser, B., Busse, D., Li, N., Dittmar, G., Schuchhardt, J., Wolf, J., Chen, W., & Selbach, M. (2011) · Nature · doi:10.1038/nature10098 · Cited by 6,566
Research works printed but not linked: 51
- Richardson SM, Hoyland JA, Mobasheri R, Csaki C, Shakibaei M, Mobasheri A. Mesenchymal stem cells in regenerative medicine: opportunities and challenges for articular cartilage and intervertebral disc tissue engineering. J Cell Physiol. 2010;222(1):23–32. https://doi.org/10.1002/jcp.21915. · DOI
- Bhosale AM, Kuiper JH, Johnson WE, Harrison PE, Richardson JB. Midterm to long-term longitudinal outcome of autologous chondrocyte implantation in the knee joint: a multilevel analysis. Am J Sports Med. 2009;37(Suppl 1):131S–8S. · DOI
- Richardson SM, Kalamegam G, Pushparaj PN, Matta C, Memic A, Khademhosseini A, Mobasheri R, Poletti FL, Hoyland JA, Mobasheri A. Mesenchymal stem cells in regenerative medicine: focus on articular cartilage and intervertebral disc regeneration. Methods. 2016;99:69–80. https://doi.org/10.1016/j.ymeth.2015.09.015. · DOI
- Taylor SC, Nadeau K, Abbasi M, Lachance C, Nguyen M, Fenrich J. The ultimate qPCR experiment: producing publication quality, reproducible data the first time. Trends Biotechnol. 2019;37(7):761–74. https://doi.org/10.1016/j.tibtech.2018.12.002. · DOI
- Bustin SA. Why the need for qPCR publication guidelines?--the case for MIQE. Methods. 2010;50(4):217–26. https://doi.org/10.1016/j.ymeth.2009.12.006. · DOI
- Vitorino Carvalho A, Courousse N, Crochet S, Coustham V. Identification of Reference Genes for Quantitative Gene Expression Studies in Three Tissues of Japanese Quail. Genes (Basel). 2019;10(3):197. https://doi.org/10.3390/genes10030197. · DOI
- Fang Z, Cui X. Design and validation issues in RNA-seq experiments. Brief Bioinform. 2011;12(3):280–7. https://doi.org/10.1093/bib/bbr004. · DOI
- Git A, Dvinge H, Salmon-Divon M, Osborne M, Kutter C, Hadfield J, Bertone P, Caldas C. Systematic comparison of microarray profiling, real-time PCR, and next-generation sequencing technologies for measuring differential microRNA expression. RNA. 2010;16(5):991–1006. https://doi.org/10.1261/rna.1947110. · DOI · Paper page
- Sanders R, Mason DJ, Foy CA, Huggett JF. Considerations for accurate gene expression measurement by reverse transcription quantitative PCR when analysing clinical samples. Anal Bioanal Chem. 2014;406(26):6471–83. https://doi.org/10.1007/s00216-014-7857-x. · DOI
- Sanders R, Bustin S, Huggett J, Mason D. Improving the standardization of mRNA measurement by RT-qPCR. Biomol Detect Quantif. 2018;15:13–7. https://doi.org/10.1016/j.bdq.2018.03.001. · DOI
- Zhang WX, Fan J, Ma J, Rao YS, Zhang L, Yan YE. Selection of Suitable Reference Genes for Quantitative Real-Time PCR Normalization in Three Types of Rat Adipose Tissue. Int J Mol Sci. 2016;17(6):968. https://doi.org/10.3390/ijms17060968. · DOI
- Murphy J, Bustin SA. Reliability of real-time reverse-transcription PCR in clinical diagnostics: gold standard or substandard? Expert Rev Mol Diagn. 2009;9(2):187–97. https://doi.org/10.1586/14737159.9.2.187. · DOI
- Andersen CL, Jensen JL, Orntoft TF. Normalization of real-time quantitative reverse transcription-PCR data: a model-based variance estimation approach to identify genes suited for normalization, applied to bladder and colon cancer data sets. Cancer Res. 2004;64(15):5245–50. https://doi.org/10.1158/0008-5472.CAN-04-0496. · DOI · Paper page
- Vandesompele J, De Preter K, Pattyn F, Poppe B, Van Roy N, De Paepe A, Speleman F. Accurate normalization of real-time quantitative RT-PCR data by geometric averaging of multiple internal control genes. Genome Biol. 2002;3(7):RESEARCH0034. · DOI · Paper page
- Pfaffl MW, Horgan GW, Dempfle L. Relative expression software tool (REST) for group-wise comparison and statistical analysis of relative expression results in real-time PCR. Nucleic Acids Res. 2002;30(9):e36–336. https://doi.org/10.1093/nar/30.9.e36. · DOI
- Guenin S, Mauriat M, Pelloux J, Van Wuytswinkel O, Bellini C, Gutierrez L. Normalization of qRT-PCR data: the necessity of adopting a systematic, experimental conditions-specific, validation of references. J Exp Bot. 2009;60(2):487–93. https://doi.org/10.1093/jxb/ern305. · DOI
- Farrokhi A, Eslaminejad MB, Nazarian H, Moradmand A, Samadian A, Akhlaghi A. Appropriate reference gene selection for real-time PCR data normalization during rat mesenchymal stem cell differentiation. Cell Mol Biol (Noisy-le-grand). 2012;58 Suppl:OL1660–70.
- Frampton GM, Fichtenholtz A, Otto GA, Wang K, Downing SR, He J, Schnall-Levin M, White J, Sanford EM, An P, Sun J, Juhn F, Brennan K, Iwanik K, Maillet A, Buell J, White E, Zhao M, Balasubramanian S, Terzic S, Richards T, Banning V, Garcia L, Mahoney K, Zwirko Z, Donahue A, Beltran H, Mosquera JM, Rubin MA, Dogan S, Hedvat CV, Berger MF, Pusztai L, Lechner M, Boshoff C, Jarosz M, Vietz C, Parker A, Miller VA, Ross JS, Curran J, Cronin MT, Stephens PJ, Lipson D, Yelensky R. Development and validation of a clinical cancer genomic profiling test based on massively parallel DNA sequencing. Nat Biotechnol. 2013;31(11):1023–31. https://doi.org/10.1038/nbt.2696. · DOI · Paper page
- D'Haene B, Vandesompele J, Hellemans J. Accurate and objective copy number profiling using real-time quantitative PCR. Methods. 2010;50(4):262–70. https://doi.org/10.1016/j.ymeth.2009.12.007. · DOI
- Pombo-Suarez M, Calaza M, Gomez-Reino JJ, Gonzalez A. Reference genes for normalization of gene expression studies in human osteoarthritic articular cartilage. BMC Mol Biol. 2008;9(1):17. https://doi.org/10.1186/1471-2199-9-17. · DOI
- Schulze F, Malhan D, El Khassawna T, Heiss C, Seckinger A, Hose D, Rosen-Wolff A. A tissue-based approach to selection of reference genes for quantitative real-time PCR in a sheep osteoporosis model. BMC Genomics. 2017;18(1):975. https://doi.org/10.1186/s12864-017-4356-4. · DOI
- He T, Huang Y, Chak JC, Klar RM. Recommendations for improving accuracy of gene expression data in bone and cartilage tissue engineering. Sci Rep. 2018;8(1):14874. https://doi.org/10.1038/s41598-018-33242-z. · DOI
- Okamura K, Inagaki Y, Matsui TK, Matsubayashi M, Komeda T, Ogawa M, Mori E, Tanaka Y. RT-qPCR analyses on the osteogenic differentiation from human iPS cells: an investigation of reference genes. Sci Rep. 2020;10(1):11748. https://doi.org/10.1038/s41598-020-68752-2. · DOI
- Ayers D, Clements DN, Salway F, Day PJ. Expression stability of commonly used reference genes in canine articular connective tissues. BMC Vet Res. 2007;3(1):7. https://doi.org/10.1186/1746-6148-3-7. · DOI
- Hosseini A, Sauerwein H, Mielenz M. Putative reference genes for gene expression studies in propionate and beta-hydroxybutyrate treated bovine adipose tissue explants. J Anim Physiol Anim Nutr (Berl). 2010;94(5):e178–84. https://doi.org/10.1111/j.1439-0396.2010.01002.x. · DOI
- An Y, Reimers K, Allmeling C, Liu J, Lazaridis A, Vogt PM. Validation of differential gene expression in muscle engineered from rat groin adipose tissue by quantitative real-time PCR. Biochem Biophys Res Commun. 2012;421(4):736–42. https://doi.org/10.1016/j.bbrc.2012.04.073. · DOI
- Lee WJ, Jeon RH, Jang SJ, Park JS, Lee SC, Baregundi Subbarao R, Lee SL, Park BW, King WA, Rho GJ. Selection of reference genes for quantitative gene expression in porcine Mesenchymal stem cells derived from various sources along with differentiation into multilineages. Stem Cells Int. 2015;2015:235192. · DOI
- Zhang G, Zhao M, Song C, Luo A, Bai J, Guo S. Characterization of reference genes for quantitative real-time PCR analysis in various tissues of Anoectochilus roxburghii. Mol Biol Rep. 2012;39(5):5905–12. https://doi.org/10.1007/s11033-011-1402-1. · DOI
- Perez R, Tupac-Yupanqui I, Dunner S. Evaluation of suitable reference genes for gene expression studies in bovine muscular tissue. BMC Mol Biol. 2008;9(1):79. https://doi.org/10.1186/1471-2199-9-79. · DOI
- He T, Hausdorf J, Chevalier Y, Klar RM. Trauma induced tissue survival in vitro with a muscle-biomaterial based osteogenic organoid system: a proof of concept study. BMC Biotechnol. 2020;20(1):8. https://doi.org/10.1186/s12896-020-0602-y. · DOI
- Huang Y, Seitz D, König F, Müller PE, Jansson V, Klar RM. Induction of articular Chondrogenesis by chitosan/hyaluronic-acid-based biomimetic matrices using human adipose-derived stem cells. Int J Mol Sci. 2019;20(18):4487. https://doi.org/10.3390/ijms20184487. · DOI
- Dheda K, Huggett JF, Chang JS, Kim LU, Bustin SA, Johnson MA, Rook GA, Zumla A. The implications of using an inappropriate reference gene for real-time reverse transcription PCR data normalization. Anal Biochem. 2005;344(1):141–3. https://doi.org/10.1016/j.ab.2005.05.022. · DOI
- Eisenberg E, Levanon EY. Human housekeeping genes, revisited. Trends Genet. 2013;29(10):569–74. https://doi.org/10.1016/j.tig.2013.05.010. · DOI
- Goossens K, Van Poucke M, Van Soom A, Vandesompele J, Van Zeveren A, Peelman LJ. Selection of reference genes for quantitative real-time PCR in bovine preimplantation embryos. BMC Dev Biol. 2005;5(1):27. https://doi.org/10.1186/1471-213X-5-27. · DOI
- Smits K, Goossens K, Van Soom A, Govaere J, Hoogewijs M, Vanhaesebrouck E, Galli C, Colleoni S, Vandesompele J, Peelman L. Selection of reference genes for quantitative real-time PCR in equine in vivo and fresh and frozen-thawed in vitro blastocysts. BMC Res Notes. 2009;2(1):246. https://doi.org/10.1186/1756-0500-2-246. · DOI
- Pfaffl MW, Tichopad A, Prgomet C, Neuvians TP. Determination of stable housekeeping genes, differentially regulated target genes and sample integrity: BestKeeper--excel-based tool using pair-wise correlations. Biotechnol Lett. 2004;26(6):509–15. https://doi.org/10.1023/B:BILE.0000019559.84305.47. · DOI · Paper page
- Tong Z, Gao Z, Wang F, Zhou J, Zhang Z. Selection of reliable reference genes for gene expression studies in peach using real-time PCR. BMC Mol Biol. 2009;10(1):71. https://doi.org/10.1186/1471-2199-10-71. · DOI
- Erkens T, Van Poucke M, Vandesompele J, Goossens K, Van Zeveren A, Peelman LJ. Development of a new set of reference genes for normalization of real-time RT-PCR data of porcine backfat and longissimus dorsi muscle, and evaluation with PPARGC1A. BMC Biotechnol. 2006;6(1):41. https://doi.org/10.1186/1472-6750-6-41. · DOI
- Ragni E, Vigano M, Rebulla P, Giordano R, Lazzari L. What is beyond a qRT-PCR study on mesenchymal stem cell differentiation properties: how to choose the most reliable housekeeping genes. J Cell Mol Med. 2013;17(1):168–80. https://doi.org/10.1111/j.1582-4934.2012.01660.x. · DOI
- Lu Y, Yuan M, Gao X, Kang T, Zhan S, Wan H, Li J. Identification and validation of reference genes for gene expression analysis using quantitative PCR in Spodoptera litura (Lepidoptera: Noctuidae). PLoS One. 2013;8(7):e68059. https://doi.org/10.1371/journal.pone.0068059. · DOI
- Ren B, Betz VM, Thirion C, Salomon M, Jansson V, Muller PE, Betz OB. Osteoinduction within BMP-2 transduced muscle tissue fragments with and without a fascia layer: implications for bone tissue engineering. Gene Ther. 2019;26(1–2):16–28. https://doi.org/10.1038/s41434-018-0047-2. · DOI
- Bach AD, Beier JP, Stern-Staeter J, Horch RE. Skeletal muscle tissue engineering. J Cell Mol Med. 2004;8(4):413–22. https://doi.org/10.1111/j.1582-4934.2004.tb00466.x. · DOI
- Clements DN, Vaughan-Thomas A, Peansukmanee S, Carter SD, Innes JF, Ollier WE, Clegg PD. Assessment of the use of RNA quality metrics for the screening of articular cartilage specimens from clinically normal dogs and dogs with osteoarthritis. Am J Vet Res. 2006;67(8):1438–44. https://doi.org/10.2460/ajvr.67.8.1438. · DOI
- Hunter MJ, Commerford SL. Pressure homogenization of mammalian tissues. Biochim Biophys Acta. 1961;47(3):580–6. https://doi.org/10.1016/0006-3002(61)90553-4. · DOI
- Wehrli BM, Huang W, De Crombrugghe B, Ayala AG, Czerniak B. Sox9, a master regulator of chondrogenesis, distinguishes mesenchymal chondrosarcoma from other small blue round cell tumors. Hum Pathol. 2003;34(3):263–9. https://doi.org/10.1053/hupa.2003.41. · DOI
- Estes BT, Guilak F. Three-dimensional culture systems to induce chondrogenesis of adipose-derived stem cells. Methods Mol Biol. 2011;702:201–17. https://doi.org/10.1007/978-1-61737-960-4_15. · DOI
- Yang Q, Peng J, Guo Q, Huang J, Zhang L, Yao J, Yang F, Wang S, Xu W, Wang A, Lu S. A cartilage ECM-derived 3-D porous acellular matrix scaffold for in vivo cartilage tissue engineering with PKH26-labeled chondrogenic bone marrow-derived mesenchymal stem cells. Biomaterials. 2008;29(15):2378–87. https://doi.org/10.1016/j.biomaterials.2008.01.037. · DOI
- Sottile V, Thomson A, McWhir J. In vitro osteogenic differentiation of human ES cells. Cloning Stem Cells. 2003;5(2):149–55. https://doi.org/10.1089/153623003322234759. · DOI
- Warrington JA, Nair A, Mahadevappa M, Tsyganskaya M. Comparison of human adult and fetal expression and identification of 535 housekeeping/maintenance genes. Physiol Genomics. 2000;2(3):143–7. https://doi.org/10.1152/physiolgenomics.2000.2.3.143. · DOI
- Dheda K, Huggett JF, Bustin SA, Johnson MA, Rook G, Zumla A. Validation of housekeeping genes for normalizing RNA expression in real-time PCR. Biotechniques. 2004;37(1):112–4, 116, 118-119. https://doi.org/10.2144/04371RR03. · DOI
- VanGuilder HD, Vrana KE, Freeman WM. Twenty-five years of quantitative PCR for gene expression analysis. Biotechniques. 2008;44(5):619–26. https://doi.org/10.2144/000112776. · DOI · Paper page
Metadata
- Authors
- Xiong, F., Cheng, X., Zhang, C., Klar, R. M., & He, T.
- Affiliations
- Soochow University (CN)
- Shanghai Jiao Tong University (CN)
- LMU Klinikum (DE)
- Corresponding author
- Klar, Roland Manfred
- He, Tao
- Venue
- BMC Biotechnology
- Published
- 2021-03-17
- Volume
- 21
- Issue
- 1
- Pages
- 25-25
- ISSN
- 1472-6750 (ISSN-L)
- PMC
- PMC7972220
- OpenAlex
- W3136910573
- Cited by
- 12
- References
- 2
- Citations by year
- 2025: 2 · 2024: 2 · 2023: 2 · 2022: 3 · 2021: 3
- FWCI
- 0.78
- Type
- journal article
- Language
- en
- Open access
- gold
- doi.org
- Locations
- BMC Biotechnology (publishedVersion, cc-by)
- Research Square (acceptedVersion, cc-by)
- PubMed Central (publishedVersion, cc-by)
- PubMed (publishedVersion)
- DOAJ (DOAJ: Directory of Open Access Journals) (submittedVersion, cc-by-sa)
- Funders
- China Scholarship Council (201708140085)
- Topics
- Life Sciences › Biochemistry, Genetics and Molecular Biology › Molecular Biology › Molecular Biology Techniques and Applications
- Life Sciences › Biochemistry, Genetics and Molecular Biology › Molecular Biology › Gene expression and cancer classification
- Health Sciences › Health Professions › Medical Laboratory Technology › Clinical Laboratory Practices and Quality Control
- Keywords
- reference genes, qRT-PCR normalization, geNorm, gene expression stability, bone mesenchymal stem cells, chondrogenic differentiation, osteogenic differentiation, skeletal muscle, adipose tissue, MIQE guidelines, candidate reference genes
- MeSH terms
- Animals, Bone and Bones, Cartilage, Osteogenesis, Reference Standards, Chondrogenesis, Gene Expression Profiling, Rats, Bioengineering, Mesenchymal Stem Cells, Real-Time Polymerase Chain Reaction
About these checks
Registry, retraction, Cites and statistics results are computed, not judged, with one exception: a printed reference that no index lists is read once by a model before it counts as a citation error. Claims are extracted by a model and kept only when their quote appears verbatim in the text; each cited source is then checked, with a model’s help, for whether it says what the claim relies on. Those verdicts can be wrong — read the claim’s quote and the cited source before relying on one.
Statistics and arithmetic are recomputed, not judged.
Confidence bands are shown only for fields calibrated on our annotated test set. None is calibrated yet, so no band is shown.
What counts as a claim ›How we measure confidence ›How we check this ›
Are you an author, or do you see a problem with this page? Request a review
How to cite
Cite CoChat for the checks on this page, and the paper for its own findings.
- This page
- CoChat. (2026). Citation check: Optimizations for identifying reference genes in bone and cartilage bioengineering. https://app.cochat.ai/papers/10.1186/s12896-021-00685-8
- The paper
- Xiong, F., Cheng, X., Zhang, C., Klar, R. M., & He, T. (2021). Optimizations for identifying reference genes in bone and cartilage bioengineering. BMC Biotechnology. https://doi.org/10.1186/s12896-021-00685-8
