

annATAC: automatic cell type annotation for scATAC-seq data based on language model
Open accessThe DOI matches its Crossref record; 49 of the 49 references it cites were found in a registry or an index.
Abstract
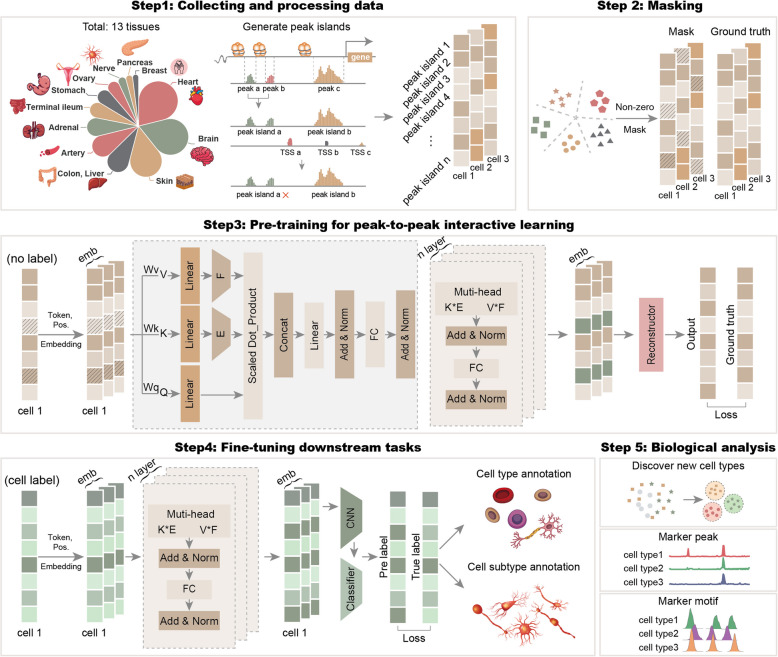
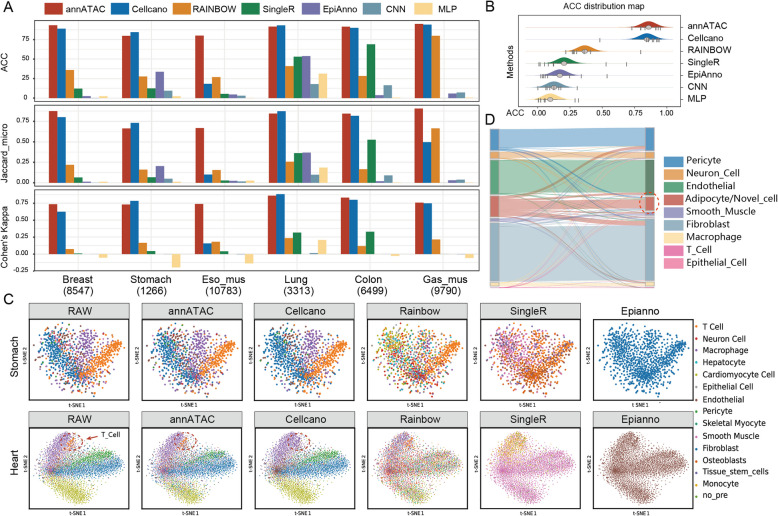
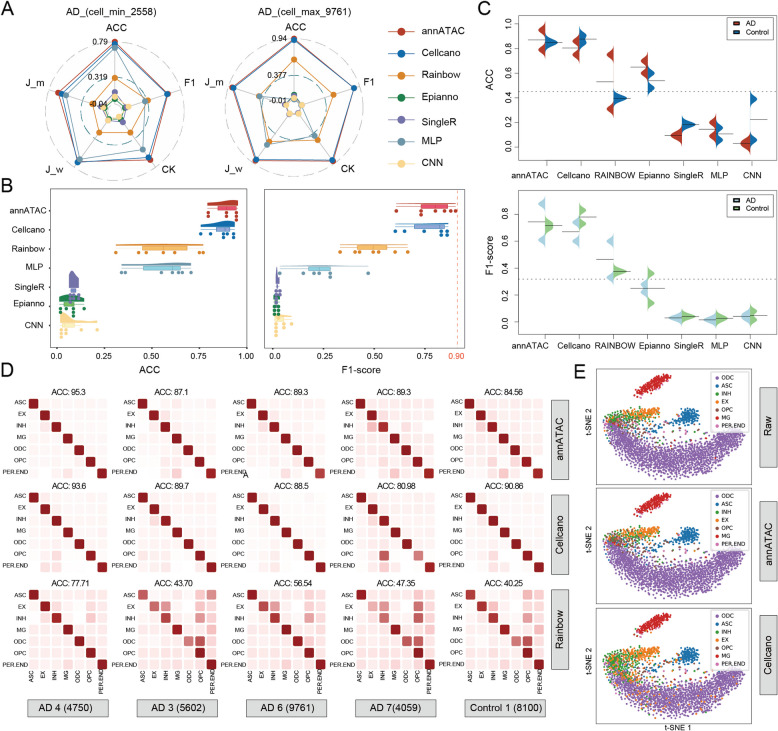
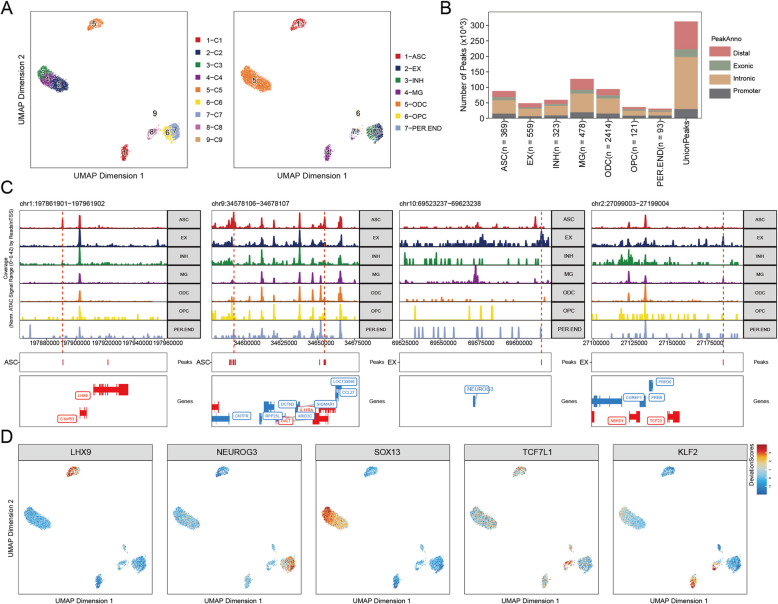
BACKGROUND: Cell type annotation serves as the cornerstone for downstream analysis of single cell data. Nevertheless, scATAC-seq data is characterized by high sparsity and dimensionality, presenting significant challenges to its annotation process. RESULTS: We introduce a novel method based on language model, named annATAC, which is designed for the automatic annotation of cell types in scATAC-seq data. This method primarily consists of three stages. During the pre-training stage, by training on a vast amount of unlabeled data, the model can learn the interaction relationships between peaks, thus building a preliminary understanding of the data features. Subsequently, in the fine-tuning stage, a small quantity of labeled data is utilized to conduct secondary training on the model, which enables the model to identify cell types accurately. Finally, in the prediction stage, the trained model is applied to annotate scATAC-seq data. CONCLUSIONS: Compared with other automatic annotation methods across multiple datasets, annATAC demonstrates superiority on the annotation performance. Further experiments have validated that annATAC holds great potential in identifying marker peaks and marker motifs. It is expected that annATAC will provide more profound and precise analysis outcomes for scATAC-seq research. As a result, it will effectively promote the progress of relevant biomedical research.
Overview
The claims and statistics of this paper haven’t been checked yet.
Free: it reads the open-access text and checks the first 5 claims that cite a source we can check. Create a free account to check every claim.
Integrity signals
Registry
Cites
Statistics
Figures
Verification
Claims the paper makes
The claims and statistics of this paper haven’t been checked yet.
Free: it reads the open-access text and checks the first 5 claims that cite a source we can check. Create a free account to check every claim.
Self-check
Percentages, sums and reported differences re-computed from the paper’s own numbers.
The self-check needs the paper’s full text.
Citations
Cites
Dictionary learning for integrative, multimodal and scalable single-cell analysis
Hao, Y., Stuart, T., Kowalski, M. H., Choudhary, S., Hoffman, P., Hartman, A., Srivastava, A., Molla, G., Madad, S., Fernandez-Granda, C., et al. (2024) · Nature Biotechnology · doi:10.1038/s41587-023-01767-y · Cited by 5,631
Aran, D., Looney, A. P., Liu, L., Wu, E., Fong, V., Hsu, A., Chak, S., Naikawadi, R. P., Wolters, P. J., Abate, A. R., et al. (2019) · Nature Immunology · doi:10.1038/s41590-018-0276-y · Cited by 4,984 · cited 2×
“Cell type annotation is the core of downstream single-cell data analysis [20, 21].”
Mapping and analysis of chromatin state dynamics in nine human cell types
Ernst, J., Kheradpour, P., Mikkelsen, T. S., Shoresh, N., Ward, L. D., Epstein, C. B., Zhang, X., Wang, L., Issner, R., Coyne, M., et al. (2011) · Nature · doi:10.1038/nature09906 · Cited by 2,898
Single-cell chromatin state analysis with Signac
Stuart, T., Srivastava, A., Madad, S., Lareau, C. A., & Satija, R. (2021) · Nature Methods · doi:10.1038/s41592-021-01282-5 · Cited by 1,769 · cited 1×
“For example, Seurat [26], ArchR [27], Signac [28], Ata-cAnnoR [29], and scJoint [30].”
ArchR is a scalable software package for integrative single-cell chromatin accessibility analysis
Granja, J. M., Corces, M. R., Pierce, S. E., Bagdatli, S. T., Choudhry, H., Chang, H. Y., & Greenleaf, W. J. (2021) · Nature Genetics · doi:10.1038/s41588-021-00790-6 · Cited by 1,392 · cited 3×
“Instead, they convert the data pattern with the help of tools like ArchR [27] or TF-IDF [34] to achieve annotation.”
Transfer learning enables predictions in network biology
Theodoris, C. V., Xiao, L., Chopra, A., Chaffin, M. D., Al Sayed, Z. R., Hill, M. C., Mantineo, H., Brydon, E. M., Zeng, Z., Liu, X. S., et al. (2023) · Nature · doi:10.1038/s41586-023-06139-9 · Cited by 1,193 · cited 1×
“Their core advantage lies in the ability to learn complex feature representations from a large amount of unlabeled data, refine potential patterns and regularities, and then fine-tune using a small amount of labeled data based on supervised learning to accurately annotate the unlabeled data [42–44].”
Higher-Order Inter-chromosomal Hubs Shape 3D Genome Organization in the Nucleus
Quinodoz, S. A., Ollikainen, N., Tabak, B., Palla, A., Schmidt, J. M., Detmar, E., Lai, M. M., Shishkin, A. A., Bhat, P., Takei, Y., et al. (2018) · Cell · doi:10.1016/j.cell.2018.05.024 · Cited by 892
SCENIC+: single-cell multiomic inference of enhancers and gene regulatory networks
Bravo González-Blas, C., De Winter, S., Hulselmans, G., Hecker, N., Matetovici, I., Christiaens, V., Poovathingal, S., Wouters, J., Aibar, S., & Aerts, S. (2023) · Nature Methods · doi:10.1038/s41592-023-01938-4 · Cited by 778
SCENIC+: single-cell multiomic inference of enhancers and gene regulatory networks
González-Blas, C. B., De Winter, S., Hulselmans, G., Hecker, N., Matetovici, I., Christiaens, V., Poovathingal, S., Wouters, J., Aibar, S., & Aerts, S. (2022) · doi:10.1101/2022.08.19.504505 · Cited by 778
A Single-Cell Atlas of In Vivo Mammalian Chromatin Accessibility
Cusanovich, D. A., Hill, A. J., Aghamirzaie, D., Daza, R. M., Pliner, H. A., Berletch, J. B., Filippova, G. N., Huang, X., Christiansen, L., DeWitt, W. S., et al. (2018) · Cell · doi:10.1016/j.cell.2018.06.052 · Cited by 759
Research works printed but not linked: 1
- Pedregosa F, Varoquaux G, Gramfort A, Michel V, Thirion B, Grisel O, et al. Scikit-learn: machine learning in Python. J Mach Learn Res. 2011;12:2825–30.
Cited by
Spatial pharmacology of anti-cancer immunomodulators: a comprehensive review
Chen, S., Tu, L., & Chen, Q. (2026) · Frontiers in Pharmacology · doi:10.3389/fphar.2026.1898418 · Cited by 1
“The annATAC tool uses a language model to annotate cell types from scATAC-seq data, outperforming other methods in accuracy (Cui et al., 2025).”
Metadata
- Authors
- Cui, L., Wang, F., Li, H., Liu, Q., Zhou, M., & Wang, G.
- Affiliations
- Northeast Forestry University (CN)
- Wenzhou Medical University (CN)
- University of Electronic Science and Technology of China (CN)
- Henan University (CN)
- Harbin Institute of Technology (CN)
- Corresponding author
- Wang, Guohua
- Venue
- BMC Biology
- Published
- 2025-05-28
- Volume
- 23
- Issue
- 1
- Pages
- 145-145
- ISSN
- 1741-7007 (ISSN-L)
- PMC
- PMC12121080
- OpenAlex
- W4410796331
- Cited by
- 3
- References
- 49
- Citations by year
- 2026: 3
- FWCI
- 0.90
- Type
- journal article
- Language
- en
- Open access
- gold
- doi.org
- Licence
- cc-by-nc-nd
- creativecommons.org/licenses/by-nc-nd/4.0 (tdm)
- creativecommons.org/licenses/by-nc-nd/4.0 (vor)
- Locations
- BMC Biology (publishedVersion, cc-by-nc-nd)
- PubMed Central (publishedVersion, cc-by-nc-nd)
- PubMed (publishedVersion)
- DOAJ (DOAJ: Directory of Open Access Journals) (submittedVersion, cc-by-sa)
- Funders
- National Natural Science Foundation of China (32400546, 62302342, 62450112)
- Topics
- Life Sciences › Biochemistry, Genetics and Molecular Biology › Molecular Biology › Single-cell and spatial transcriptomics
- Life Sciences › Biochemistry, Genetics and Molecular Biology › Molecular Biology › Genomics and Chromatin Dynamics
- Life Sciences › Biochemistry, Genetics and Molecular Biology › Molecular Biology › Gene Regulatory Network Analysis
- Keywords
- cell type annotation, single-cell ATAC-seq, language models, unsupervised pre-training, fine-tuning, single-cell chromatin accessibility
- MeSH terms
- Humans, Software, Molecular Sequence Annotation, Single-Cell Analysis
About these checks
Registry, retraction, Cites and statistics results are computed, not judged, with one exception: a printed reference that no index lists is read once by a model before it counts as a citation error. Claims are extracted by a model and kept only when their quote appears verbatim in the text; each cited source is then checked, with a model’s help, for whether it says what the claim relies on. Those verdicts can be wrong — read the claim’s quote and the cited source before relying on one.
Statistics and arithmetic are recomputed, not judged.
Confidence bands are shown only for fields calibrated on our annotated test set. None is calibrated yet, so no band is shown.
What counts as a claim ›How we measure confidence ›How we check this ›
Are you an author, or do you see a problem with this page? Request a review
How to cite
Cite CoChat for the checks on this page, and the paper for its own findings.
- This page
- CoChat. (2026). Citation check: annATAC: automatic cell type annotation for scATAC-seq data based on language model. https://app.cochat.ai/papers/10.1186/s12915-025-02244-5
- The paper
- Cui, L., Wang, F., Li, H., Liu, Q., Zhou, M., & Wang, G. (2025). annATAC: automatic cell type annotation for scATAC-seq data based on language model. BMC Biology. https://doi.org/10.1186/s12915-025-02244-5
Data sources
Bibliographic data: Semantic Scholar, OpenAlex, Crossref.
Contains information from the Semantic Scholar Academic Graph Datasets, made available under the ODC Attribution License (ODC-BY 1.0).
Semantic Scholar’s data is described in: Kinney, R., et al. (2023). The Semantic Scholar Open Data Platform. arXiv:2301.10140.
