

The DOI matches its Crossref record; 48 of the 48 references it cites were found in a registry or an index.
Metabolic characterization of menopause: cross-sectional and longitudinal evidence
Open accessPublished version of a preprint
Abstract
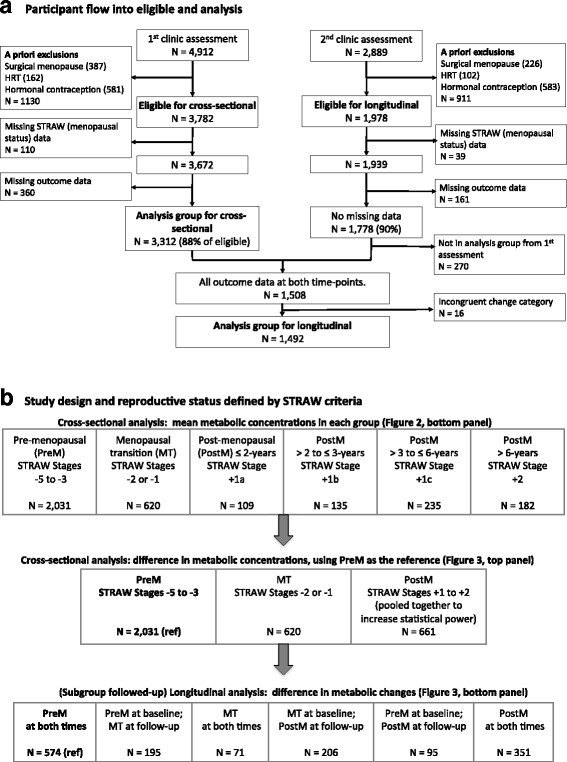
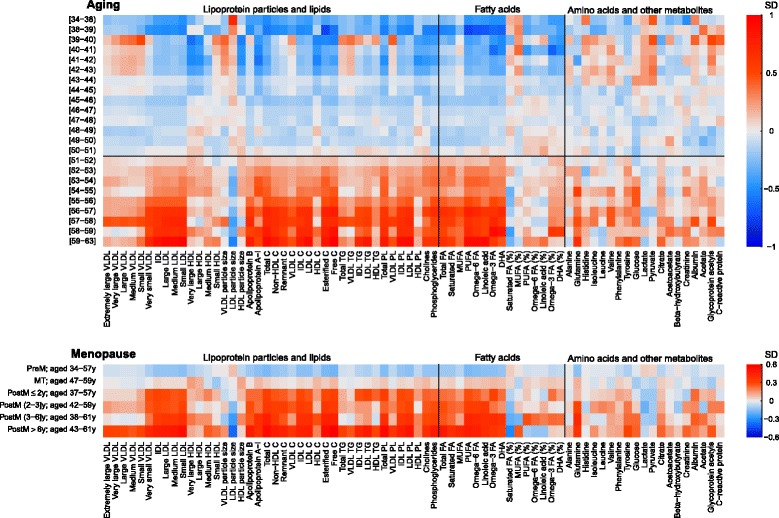
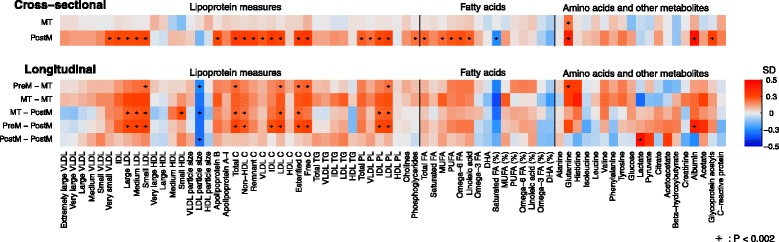
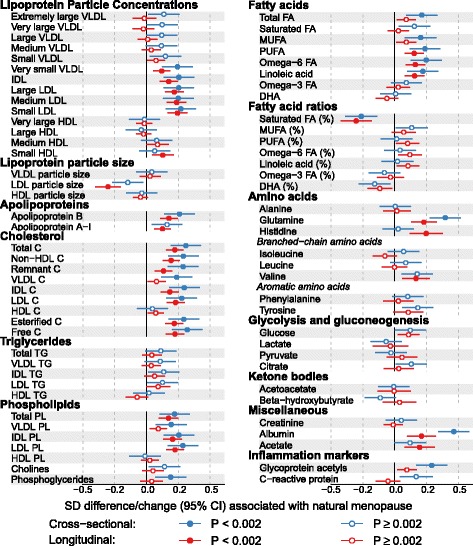
BACKGROUND: Women who experience menopause are at higher cardiometabolic risk and often display adverse changes in metabolic biomarkers compared with pre-menopausal women. It remains elusive whether the changes in cardiometabolic biomarkers during the menopausal transition are due to ovarian aging or chronological aging. Well-conducted longitudinal studies are required to determine this. The aim of this study was to explore the cross-sectional and longitudinal associations of reproductive status, defined according to the 2012 Stages of Reproductive Aging Workshop criteria, with 74 metabolic biomarkers, and establish whether any associations are independent of age-related changes. METHODS: We determined cross-sectional associations of reproductive status with metabolic profiling in 3,312 UK midlife women. In a subgroup of 1,492 women who had repeat assessments after 2.5 years, we assessed how the change in reproductive status was associated with the changes in metabolic biomarkers. Metabolic profiles were measured by high-throughput quantitative nuclear magnetic resonance metabolomics. In longitudinal analyses, we compared the change in metabolic biomarkers for each reproductive-status category change to that of the reference of being pre-menopausal at both time points. As all women aged by a similar amount during follow-up, these analyses contribute to distinguishing age-related changes from those related to change in reproductive status. RESULTS: Consistent cross-sectional and longitudinal associations of menopause with a wide range of metabolic biomarkers were observed, suggesting the transition to menopause induces multiple metabolic changes independent of chronological aging. The metabolic changes included increased concentrations of very small very low-density lipoproteins, intermediate-density lipoproteins, low-density lipoproteins (LDLs), remnant, and LDL cholesterol, and reduced LDL particle size, all toward an atherogenic lipoprotein profile. Increased inflammation was suggested via an inflammatory biomarker, glycoprotein acetyls, but not via C-reactive protein. Also, levels of glutamine and albumin increased during the transition. Most of these metabolic changes seen at the time of becoming post-menopausal remained or became slightly stronger during the post-menopausal years. CONCLUSIONS: The transition to post-menopause has effects on multiple circulating metabolic biomarkers, over and above the underlying age trajectory. The adverse changes in multiple apolipoprotein-B-containing lipoprotein subclasses and increased inflammation may underlie women's increased cardiometabolic risk in their post-menopausal years.
Overview
The claims and statistics of this paper haven’t been checked yet.
Run the check — free, no account needed. It reads the open-access text and checks the sources it cites.
Integrity signals
Registry
Cites
Statistics
Figures
Verification
Claims the paper makes
The claims and statistics of this paper haven’t been checked yet.
Run the check — free, no account needed. It reads the open-access text and checks the sources it cites.
Claims other papers make about this one
Each is checked against this paper’s own text: does it say what the citing paper says it does?
The check wasn’t confident either way, so it gives no verdict — never disputed.
In the citing paper
“Hormonal patterns during the luteal phase of the menstrual cycle also show changes with age, with greater absences of ovulatory cycles, while reductions in luteal phase progesterone become more common [107–109].”
From International society of sports nutrition position stand: nutritional concerns of the female athlete (2023) · cites this paper as [109]
Experimental — accuracy not yet measured
Self-check
Percentages, sums and reported differences re-computed from the paper’s own numbers.
The self-check needs the paper’s full text.
Citations
Cites
Mostly Harmless Econometrics: An Empiricist's Companion
Angrist, J. D., & Pischke, J.-S. (2008) · doi:10.2307/j.ctvcm4j72 · Cited by 5,051
Boyd, A., Golding, J., Macleod, J., Lawlor, D. A., Fraser, A., Henderson, J., Molloy, L., Ness, A., Ring, S., & Davey Smith, G. (2013) · International Journal of Epidemiology · doi:10.1093/ije/dys064 · Cited by 2,996
Self-citationCohort Profile: The Avon Longitudinal Study of Parents and Children: ALSPAC mothers cohort
Fraser, A., Macdonald-Wallis, C., Tilling, K., Boyd, A., Golding, J., Davey Smith, G., Henderson, J., Macleod, J., Molloy, L., Ness, A., et al. (2013) · International Journal of Epidemiology · doi:10.1093/ije/dys066 · Cited by 2,494
Self-citationExecutive summary of the Stages of Reproductive Aging Workshop + 10
Harlow, S. D., Gass, M. L. S., Hall, J. E., Lobo, R. A., Maki, P. M., Rebar, R. W., Sherman, S., Sluss, P. M., & de Villiers, T. J. (2012) · Menopause The Journal of The North American Menopause Society · doi:10.1097/gme.0b013e31824d8f40 · Cited by 1,800
Harlow, S. D., Gass, M. L. S., Hall, J. E., Lobo, R. A., Maki, P. M., Rebar, R. W., Sherman, S., Sluss, P. M., de Villiers, T. J., & for the STRAW + 10 Collaborative Group (2012) · The Journal of Clinical Endocrinology & Metabolism · doi:10.1210/jc.2011-3362 · Cited by 1,337
Chowdhury, R., Warnakula, S., Kunutsor, S., Crowe, F., Ward, H. A., Johnson, L., Franco, O. H., Butterworth, A. S., Forouhi, N. G., Thompson, S. G., et al. (2014) · Annals of Internal Medicine · doi:10.7326/m13-1788 · Cited by 1,139
Metabolomics in Prediabetes and Diabetes: A Systematic Review and Meta-analysis
Guasch‐Ferré, M., Hruby, A., Toledo, E., Clish, C. B., Martínez‐González, M. Á., Salas‐Salvadó, J., & Hu, F. B. (2016) · Diabetes Care · doi:10.2337/dc15-2251 · Cited by 916
Soininen, P., Kangas, A. J., Würtz, P., Suna, T., & Ala‐Korpela, M. (2015) · Circulation Cardiovascular Genetics · doi:10.1161/circgenetics.114.000216 · Cited by 910
Self-citationAtsma, F., Bartelink, M.-L. E. L., Grobbee, D. E., & van der Schouw, Y. T. (2006) · Menopause · doi:10.1097/01.gme.0000218683.97338.ea · Cited by 744
Kettunen, J., Demirkan, A., Würtz, P., Draisma, H. H. M., Haller, T., Rawal, R., Vaarhorst, A., Kangas, A. J., Lyytikäinen, L.-P., Pirinen, M., et al. (2016) · Nature Communications · doi:10.1038/ncomms11122 · Cited by 738
Self-citation
Cited by
Sorted by citations
Newman, C. B., Blaha, M. J., Boord, J. B., Cariou, B., Chait, A., Fein, H. G., Ginsberg, H. N., Goldberg, I. J., Murad, M. H., Subramanian, S., et al. (2020) · The Journal of Clinical Endocrinology & Metabolism · doi:10.1210/clinem/dgaa674 · Cited by 180
Beyene, H. B., Olshansky, G., Smith, A., Giles, C., Huynh, K., Cinel, M. A., Mellett, N. A., Cadby, G., Hung, J., Hui, J., et al. (2020) · PLoS Biology · doi:10.1371/journal.pbio.3000870 · Cited by 160
Rysz, J., Gluba-Brzózka, A., Rysz-Górzyńska, M., & Franczyk, B. (2020) · International Journal of Molecular Sciences · doi:10.3390/ijms21020601 · Cited by 123
Mattina, G. F., Lieshout, R. J. V., & Steiner, M. S. (2019) · Therapeutic Advances in Cardiovascular Disease · doi:10.1177/1753944719851950 · Cited by 106
Global epidemiology of breast cancer based on risk factors: a systematic review
Roheel, A., Khan, A., Anwar, F., Akbar, Z., Akhtar, M. F., Khan, M. I., Sohail, M. F., & Ahmad, R. (2023) · Frontiers in Oncology · doi:10.3389/fonc.2023.1240098 · Cited by 104
Gender-Related Factors in Medication Adherence for Metabolic and Cardiovascular Health
Venditti, V., Bleve, E., Morano, S., & Filardi, T. (2023) · Metabolites · doi:10.3390/metabo13101087 · Cited by 118
International society of sports nutrition position stand: nutritional concerns of the female athlete
Sims, S. T., Kerksick, C. M., Smith-Ryan, A. E., Janse de Jonge, X. A. K., Hirsch, K. R., Arent, S. M., Hewlings, S. J., Kleiner, S. M., Bustillo, E., Tartar, J. L., et al. (2023) · Journal of the International Society of Sports Nutrition · doi:10.1080/15502783.2023.2204066 · Cited by 129
“abdominal adiposity, decreased lean mass, a reduction in bone mineral density, and a decrease in energy expenditure [110,111].”
BackgroundBalling, M., Langsted, A., Afzal, S., Varbo, A., Smith, G. D., & Nordestgaard, B. G. (2019) · Atherosclerosis · doi:10.1016/j.atherosclerosis.2019.05.011 · Cited by 70
Metabolic health, menopause, and physical activity—a 4-year follow-up study
Hyvärinen, M., Juppi, H., Taskinen, S., Karppinen, J. E., Karvinen, S. M., Tammelin, T., Kovanen, V., Aukee, P., Kujala, U. M., Rantalainen, T., et al. (2021) · International Journal of Obesity · doi:10.1038/s41366-021-01022-x · Cited by 81
Sex differences in systemic metabolites at four life stages: cohort study with repeated metabolomics
Bell, J. A., Ferreira, D. L. S., Fraser, A., Soares, A. G., Howe, L. D., Lawlor, D. A., Carslake, D., Smith, G. D., & O’Keeffe, L. M. (2021) · BMC Medicine · doi:10.1186/s12916-021-01929-2 · Cited by 64
Self-citationKilpi, F., Soares, A. G., Fraser, A., Nelson, S. M., Sattar, N. A., Fallon, S. J., Tilling, K. M., & Lawlor, D. A. (2020) · BMC Women s Health · doi:10.1186/s12905-020-01040-3 · Cited by 60
Self-citationKarvinen, S. M., Jergenson, M. J., Hyvärinen, M., Aukee, P., Tammelin, T., Sipilä, S., Kovanen, V., Kujala, U. M., & Laakkonen, E. K. (2019) · Frontiers in Endocrinology · doi:10.3389/fendo.2019.00589 · Cited by 59
Menopause Predisposes Women to Increased Risk of Cardiovascular Disease
Kamińska, M. S., Schneider-Matyka, D., Rachubińska, K., Pańczyk, M., Grochans, E., & Cybulska, A. M. (2023) · Journal of Clinical Medicine · doi:10.3390/jcm12227058 · Cited by 68
Jobard, É., Dossus, L., Baglietto, L., Fornili, M., Lécuyer, L., Mancini, F. R., Gunter, M. J., Trédan, O., Boutron‐Ruault, M., Elena‐Herrmann, B., et al. (2021) · British Journal of Cancer · doi:10.1038/s41416-021-01304-1 · Cited by 55
Total and regional body adiposity increases during menopause—evidence from a follow‐up study
Juppi, H., Sipilä, S., Fachada, V., Hyvärinen, M., Cronin, N. J., Aukee, P., Karppinen, J. E., Selänne, H., Kujala, U. M., Kovanen, V., et al. (2022) · Aging Cell · doi:10.1111/acel.13621 · Cited by 51
Menopause modulates the circulating metabolome: evidence from a prospective cohort study
Karppinen, J. E., Törmäkangas, T., Kujala, U. M., Sipilä, S., Laukkanen, J. A., Aukee, P., Kovanen, V., & Laakkonen, E. K. (2022) · European Journal of Preventive Cardiology · doi:10.1093/eurjpc/zwac060 · Cited by 46
A plasma proteogenomic signature for fibromuscular dysplasia
Olin, J. W., Narzo, A. D., d’Escamard, V., Kadian‐Dodov, D. L., Cheng, H. M., Georges, A. B., King, A., Thomas, A., Barwari, T., Michelis, K. C., et al. (2019) · Cardiovascular Research · doi:10.1093/cvr/cvz219 · Cited by 42
Phenome-wide associations of human aging uncover sex-specific dynamics
Reicher, L., Bar, N., Godneva, A., Reisner, Y., Zahavi, L., Shahaf, N., Dhir, R., Weinberger, A., & Segal, E. (2024) · Nature Aging · doi:10.1038/s43587-024-00734-9 · Cited by 40
Wang, M., Gan, W., Kartsonaki, C., Yu, C., Lv, J., Chen, Z., Li, L., Yang, L., & Yu, M. (2022) · Nutrition & Metabolism · doi:10.1186/s12986-022-00643-x · Cited by 41
Seah, J. Y. H., Hong, Y., Cichońska, A., Sabanayagam, C., Nusinovici, S., Wong, T. Y., Cheng, C., Jousilahti, P., Lundqvist, A., Perola, M., et al. (2022) · The Journal of Clinical Endocrinology & Metabolism · doi:10.1210/clinem/dgac212 · Cited by 38
Zhou, H., Zhang, C., Ni, J., & Han, X.-C. (2019) · BMC Endocrine Disorders · doi:10.1186/s12902-019-0427-7 · Cited by 37
Sex-specific risk factors for cardiovascular disease in women-making cardiovascular disease real
Merz, C. N. B., Ramineni, T., & Leong, D. (2018) · Current Opinion in Cardiology · doi:10.1097/hco.0000000000000543 · Cited by 37
Ruth, K. S., Soares, A. G., Borges, M. C., Eliassen, A. H., Hankinson, S. E., Jones, M. E., Kraft, P. L., Nichols, H. B., Sandler, D. P., Schoemaker, M. J., et al. (2019) · Human Molecular Genetics · doi:10.1093/hmg/ddz015 · Cited by 33
Self-citationInsight on the Intracrinology of Menopause: Androgen Production within the Human Vagina
Cellai, I., Stasi, V. D., Comeglio, P., Maseroli, E., Todisco, T., Corno, C., Filippi, S., Cipriani, S., Sorbi, F., Fambrini, M., et al. (2020) · Endocrinology · doi:10.1210/endocr/bqaa219 · Cited by 32
Longitudinal profiling of metabolic ageing trends in two population cohorts of young adults
Mäkinen, V., Karsikas, M., Kettunen, J., Lehtimäki, T. J., Kähönen, M. A. P., Viikari, J. S. A., Perola, M., Salomaa, V. V., Järvelin, M., Raitakari, O. T., et al. (2022) · International Journal of Epidemiology · doi:10.1093/ije/dyac062 · Cited by 30
Self-citationRashid, K. A., Taylor, A. E., Lumsden, M. A., Goulding, N., Lawlor, D. A., & Nelson, S. M. (2020) · BMC Medicine · doi:10.1186/s12916-020-01700-z · Cited by 27
Self-citationSoares, A. G., Kilpi, F., Fraser, A., Nelson, S. M., Sattar, N. A., Welsh, P. I., Tilling, K. M., & Lawlor, D. A. (2020) · Scientific Reports · doi:10.1038/s41598-020-77871-9 · Cited by 26
Self-citationThe Effect of Pre-Analytical Conditions on Blood Metabolomics in Epidemiological Studies
Ferreira, D. L. S., Maple, H. J., Goodwin, M., Brand, J. S., Yip, V., Min, J. L., Groom, A., Lawlor, D. A., & Ring, S. M. (2019) · Metabolites · doi:10.3390/metabo9040064 · Cited by 25
Self-citationGomes, R. M., Ferreira-Junior, M. D., Francisco, F. A., Moreira, V. M., Almeida, D. L., Saavedra, L. P. J., de Oliveira, J. C., Franco, C. C. D. S., Pedrino, G. R., Mathias, P. C. D. F., et al. (2018) · Life Sciences · doi:10.1016/j.lfs.2018.10.032 · Cited by 24
Pereira, R., Krustrup, P., Castagna, C., Coelho, E., Santos, R., Martins, S., Guimarães, J. T., Magalhães, J., & Póvoas, S. C. A. (2020) · Progress in Cardiovascular Diseases · doi:10.1016/j.pcad.2020.10.005 · Cited by 24
Juonala, M., Ellul, S., Lawlor, D. A., Ferreira, D. L. S., Carlin, J. B., Cheung, M. M. H., Dwyer, T., Wake, M. A., Saffery, R., & Burgner, D. P. (2019) · Journal of the American Heart Association · doi:10.1161/jaha.118.011852 · Cited by 21
Self-citationWatanabe, K., Iida, M., Harada, S., Kato, S., Kuwabara, K., Kurihara, A., Takeuchi, A., Sugiyama, D., Okamura, T., Suzuki, A., et al. (2021) · Maturitas · doi:10.1016/j.maturitas.2021.10.004 · Cited by 22
Masuda, R., Wist, J., Lodge, S., Kimhofer, T., Hunter, M. L., Hui, J., Beilby, J. P., Burnett, J. R., Dwivedi, G., Schlaich, M. P., et al. (2023) · Journal of clinical lipidology · doi:10.1016/j.jacl.2023.06.004 · Cited by 22
Honarvar, N. M., Zarezadeh, M., Molsberry, S. A., & Ascherio, A. (2021) · Ageing Research Reviews · doi:10.1016/j.arr.2021.101340 · Cited by 22
The impact of reproductive factors on the metabolic profile of females from menarche to menopause
Clayton, G., Borges, M. C., & Lawlor, D. A. (2024) · Nature Communications · doi:10.1038/s41467-023-44459-6 · Cited by 24
Self-citationMäkinen, V., & Ala‐Korpela, M. (2024) · International Journal of Epidemiology · doi:10.1093/ije/dyae055 · Cited by 19
Self-citationGestational Weight Gain and Long-term Maternal Obesity Risk: A Multiple-Bias Analysis
Hutchins, F., Krafty, R. T., Khoudary, S. R. E., Catov, J. M., Colvin, A. B., Barinas‐Mitchell, E., & Brooks, M. M. (2020) · Epidemiology · doi:10.1097/ede.0000000000001310 · Cited by 20
Clayton, G., Soares, A. G., Kilpi, F., Fraser, A., Welsh, P. I., Sattar, N. A., Nelson, S. M., Tilling, K. M., & Lawlor, D. A. (2022) · BMC Medicine · doi:10.1186/s12916-022-02454-6 · Cited by 23
Self-citationAssociation between HDL-C levels and menopause: a meta-analysis
Li, H., Sun, R., Chen, Q., Guo, Q., Wang, J., Lu, L., & Zhang, Y. (2020) · HORMONES · doi:10.1007/s42000-020-00216-8 · Cited by 20
Kamińska, M. S., Lubkowska, A., Pańczyk, M., Walaszek, I., Grochans, S., Grochans, E., & Cybulska, A. M. (2023) · Nutrients · doi:10.3390/nu15122789 · Cited by 22
Khoudary, S. R. E., Chen, X., Wang, Z., Brooks, M. M., Orchard, T. J., Crawford, S. L., Janssen, İ., Everson‐Rose, S. A., McConnell, D. S., & Matthews, K. A. (2023) · Menopause The Journal of The North American Menopause Society · doi:10.1097/gme.0000000000002245 · Cited by 18
Vicariotto, F., Malfa, P., Viciani, E., Dell’Atti, F., Squarzanti, D. F., Marcante, A., Castagnetti, A., Ponchia, R., Governini, L., & Leo, V. D. (2024) · Nutrients · doi:10.3390/nu16030402 · Cited by 18
Wang, Y., & Wang, Y. (2022) · Frontiers in Endocrinology · doi:10.3389/fendo.2022.780979 · Cited by 17
Effects of concurrent exercise on cardiometabolic status during perimenopause: the FLAMENCO Project
Coll‐Risco, I., Borges‐Cosic, M., Acosta‐Manzano, P., Camiletti‐Moirón, D., Aranda, P., & Aparicio, V. A. (2018) · Climacteric · doi:10.1080/13697137.2018.1526892 · Cited by 17
Mäkinen, V., Kettunen, J., Lehtimäki, T. J., Kähönen, M. A. P., Viikari, J. S. A., Perola, M., Salomaa, V. V., Järvelin, M., Raitakari, O. T., & Ala‐Korpela, M. (2023) · International Journal of Obesity · doi:10.1038/s41366-023-01281-w · Cited by 16
Self-citationHartley, A. E., Paternoster, L., Evans, D. M., Fraser, W. D., TANG, J. C. Y., Lawlor, D. A., Tobias, J. H., & Gregson, C. L. (2019) · Clinical Endocrinology · doi:10.1111/cen.14119 · Cited by 15
Self-citationMetcalf, C. A., Johnson, R. L., Freeman, E. W., Sammel, M. D., & Epperson, C. N. (2021) · Brain Behavior & Immunity - Health · doi:10.1016/j.bbih.2021.100280 · Cited by 18
Ala‐Korpela, M., Lehtimäki, T. J., Kähönen, M. A. P., Viikari, J. S. A., Perola, M., Salomaa, V. V., Kettunen, J., Raitakari, O. T., & Mäkinen, V. (2023) · The Journal of Clinical Endocrinology & Metabolism · doi:10.1210/clinem/dgad032 · Cited by 14
Self-citationCardiovascular Risk in Postmenopausal Women with Polycystic Ovary Syndrome
Armeni, E., & Lambrinoudaki, I. V. (2018) · Current Vascular Pharmacology · doi:10.2174/1570161116666180828154006 · Cited by 15
Sex-specific associations between erythrocyte measures and obstructive sleep apnea
Li, T., Covassin, N., Tan, L., Ren, R., Zhang, Y., Lei, F., Yang, L., Zhou, J., Sun, H., Somers, V. K., et al. (2020) · Journal of Clinical Sleep Medicine · doi:10.5664/jcsm.8398 · Cited by 13
Kokabiyan, Z., Yaghmaei, P., Jameie, S. B., & Hajebrahimi, Z. (2023) · Molecular Biology Reports · doi:10.1007/s11033-022-08108-3 · Cited by 13
Ferreira, D. L. S., Hübel, C., Herle, M., Abdulkadir, M., Loos, R. J. F., Bryant‐Waugh, R., Bulik, C. M., Stavola, B. L. D., Lawlor, D. A., & Micali, N. (2019) · Metabolites · doi:10.3390/metabo9090191 · Cited by 13
Self-citationThe role of cardiorespiratory fitness on quality of life in midlife women
Flesaker, M., Serviente, C. F., Troy, L. M., & Witkowski, S. (2021) · Menopause The Journal of The North American Menopause Society · doi:10.1097/gme.0000000000001719 · Cited by 14
Hübel, C., Herle, M., Ferreira, D. L. S., Abdulkadir, M., Bryant‐Waugh, R., Loos, R. J. F., Bulik, C. M., Lawlor, D. A., & Micali, N. (2021) · Scientific Reports · doi:10.1038/s41598-021-90644-2 · Cited by 13
Self-citationChen, Y., Wang, C., Sun, B., Wang, B., Lu, X., Gao, B., Cao, Y., Zhou, J., & Liu, X. (2023) · Frontiers in Endocrinology · doi:10.3389/fendo.2023.1034934 · Cited by 11
NRF2 deficiency increases obesity susceptibility in a mouse menopausal model
Wu, X., Huang, J. C., Shen, C., Liu, Y., He, S., Sun, J., & Yu, B. (2020) · PLoS ONE · doi:10.1371/journal.pone.0228559 · Cited by 11
The Menopausal Transition: Is the Hair Follicle “Going through Menopause”?
Rinaldi, F., Trink, A., Mondadori, G., Giuliani, G., & Pinto, D. (2023) · Biomedicines · doi:10.3390/biomedicines11113041 · Cited by 10
Reliability of Time-Series Plasma Metabolome Data over 6 Years in a Large-Scale Cohort Study
Miyake, A., Harada, S., Sugiyama, D., Matsumoto, M., Hirata, A., Miyagawa, N., Toki, R., Edagawa, S., Kuwabara, K., Okamura, T., et al. (2024) · Metabolites · doi:10.3390/metabo14010077 · Cited by 10
Early menopause, hysterectomy, and biological aging: Health and Retirement Study
Kim, J. K., & Crimmins, E. M. (2025) · Menopause The Journal of The North American Menopause Society · doi:10.1097/gme.0000000000002555 · Cited by 13
da Silva, T. C. A., Gonçalves, J. A. D. S., Souza, L. A. C. E., Lima, A. A., & Guerra‐Sá, R. (2022) · BMC Women s Health · doi:10.1186/s12905-022-02063-8 · Cited by 10
A potential association of meditation with menopausal symptoms and blood chemistry in healthy women
Sung, M.-K., Lee, U. S., Ha, N. H., Koh, E., & Yang, H. (2020) · Medicine · doi:10.1097/md.0000000000022048 · Cited by 10
Liu, X., Xu, J., Wei, D., & Chen, Y. (2022) · Obesity Facts · doi:10.1159/000528317 · Cited by 9
Xie, B., Li, M., Wang, Q., Fu, C., Wang, X., & Zhu, D. (2025) · npj Aging · doi:10.1038/s41514-025-00249-6 · Cited by 9
Self-citationInflammation proteomics datasets in the ALSPAC cohort
Goulding, N., Goudswaard, L. J., Hughes, D. A., Corbin, L. J., Groom, A., Ring, S. M., Timpson, N. J., Fraser, A., Northstone, K., & Suderman, M. J. (2022) · Wellcome Open Research · doi:10.12688/wellcomeopenres.18482.1 · Cited by 17
Altered activity of xenobiotic detoxifying enzymes at menopause – A cross-sectional study
Tsiokou, V., Kilindris, T. V., Begas, E., Kouvaras, E., Kouretas, D., & Asprodini, E. K. (2019) · Environmental Research · doi:10.1016/j.envres.2019.109074 · Cited by 9
Resistance Exercise Evokes Changes on Urinary Bladder Function and Morphology in Hypoestrogen Rats
Magaldi, F. M., Moreno, M., Magaldi, C. M., Cafarchio, E. M., Aronsson, P., Sato, M. A., & Maifrino, L. B. M. (2020) · Frontiers in Physiology · doi:10.3389/fphys.2019.01605 · Cited by 9
Clayton, G., Borges, M. C., & Lawlor, D. A. (2022) · medRxiv · doi:10.1101/2022.04.17.22273947 · Cited by 9
Self-citationKilpi, F., Soares, A. G., Clayton, G. L., Fraser, A., Welsh, P. I., Sattar, N. A., Nelson, S. M., Tilling, K. M., & Lawlor, D. A. (2022) · BMC Women s Health · doi:10.1186/s12905-022-02070-9 · Cited by 8
Self-citationA comparative study of orthorexia between premenopausal, perimenopausal, and postmenopausal women
Raynal, P., Soccodato, M., Fages, M., & Séjourné, N. (2022) · Eating and Weight Disorders - Studies on Anorexia Bulimia and Obesity · doi:10.1007/s40519-022-01392-9 · Cited by 8
Yu, W., Shao, B., Li, M., Zhang, P., Li, H., Teng, X., Wang, H., Su, G., Zhang, F., & Li, N. (2021) · Menopause The Journal of The North American Menopause Society · doi:10.1097/gme.0000000000001750 · Cited by 7
Lorenzo, L. D., Vimercati, L., Pipoli, A., Manghisi, N. M., Lampignano, L., Caputi, A., Maria, L. D., Zupo, R., & Pergola, G. D. (2021) · Frontiers in Public Health · doi:10.3389/fpubh.2021.649760 · Cited by 7
Cherifa, F. B., Ati, J. E., Doggui, R., Ati‐Hellal, M. E., & Ati‐Hellal, M. E. (2021) · International Journal of Environmental Research and Public Health · doi:10.3390/ijerph18105461 · Cited by 7
Poret, J. M., Guidry, J. J., Simon, L., & Molina, P. E. (2021) · Physiological Genomics · doi:10.1152/physiolgenomics.00001.2021 · Cited by 7
Sousa, S., Pestana, D., Faria, G. R., Delerue-Matos, C. M., Calhau, C., & Domingues, V. F. (2023) · Prostaglandins Leukotrienes and Essential Fatty Acids · doi:10.1016/j.plefa.2023.102581 · Cited by 6
Soh, G. T., Mohammad, A. H., Isa, S. N. L. S., Chin, K., & Mohamed, N. (2022) · Endocrine Metabolic & Immune Disorders - Drug Targets · doi:10.2174/1871530323666221114111029 · Cited by 6
Hall, W. L. (2024) · Proceedings of The Nutrition Society · doi:10.1017/s0029665124000181 · Cited by 7
The influence of menopause and cardiorespiratory fitness on lipoprotein particles in midlife women
Serviente, C. F., Chalvin, M., & Witkowski, S. (2021) · Applied Physiology, Nutrition, and Metabolism · doi:10.1139/apnm-2021-0081 · Cited by 7
Wang, N., Ockerman, F. P., Zhou, L. Y., Grove, M. L., Alkis, T., Barnard, J., Bowler, R. P., Clish, C. B., Chung, S., Drzymalla, E., et al. (2025) · The American Journal of Human Genetics · doi:10.1016/j.ajhg.2025.08.022 · Cited by 6
Impact of the natural female reproductive aging on the rat serum lipidome
Baudin, J., Antolín, A., Fernández‐Arroyo, S., Delpino-Rius, A., Mulero, F., Puiggròs, F., Arola, L., & Caimari, A. (2025) · Clinical Science · doi:10.1042/cs20255841 · Cited by 6
Fifteen years of epidemiology in BMC Medicine
Lawlor, D. A. (2019) · BMC Medicine · doi:10.1186/s12916-019-1407-5 · Cited by 5
Self-citationApolipoprotein E deficiency attenuated osteogenesis via down-regulating osterix
Qi, Q., Xu, Y., Sun, H., Zhou, J. C., Li, L., Pan, X., Wang, J., Cao, W., Sun, Y., & Wang, L. (2023) · Drug Discoveries & Therapeutics · doi:10.5582/ddt.2023.01026 · Cited by 5
Ермоленко, В. М. (2024) · Nephrology (Saint-Petersburg) · doi:10.36485/1561-6274-2024-28-1-13-29 · Cited by 6
Rashid, K. A., Taylor, A. E., Lumsden, M. A., Goulding, N., Lawlor, D. A., & Nelson, S. M. (2020) · F&S Science · doi:10.1016/j.xfss.2020.10.003 · Cited by 5
Self-citationEXOSOMES FROM CYCLIC MICE MODULATE LIVER TRANSCRIPTOME IN ESTROUPAUSE MICE INDEPENDENT OF AGE
Zanini, B. M., Ávila, B. M., Hense, J. D., Garcia, D. N., Ashiqueali, S., Alves, P. I. C., Oliveira, T. L., Collares, T. V., Brieño‐Enríquez, M. A., Mason, J. B., et al. (2024) · Molecular and Cellular Endocrinology · doi:10.1016/j.mce.2025.112508 · Cited by 3
Miyake, A., Iida, M., Harada, S., Sugiyama, D., Matsumoto, M., Miyagawa, N., Toki, R., Edagawa, S., Hirata, A., Kuwabara, K., et al. (2025) · The Journal of Clinical Endocrinology & Metabolism · doi:10.1210/clinem/dgaf666 · Cited by 3
Spousal associations of serum metabolomic profiles by nuclear magnetic resonance spectroscopy
Rashid, K. A., Goulding, N., Taylor, A. E., Lumsden, M. A., Lawlor, D. A., & Nelson, S. M. (2021) · Scientific Reports · doi:10.1038/s41598-021-00531-z · Cited by 4
Self-citationPatterson, J. S., Rana, B. K., Gu, H., & Sears, D. D. (2024) · Metabolites · doi:10.3390/metabo14090478 · Cited by 3
Valeanu, A., Margina, D. M., Weber, D., Stuetz, W., Moreno‐Villanueva, M., Dollé, M. E. T., Jansen, E. H. J. M., Gonos, E. S., Bernhardt, J. H., Grubeck‐Loebenstein, B., et al. (2024) · Mechanisms of Ageing and Development · doi:10.1016/j.mad.2024.111987 · Cited by 3
Katamesh, B. E., Varayil, J. E., Pillai, N., & Vincent, A. (2025) · Biomedicines · doi:10.3390/biomedicines13071558 · Cited by 2
Getz, M. J., Aronoff, J. E., Jenkins, C. L., Ghafoor, S., Vazquez, J., Appel, N., Gatz, M., Cummings, D. K., Hooper, P. L., Beheim, B., et al. (2025) · Evolution Medicine and Public Health · doi:10.1093/emph/eoaf020 · Cited by 2
Wang, Q., Xie, B., Fu, C., Li, M., Wang, X., Shrestha, N., Virani, S. S., Mishra, S. R., & Zhu, D. (2026) · npj Aging · doi:10.1038/s41514-025-00323-z · Cited by 2
Self-citationShcheglova, E., & Khidirova, L. (2026) · Vrach · doi:10.29296/25877305-2026-01-08 · Cited by 2
Wu, H., Jiang, S., Tu, L., Dong, M., Wu, L., Ai, Y., Liang, Y., Peng, Y., Sun, Q., & Xiao, Y. (2026) · Critical Reviews in Food Science and Nutrition · doi:10.1080/10408398.2026.2637561 · Cited by 2
Qi, M., Chen, X., Krauss, R. M., Matthews, K. A., Janssen, İ., Brooks, M. M., McConnell, D. S., Crawford, S. L., & Khoudary, S. R. E. (2022) · Menopause The Journal of The North American Menopause Society · doi:10.1097/gme.0000000000001998 · Cited by 2
The lipidome and proteome of high-density lipoprotein are altered in menopause
Lehti, S., Korhonen, T.-M. K., Soliymani, R., Ruhanen, H., Lähteenmäki, E. I., Palviainen, M., Siljander, P. R. M., Lalowski, M. M., Käkelä, R., Lehti, M., et al. (2025) · Journal of Applied Physiology · doi:10.1152/japplphysiol.00120.2025 · Cited by 2
Dehghanbanadaki, H., Mohammadian, M., Khalagi, K., Choobineh, H., Soltani, A., Shirkouhi, M. A., Rezaei–Tavirani, M., Shafiee, G., Ostovar, A., Bandarian, F., et al. (2025) · Journal of Diabetes & Metabolic Disorders · doi:10.1007/s40200-025-01710-9 · Cited by 1
TRANSIÇÃO CLIMATÉRICA E ALTERAÇÕES METABÓLICAS: IMPLICAÇÕES PARA A SAÚDE DA MULHER
Andrade, C. D. M. T., & Brandão, J. D. D. (2025) · Revista Contemporânea · doi:10.56083/rcv5n11-089 · Cited by 1
Zhan, Q., Li, M.-M., Chen, X., Feng, R.-Z., Ren, Q., & Du, Q. (2026) · Frontiers in Endocrinology · doi:10.3389/fendo.2026.1726161 · Cited by 1
Kurç, D., & Berg, A. N. T. V. D. (2026) · BMC Women s Health · doi:10.1186/s12905-026-04457-4 · Cited by 1
Avaliação de dislipidemia e risco cardiovascular em mulheres no climatério
Gouvea, T. M., Serpa, M. A., Lopes, A. C. F., Veloso, V. M., Carrillo, M. R. G. G., & Lima, A. A. (2020) · Disciplinarum Scientia. Série Ciências da Saúde · doi:10.37777/dscs.v21n2-026 · Cited by 1
Metadata
- Authors
- Wang, Q., Ferreira, D. L. S., Nelson, S. M., Sattar, N., Ala-Korpela, M., & Lawlor, D. A.
- Affiliations
- University of Oulu (FI)
- University of Bristol (GB)
- University of Glasgow (GB)
- Corresponding author
- Lawlor, Debbie A.
- Venue
- BMC Medicine
- Published
- 2018-02-06
- Volume
- 16
- Issue
- 1
- Pages
- 17-17
- ISSN
- 1741-7015 (ISSN-L)
- PMC
- PMC5800033
- OpenAlex
- W2757552189
- Cited by
- 134
- References
- 48
- Citations by year
- 2026: 10 · 2025: 15 · 2024: 14 · 2023: 18 · 2022: 23 · 2021: 20 · 2020: 18 · 2019: 12 · 2018: 4
- FWCI
- 10.75
- Type
- journal article
- Language
- en
- Open access
- gold
- doi.org
- Licence
- cc-by
- Locations
- BMC Medicine (publishedVersion, cc-by)
- bioRxiv (Cold Spring Harbor Laboratory) (acceptedVersion, cc-by-nc-nd)
- PubMed Central (publishedVersion, cc-by)
- PubMed (publishedVersion)
- Bristol Research (University of Bristol) (publishedVersion, cc-by)
- ENLIGHTEN (Jurnal Bimbingan dan Konseling Islam) (acceptedVersion, cc-by-sa)
- UEF eRepo (University of Eastern Finland) (submittedVersion, cc-by)
- DOAJ (DOAJ: Directory of Open Access Journals) (submittedVersion, cc-by-sa)
- Explore Bristol Research (submittedVersion, cc-by)
- Funders
- British Heart Foundation (SP/07/008/24066)
- Wellcome (WT092830M)
- UK Medical Research Council (G1001357)
- Topics
- Health Sciences › Medicine › Endocrinology, Diabetes and Metabolism › Menopause: Health Impacts and Treatments
- Health Sciences › Medicine › Endocrinology, Diabetes and Metabolism › Diabetes, Cardiovascular Risks, and Lipoproteins
- Health Sciences › Medicine › Endocrinology, Diabetes and Metabolism › Hormonal and reproductive studies
- Keywords
- menopause, perimenopause, metabolic biomarkers, cardiometabolic risk, ovarian aging, chronological aging, lipoprotein profile, atherogenic lipoproteins, LDL particle size, remnant cholesterol, inflammation, glycoprotein acetyls, glutamine, albumin, postmenopausal women
- MeSH terms
- Adult, Aged, Cross-Sectional Studies, Female, Humans, Longitudinal Studies, Menopause, Middle Aged
About these checks
Registry, retraction, Cites and statistics results are computed, not judged, with one exception: a printed reference that no index lists is read once by a model before it counts as a citation error. Claims are extracted by a model and kept only when their quote appears verbatim in the text; each cited source is then checked, with a model’s help, for whether it says what the claim relies on. Those verdicts can be wrong — read the claim’s quote and the cited source before relying on one.
Statistics and arithmetic are recomputed, not judged.
Confidence bands are shown only for fields calibrated on our annotated test set. None is calibrated yet, so no band is shown.
What counts as a claim ›How we measure confidence ›How we check this ›
Are you an author, or do you see a problem with this page? Request a review
