

The DOI matches its Crossref record; 98 of the 111 references it cites were found in a registry or an index.
Performance of the Framingham risk models and pooled cohort equations for predicting 10-year risk of cardiovascular disease: a systematic review and meta-analysis
Open accessAbstract
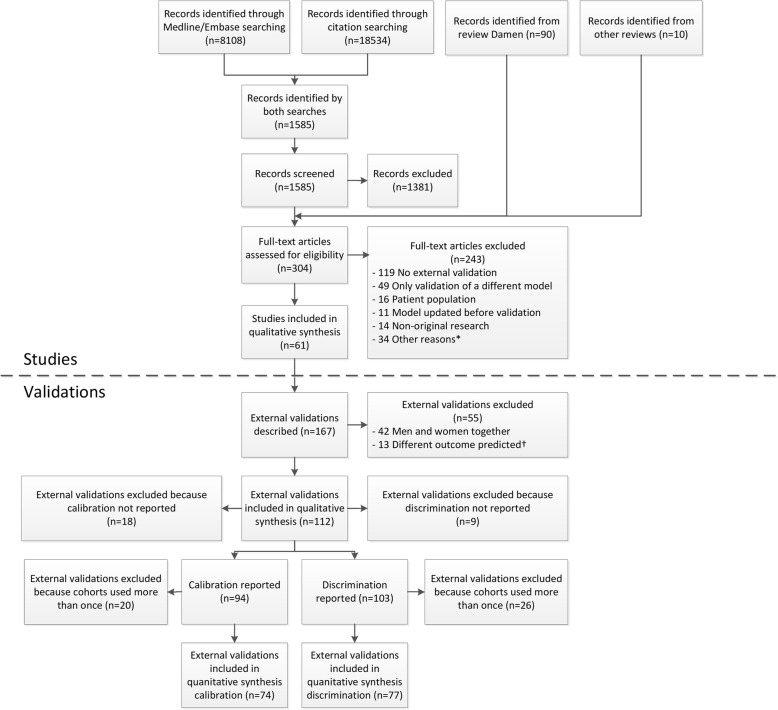
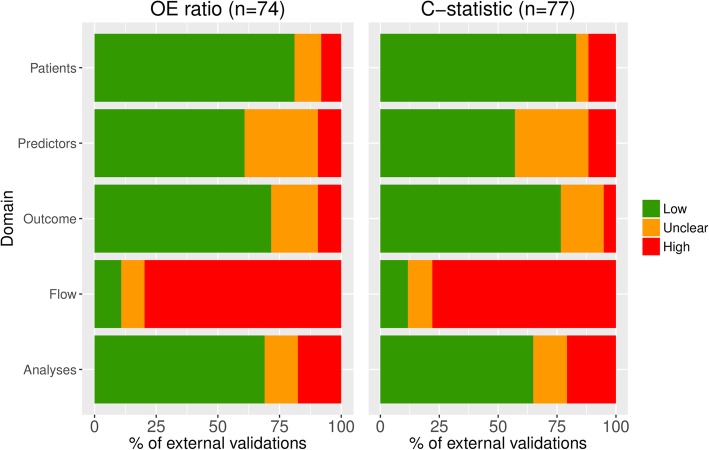
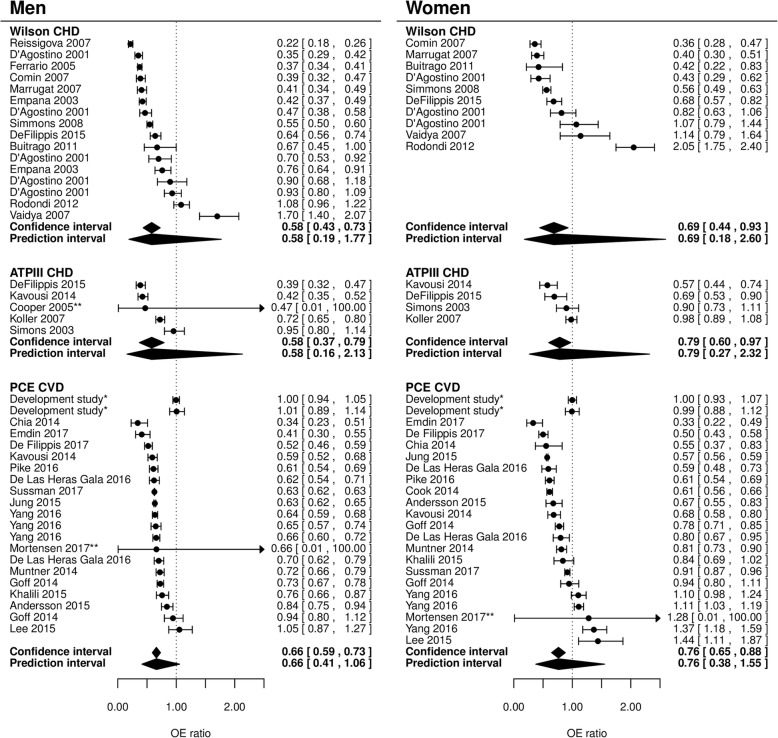
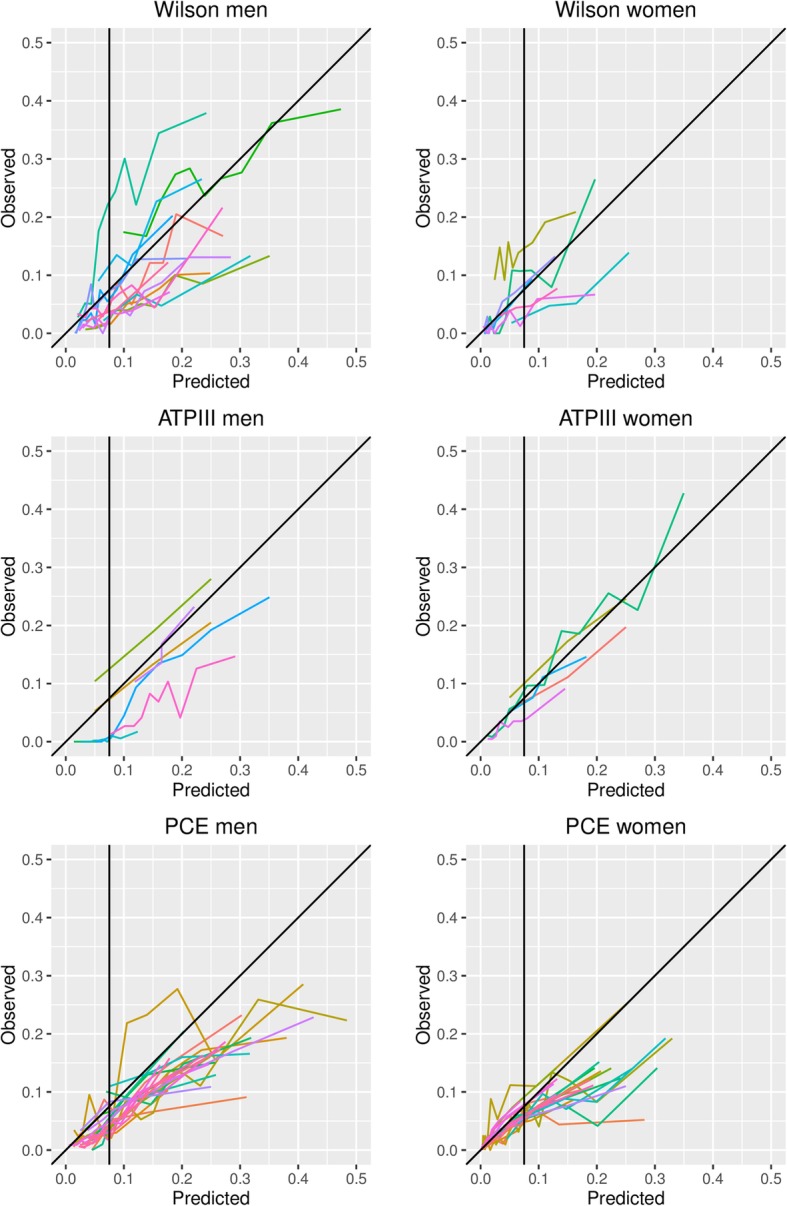
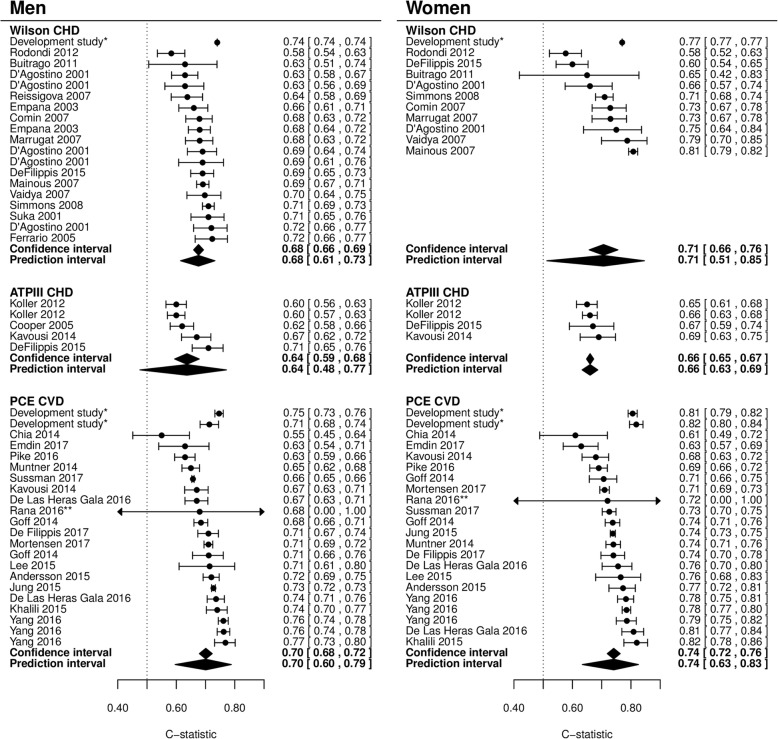
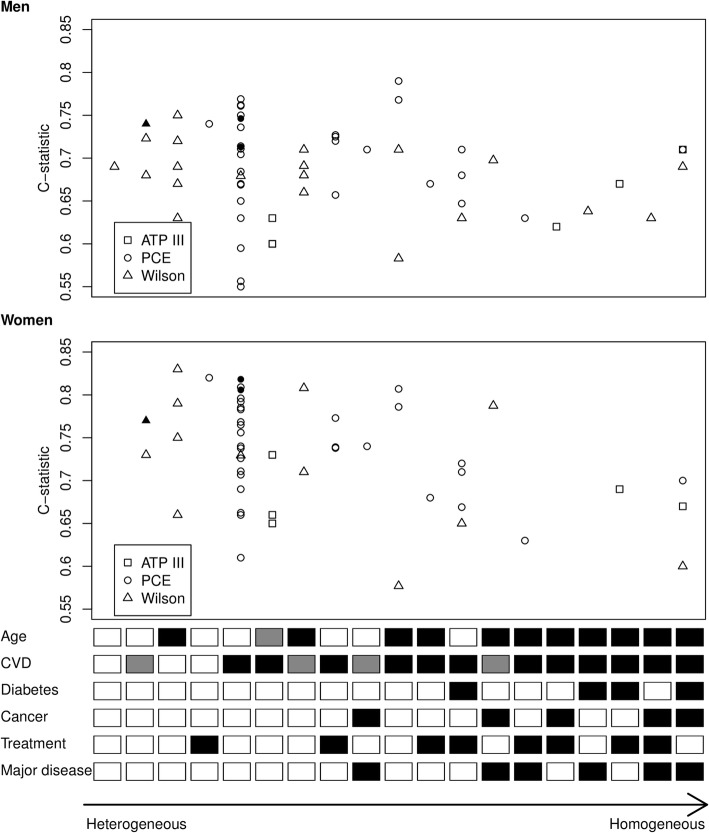
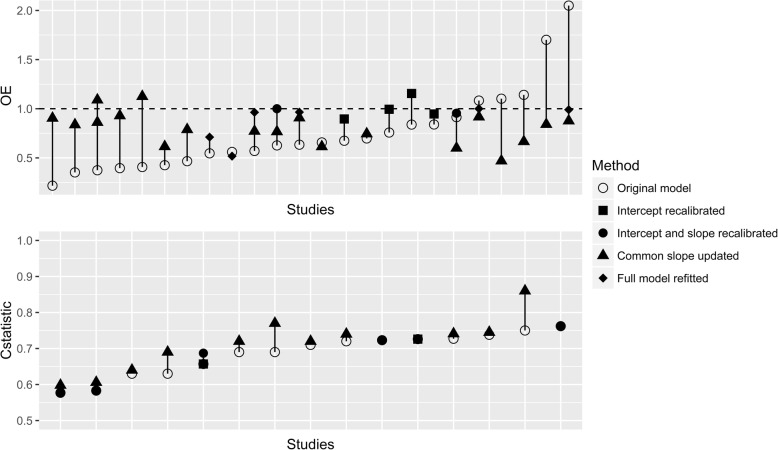
BACKGROUND: The Framingham risk models and pooled cohort equations (PCE) are widely used and advocated in guidelines for predicting 10-year risk of developing coronary heart disease (CHD) and cardiovascular disease (CVD) in the general population. Over the past few decades, these models have been extensively validated within different populations, which provided mounting evidence that local tailoring is often necessary to obtain accurate predictions. The objective is to systematically review and summarize the predictive performance of three widely advocated cardiovascular risk prediction models (Framingham Wilson 1998, Framingham ATP III 2002 and PCE 2013) in men and women separately, to assess the generalizability of performance across different subgroups and geographical regions, and to determine sources of heterogeneity in the findings across studies. METHODS: A search was performed in October 2017 to identify studies investigating the predictive performance of the aforementioned models. Studies were included if they externally validated one or more of the original models in the general population for the same outcome as the original model. We assessed risk of bias for each validation and extracted data on population characteristics and model performance. Performance estimates (observed versus expected (OE) ratio and c-statistic) were summarized using a random effects models and sources of heterogeneity were explored with meta-regression. RESULTS: The search identified 1585 studies, of which 38 were included, describing a total of 112 external validations. Results indicate that, on average, all models overestimate the 10-year risk of CHD and CVD (pooled OE ratio ranged from 0.58 (95% CI 0.43-0.73; Wilson men) to 0.79 (95% CI 0.60-0.97; ATP III women)). Overestimation was most pronounced for high-risk individuals and European populations. Further, discriminative performance was better in women for all models. There was considerable heterogeneity in the c-statistic between studies, likely due to differences in population characteristics. CONCLUSIONS: The Framingham Wilson, ATP III and PCE discriminate comparably well but all overestimate the risk of developing CVD, especially in higher risk populations. Because the extent of miscalibration substantially varied across settings, we highly recommend that researchers further explore reasons for overprediction and that the models be updated for specific populations.
Overview
Integrity signals
Registry
Cites
Statistics
Figures
Verification
Claims the paper makes
Claims other papers make about this one
Each is checked against this paper’s own text: does it say what the citing paper says it does?
In the citing paper
“Furthermore, the Framingham predicted 10-year CVD risk equations are well accepted and widely used in clinical practice.28”
From Tirzepatide compared with semaglutide and 10-year cardiovascular disease risk reduction in obesity: post-hoc analysis of the SURMOUNT-5 trial (2025) · cites this paper as [28]
Citations
Cites
Fitting Linear Mixed-Effects Models Using lme4
Bates, D., Mächler, M., Bolker, B., & Walker, S. (2015) · Journal of Statistical Software · doi:10.18637/jss.v067.i01 · Cited by 86,835
Conducting Meta-Analyses in R with the metafor Package
Viechtbauer, W. (2010) · Journal of Statistical Software · doi:10.18637/jss.v036.i03 · Cited by 20,464
2013 ACCF/AHA Guideline for the Management of Heart Failure
Yancy, C. W., Jessup, M., Bozkurt, B., Butler, J., Casey, D. E., Drazner, M. H., Fonarow, G. C., Geraci, S. A., Horwich, T., Januzzi, J. L., et al. (2013) · Journal of the American College of Cardiology · doi:10.1016/j.jacc.2013.05.019 · Cited by 12,536
Prediction of coronary heart disease using risk factor categories
Wilson, P. W. F., D’Agostino, R. B., Levy, D., Belanger, A. M., Silbershatz, H., & Kannel, W. B. (1998) · Circulation · doi:10.1161/01.cir.97.18.1837 · Cited by 9,581
Stone, N. J., Robinson, J. G., Lichtenstein, A. H., Bairey Merz, C. N., Blum, C. B., Eckel, R. H., Goldberg, A. C., Gordon, D., Levy, D., Lloyd-Jones, D. M., et al. (2014) · Circulation · doi:10.1161/01.cir.0000437738.63853.7a · Cited by 7,081
Estimation of ten-year risk of fatal cardiovascular disease in Europe: the SCORE project
Conroy, R. (2003) · European Heart Journal · doi:10.1016/s0195-668x(03)00114-3 · Cited by 5,290 · cited 3×
“We did not include other prediction models such as the SCORE [21] or QRISK [22] models in this review, as these were developed on European populations and we wanted to focus on truly competing models for the American population.”
MethodMoons, K. G. M., Altman, D. G., Reitsma, J. B., Ioannidis, J. P. A., Macaskill, P., Steyerberg, E. W., Vickers, A. J., Ransohoff, D. F., & Collins, G. S. (2015) · Annals of Internal Medicine · doi:10.7326/m14-0698 · Cited by 5,147
Self-citation2013 ACC/AHA Guideline on the Assessment of Cardiovascular Risk
Goff, D. C., Lloyd-Jones, D. M., Bennett, G., Coady, S., D’Agostino, R. B., Gibbons, R., Greenland, P., Lackland, D. T., Levy, D., O’Donnell, C. J., et al. (2014) · Journal of the American College of Cardiology · doi:10.1016/j.jacc.2013.11.005 · Cited by 4,945
Stone, N. J., Robinson, J. G., Lichtenstein, A. H., Bairey Merz, C. N., Blum, C. B., Eckel, R. H., Goldberg, A. C., Gordon, D., Levy, D., Lloyd-Jones, D. M., et al. (2014) · Journal of the American College of Cardiology · doi:10.1016/j.jacc.2013.11.002 · Cited by 3,845
Research works printed but not linked: 6
- Beswick AD, Brindle P, Fahey T, Ebrahim S. A systematic review of risk scoring methods and clinical decision aids used in the primary prevention of coronary heart disease (supplement). London: Royal College of General Practitioners; 2008.
- Harrell F. Regression modeling strategies: with applications to linear models, logistic and ordinal regression, and survival analysis. Switzerland: Springer; 2015. · DOI · Paper page
- Debray TP. Metamisc: Diagnostic and Prognostic Meta-Analysis; 2017.
- Marrugat J, Subirana I, Comin E, Cabezas C, Vila J, Elosua R, Nam BH, Ramos R, Sala J, Solanas P, et al. Validity of an adaptation of the Framingham cardiovascular risk function: the VERIFICA Study. J Epidemiol Community Health. 2007;61(1):40–7. · DOI
- Knottnerus JA. Diagnostic prediction rules: principles, requirements and pitfalls. Prim Care. 1995;22(2):341–63. · DOI · Paper page
- Goff DC Jr, D’Agostino RB Sr, Pencina M, Lloyd-Jones DM. Calibration and discrimination among multiple cardiovascular risk scores in a modern multiethnic cohort. Ann Intern Med. 2015;163(1):68. · DOI
Cited by
Sorted by citations
Items 101–200 of 221
Vaghefi, E., Squirrell, D., Yang, S., An, S., & Marshall, J. (2022) · medRxiv · doi:10.1101/2022.10.12.22281017 · Cited by 11
“…review and meta-analysis found that the Framingham-based risk models and pooled cohort equations for predicting 10-year risk of CVD not only had a tendency to overestimate the risk level, especially in higher-risk populations [16], they prove unreliable for people living with diabetes [17].”
BackgroundAdikari, D., Gharleghi, R., Zhang, S., Jorm, L. R., Sowmya, A., Moses, D. A., Ooi, S., & Beier, S. (2022) · BMJ Open · doi:10.1136/bmjopen-2021-054881 · Cited by 6
New prevention scenarios: polygenic risk
Boccanelli, A., & Bottà, G. (2021) · European Heart Journal Supplements · doi:10.1093/eurheartj/suab093 · Cited by 5
“Several countries have developed models based on more or less large populations, with local characteristics, in some cases also considering the ancestral origin of individuals.(2) The best known predictive risk models are the European SCORE, the Italian Heart Card and the Framingham, later replaced by pooled cohort eq…”
BackgroundSaumoy, M., Yacovo, S. D., Pérez, S., Sánchez‐Quesada, J., Valdivielso, J. M., Subirana, I., Imaz, A., Tiraboschi, J. M., García, B., Ordóñez‐Llanos, J., et al. (2021) · HIV Medicine · doi:10.1111/hiv.13093 · Cited by 6
Possible Approaches to Primary Prevention of Cardiovascular Diseases
Larina, V. N., Mkrtychev, D. S., Кузнецова, В. А., & Tyazhelnikov, A. A. (2020) · Rational Pharmacotherapy in Cardiology · doi:10.20996/1819-6446-2020-10-12 · Cited by 5
“Кроме того, данные шкалы имели более высокую точность у женщин, поэтому авторы рекомендуют пересмотр шкал для некоторых групп пациентов с целью более точной оценки прогноза [19].”
Quach, J., Theou, O., Maxwell, S. P., Abidi, S. S. R., Song, X., Rockwood, K. J., & Kehler, D. S. (2026) · Ageing Research Reviews · doi:10.1016/j.arr.2026.103122 · Cited by 4
Isgut, M., Hornback, A. M., Bao, H., Sun, Y., Choi, K., Anderson, B. J., Deshpande, S. R., Chang, A., & Wang, M. D. (2025) · Communications Medicine · doi:10.1038/s43856-025-01138-5 · Cited by 6
Cardiovascular Risk Assessment via Sleep Patterns and ECG-Based Biological Age Estimation
Manimaran, G., Puthusserypady, S. K., Domínguez, H., & Bardram, J. E. (2025) · Journal of Clinical Medicine · doi:10.3390/jcm14103339 · Cited by 3
“To evaluate the clinical utility of our derived biological age metric, we compared its performance to the established Framingham Risk variables [23,24].”
Cho, S. M. J., Rivera, R., Koyama, S., Kim, M. S., Ganesh, S., Bhattacharya, R., Paruchuri, K., Masson, P. R., Honigberg, M. C., Allen, N. B., et al. (2024) · JACC Advances · doi:10.1016/j.jacadv.2024.101257 · Cited by 6
Woolley, J. J., Fishman, J., Parrinello, C. M., & O’Connell, T. (2024) · PLoS ONE · doi:10.1371/journal.pone.0309617 · Cited by 6
Association of cardiac biomarkers with long-term cardiovascular events in a community cohort
Churchill, R., Gochanour, B. R., Scott, C. G., Vasile, V. C., Rodeheffer, R. J., Meeusen, J. W., & Jaffe, A. S. (2024) · Biomarkers · doi:10.1080/1354750x.2024.2335245 · Cited by 5
“Non-hDl-c has been incorporated into established cV risk algorithms (chia et al. 2014; Rana et al. 2016; Damen et al. 2019). the clinical value of apoB in primary prevention has emerged over the past decade, due in part to its inclusion into atherosclerotic lesions as a component of lDl-c and…”
MethodGeneralizable Model Design for Clinical Event Prediction using Graph Neural NetworksPreprint
Tariq, A., Kaur, G., Su, L., Gichoya, J. W., Patel, B. N., & Banerjee, I. (2023) · medRxiv · doi:10.1101/2023.03.22.23287599 · Cited by 2
“Research has shown that comprehensive models using a wide variety of EHR outperform models using curated features 13 .”
BackgroundThe Use of Screening Tools for Cardiovascular Risk Assessment in Psoriasis – A Case- Control Study
Neema, S., Sandhu, S., Vasudevan, B., Vendhan, D. S., Sinha, A., Tripathy, D., & Patrikar, S. (2022) · Indian Dermatology Online Journal · doi:10.4103/idoj.idoj_421_21 · Cited by 4
“A systematic review and meta‐analysis of 10 years of risk assessment using FRS and PCE suggested that these scoring systems overestimate the risk, especially in high‐risk individuals.[27] Another overview of the systematic review comparing the total risk assessment to the standard care concluded that there is no effec…”
BackgroundBurns, R. B., Pignone, M. P., Michos, E. D., & Kanjee, Z. (2021) · Annals of Internal Medicine · doi:10.7326/m21-2596 · Cited by 4
“However, it is based on representative cohorts in the United States, including a moderate number of Black Americans, and offers a good starting point for prevention decisionmaking in most cases (15).”
BackgroundSheikh, A., Nurmatov, U. B., Al-Katheeri, H. A., & Huneiti, R. A. (2021) · Qatar medical journal · doi:10.5339/qmj.2021.42 · Cited by 5
“14,15, 77 Most reviews concluded that there is now an abundance of cardiovascular risk calculators, but reported difficulty in deciding which is most appropriate to use.”
BackgroundCardiovascular disease and all-cause mortality risk prediction from abdominal CT using deep learning
Elton, D. C., Chen, A., Pickhardt, P., & Summers, R. M. (2021) · Medical Imaging · doi:10.1101/2021.08.30.21262686 · Cited by 4
“A 2019 meta-analysis compared three popular risk models for predicting 10-year CVD risk - the FRS, Framingham Adult Treatment Panel III model, and pooled cohort model.(10) They found modest C-statistics ranging between 0.”
MethodForte, J. C., Folkertsma, P., Gannamani, R., Kumaraswamy, S., Mount, S. W., de Koning, T. J., van Dam, S., & Wolffenbuttel, B. H. R. (2021) · Journal of Personalized Medicine · doi:10.3390/jpm11121322 · Cited by 5
Ing, C. T., Ahn, H. J., Kawakami, R., Grandinetti, A., Seto, T. B., & Kaholokula, J. K. (2020) · Journal of Racial and Ethnic Health Disparities · doi:10.1007/s40615-020-00851-2 · Cited by 6
Lim, C. G. Y., Chong, C. C. Y., Wong, Y. H. M., Yao, J., Ma, S., Chambers, J. C., Yeo, K. K., Tai, E. S., Tromp, J., van Dam, R. M., et al. (2026) · The Lancet Regional Health - Western Pacific · doi:10.1016/j.lanwpc.2025.101794 · Cited by 3
“29,30 Beyond discrimination and calibration, the decision curve analysis further demonstrated the clinical utility of the three models.”
Perezalonso-Espinosa, J., Ramírez‐García, D., Díaz-Sánchez, J. P., Carrillo-Herrera, K. B., Cabrera-Quintana, L. A., Dávila-López, G., Fermín‐Martínez, C. A., Liceaga, A. M., Basile‐Alvarez, M. R., Berumen-Campos, J., et al. (2026) · The Lancet Regional Health - Americas · doi:10.1016/j.lana.2026.101403 · Cited by 5
Song, Y., Xu, N., Zheng, J., Jia, S., Cui, C., Zhang, Y., Gao, L., Gao, Z., Chen, J., Song, L., et al. (2025) · Circulation Cardiovascular Imaging · doi:10.1161/circimaging.125.018443 · Cited by 5
Xu, Y., Yu, Y., Ding, X., Yuan, J., Yu, L., Dai, X. D., Ling, R., Wang, Y., & Zhang, J. (2025) · Cardiovascular Diabetology · doi:10.1186/s12933-025-02934-y · Cited by 3
“This model has served as the basis for numerous subsequent studies on predictive models for CAD prognosis [6, 7].”
From Innovation to Implementation: Is PREVENT Ready for Clinical Practice?
Lu, Y., & Nasir, K. (2025) · Journal of the American College of Cardiology · doi:10.1016/j.jacc.2025.05.031 · Cited by 3
Geraci, G., Sorce, A., Zanoli, L., Calabrese, V., Cuttone, G., Mattina, A., Ferrara, P., Domínguez, L. J., Polosa, R., Mulè, G., et al. (2025) · High Blood Pressure & Cardiovascular Prevention · doi:10.1007/s40292-025-00714-z · Cited by 3
“Both the FS and ASCVD have been developed from longitudinal trial data and are capable of estimating the 10-year risk of CV diseases [5, 10, 11].”
The reporting quality and methodological quality of dynamic prediction models for cancer prognosis
Yan, P., Xu, Z., Xu, H., Chu, X., Chen, Y., Yang, C., Xu, S., Cui, H., Zhang, L., Zhang, W., et al. (2025) · BMC Medical Research Methodology · doi:10.1186/s12874-025-02516-2 · Cited by 3
Carotid Plaque-Burden scale and outcomes: A real-life study
Sánchez‐Bacaicoa, C., Rico‐Martín, S., Costo-Muriel, C., Ortega-Collazos, E., Sánchez-Lozano, M., Sánchez-Bacaicoa, M., Galán‐González, J., García, J. F. C., & Muñoz-Torrero, J. F. S. (2024) · Medicina Clínica · doi:10.1016/j.medcli.2024.10.009 · Cited by 1
Jülicher, P., Makarova, N., Ojeda, F., Giusepi, I., Peters, A., Thorand, B., Cesana, G., Jørgensen, T., Linneberg, A. R., Salomaa, V. V., et al. (2024) · PLoS ONE · doi:10.1371/journal.pone.0307468 · Cited by 3
Cao, Q., Li, H., Xinyu, P. A. N., Yuhan, W. A. N. G., Zhang, P., He, L., Wang, J., Huang, M., & Xu, F. (2024) · Clinical Medicine & Research · doi:10.3121/cmr.2024.1846 · Cited by 1
“…diagnostic value of BEFAST in acute ischemic stroke was higher than in FAST .29 The Framingham Wilson, ATP (Adult Treatment Panel) III and PCE all have an overestimate of the risk of CVD, 30 but the Framingham Wilson scale could be considered the gold standard when used together with QRISK Score.”
InfluentialKrstačić, G., Jülicher, P., Krstačić, A., & Varounis, C. (2024) · International Journal of Cardiology Cardiovascular Risk and Prevention · doi:10.1016/j.ijcrp.2024.200244 · Cited by 2
“Most of which are based on various risk algorithms derived from large cohort studies, such as the Framingham Risk Score, Q-Risk, or the recently updated SCORE (Systematic Coronary Risk Evaluation) risk calculator [9 – 12].”
MethodXu, G., Wang, Z., Yu, C., Amin, B., Du, D., Li, T., Chen, G., Wang, L., Li, Z., Chen, W., et al. (2023) · Diabetes Metabolic Syndrome and Obesity · doi:10.2147/dmso.s389346 · Cited by 4
“19–21 In 2019, the WHO CVD Risk Chart Working Group reported the WHO CVD risk charts, which can be adjusted by region when calculating CVD risk.”
Saunders, T. S., Protsiv, M., Jenkins, N. D., Solomon, A., Blennow, K., Ritchie, C. W., & Terrera, G. M. (2023) · The Journal of Prevention of Alzheimer s Disease · doi:10.14283/jpad.2023.31 · Cited by 3
Price, D. B., & BOURDIN, A. A. (2022) · EMJ Respiratory · doi:10.33590/emjrespir/10088956 · Cited by 3
“42 Modelling and measurement tools to predict risk have been successfully embedded in clinical medicine for a number of conditions associated with high morbidity and mortality, including cardiovascular disease (CVD), 43,44 T2D, 45 and osteoporosis.”
Ying, S., Zhang, Y.-C., Zhao, Y.-P., Lu, Y.-F., Chen, B.-W., Yang, L.-Q., Tan, C., Bai, Y., Sang, Y., Liu, J.-H., et al. (2022) · Frontiers in Cardiovascular Medicine · doi:10.3389/fcvm.2022.967097 · Cited by 3
Špacírová, Z., Kaptoge, S. K., García‐Mochón, L., Barranco, M. R., Pérez, M. J. S., Bondonno, N. P., Tjønneland, A. M., Weiderpass, E., Grioni, S., Espín, J., et al. (2022) · The European Journal of Health Economics · doi:10.1007/s10198-022-01533-y · Cited by 3
“Risk algorithms are imperfect predictors of CVD [42].”
BackgroundSelf-citationXu, Y.-Z., Foryciarz, A., Steinberg, E., & Shah, N. (2022) · J. Am. Medical Informatics Assoc. · doi:10.1093/jamia/ocad017 · Cited by 3
Application of epidemiological findings to individuals
Boffetta, P., Farioli, A., & Rizzello, E. (2020) · La Medicina del Lavoro · doi:10.23749/mdl.v111i1.9055 · Cited by 4
“Tuttavia, un’ampia letteratura ha suggerito che la validità esterna della formula potrebbe essere limitata (ad esempio (27)); in particolare, in alcune popolazioni è stata osservata una sovrastima del rischio (5).”
BackgroundA New Weighted Ensemble Model to Improve the Performance of Software Project Failure Prediction
Ibraigheeth, M., AbuEid, A. I., Alsariera, Y., Awwad, W. F., & Nawaz, M. A. (2024) · International Journal of Advanced Computer Science and Applications · doi:10.14569/ijacsa.2024.0150238 · Cited by 3
“These methods were chosen because they showed a high efficiency in failure prediction compared with other methods in a study conducted by Ibraigheeth and Eid [6].”
ResultGrewal, S., Wildish, J. E., Chalmers, C., Dedding, C. W. M., Suurmond, J., Agyemang, C. O., & Grewal, N. (2026) · International Journal of Environmental Research and Public Health · doi:10.3390/ijerph23020241 · Cited by 2
“Their performance drops significantly in individuals from under-represented backgrounds, leading to both under-treatment and over-treatment [63,64].”
The Russian prognostic scale "PHOENIX" — a novel domestic tool for cardiovascular risk assessment
Drapkina, O. M., Shalnova, S. A., Balanova, Y. А., Kutsenko, V. A., Имаева, А. Э., Владимировна, К. А., Евстифеева, С. Е., Аркадьевна, М. Г., Ильинична, Г. Л., Maksimov, S. A., et al. (2025) · CARDIOVASCULAR THERAPY AND PREVENTION · doi:10.15829/1728-8800-2025-4510 · Cited by 2
Lieslehto, J., Tiihonen, J., Lähteenvuo, M., Kautzky, A., Akhtar, A., Amin, R., Ármannsdóttir, B., Leucht, S., Correll, C. U., Mittendorfer‐Rutz, E., et al. (2025) · Molecular Psychiatry · doi:10.1038/s41380-025-03316-2 · Cited by 3
“In other medical fi elds, models such as the Framingham risk score routinely guide risk strati fi cation and treatment [6]; however, similar advancements in bipolar disorder (BD) treatment are lacking.”
Atherosclerotic Cardiovascular Disease Risk Assessment in the Age of PREVENT
Brar, S., Chakrabarti, A., & Yang, E. (2025) · Current Epidemiology Reports · doi:10.1007/s40471-025-00371-9 · Cited by 2
“In 1998, an algorithm was created using data from Fram - ingham participants aged 30 to 74 that incorporated variables such as BP, total cholesterol, low-density lipoprotein (LDL)-cholesterol, and high-density lipoprotein (HDL)- cholesterol to predict coronary heart disease (CHD) [ 10].”
Honda, T., Furuta, Y., Maezono, A., Chen, S., Ishida, Y., Furuhashi, H., Kumamoto, M., Oishi, E., Kimura, Y., Yoshida, D., et al. (2025) · Journal of the American Heart Association · doi:10.1161/jaha.124.040386 · Cited by 2
“27 In addition, the substituted and refit models showed sufficient calibration, discrimination, and clinical usefulness, indicating the limited benefit of refitting the regression equation.”
Chen, X., Li, Z. Y., Fan, X., Yan, Y., & Liu, S. (2025) · BMC Cardiovascular Disorders · doi:10.1186/s12872-025-04786-6 · Cited by 2
Ban, J.-W., Abel, L., Stevens, R., & Perera, R. (2024) · PLoS ONE · doi:10.1371/journal.pone.0310321 · Cited by 2
When Does Primary Prevention Encroach on Secondary Prevention?
Deshotels, M. R., Kotta, P. A., Mesa, J. S. R., Oyenubi, O., & Nambi, V. (2024) · Current Atherosclerosis Reports · doi:10.1007/s11883-024-01227-1 · Cited by 2
“The PCE has several limitations: it is only applicable to white and black US adults aged 40–79 years and could over-or underestimate risk in some populations [18–20].”
Estimating risk of loneliness in adulthood using survey-based prediction models: A cohort study
Elovainio, M. J., Airaksinen, J., Nyberg, S. T., Pentti, J., Pulkki-Råbäck, L., Cachón-Alonso, L., Suvisaari, J., Jääskeläinen, T., Koskinen, S. V. P., Mika Kivimaki, B., et al. (2024) · Journal of Psychiatric Research · doi:10.1016/j.jpsychires.2024.06.030 · Cited by 4
Alketbi, L., Nagelkerke, N., Alshamsi, N., AlFahmawi, F., Abdulbaqi, H., Fahmawee, T., Sahala, Y., AlHashaikeh, B., AlKetbi, R., AlShamsi, M., et al. (2024) · medRxiv · doi:10.1101/2024.03.19.24304561 · Cited by 2
“In fact, a recent systematic review and meta-analysis found considerable heterogeneity in risk among studies and populations (3).”
BackgroundSheridan, S. (2023) · Patient Education and Counseling · doi:10.1016/j.pec.2023.107806 · Cited by 2
Lira, M. T. (2022) · Revista Médica Clínica Las Condes · doi:10.1016/j.rmclc.2022.08.003 · Cited by 4
Vaghefi, E., Squirrell, D., An, S.-Y., Yang, S., & Marshall, J. (2022) · arXiv.org · doi:10.48550/arxiv.2207.14685 · Cited by 2
“…review and meta-analysis found that the Framingham-based risk models and pooled cohort equations for predicting 10-year risk of CVD not only had a tendancy to overestimate the risk level, especially in higher-risk populations [16], they prove unreliable for people living with diabetes [17].”
BackgroundEklund, S. A., Israelsson, H., Carlberg, B., & Malm, J. (2022) · Journal of neurosurgery · doi:10.3171/2022.4.jns22125 · Cited by 5
Adjaye-Gbewonyo, K., & Cois, A. (2022) · BMJ Open · doi:10.1136/bmjopen-2022-061034 · Cited by 2
Kanwar, M. K., Cole, M. R., Gauthier‐Loiselle, M., Manceur, A. M., Tsang, Y., Lefèbvre, P., Panjabi, S. S., & Benza, R. L. (2021) · Current Medical Research and Opinion · doi:10.1080/03007995.2021.1947215 · Cited by 2
Moral, I., Cuixart, C. B., Valverde, D. F., Puig‐Asensio, M., Bonacho, E. C., Muñoz, P., Romero, C. C., & Quevedo-Aguado, L. (2021) · Revista Clínica Española · doi:10.1016/j.rce.2020.12.008 · Cited by 2
Domingues, V. D. S., Rodrigues, A. M., Dias, S. S., Delgado, L., Barkoudah, E., Branco, J., & Canhão, H. M. (2021) · Rheumatology International · doi:10.1007/s00296-020-04754-7 · Cited by 2
Statin Treatment in Specific Patient Groups: Role for Improved Cardiovascular Risk Markers
White, A. M. B., Mishcon, H. R., Redwanski, J. L., & Hills, R. D. (2020) · Journal of Clinical Medicine · doi:10.3390/jcm9113748 · Cited by 2
“5% risk threshold to 10% for primary prevention [6,55,61].”
BackgroundMetabolic Syndrome: Impact of Dietary Therapy
Fouad, S. (2020) · IntechOpen eBooks · doi:10.5772/intechopen.90835
“The Framingham risk scoring is used to classify metabolic syndrome patients into three risk categories based on a 10-year risk for coronary heart disease, cerebrovascular disease, peripheral artery disease, and heart failure risk: low-risk (10-year risk <10%), moderate-risk (10-year risk 10–20%), and high-risk patient…”
MethodPhillips, S., & Han, H. (2026) · Open Heart · doi:10.1136/openhrt-2026-004228 · Cited by 1
Amorocho-Morales, J. D., Guevara, S. P., Quintero-Muñoz, E., Dimas, G., & Correa‐Morales, J. E. (2026) · International Journal of Cardiology Cardiovascular Risk and Prevention · doi:10.1016/j.ijcrp.2026.200659
“In response to evolving epidemiological patterns and the limitations of traditional cardiovascular risk models, newer and more comprehensive approaches to risk prediction have emerged [4].”
Insomnia and Incident Cardiovascular Disease in US Hispanic/Latino Adults: Results From HCHS/SOL
Lü, W., Wang, Y. B., Wu, S., Wang, M., Huang, J., Tang, X., Zhang, Y., & Ren, R. (2026) · Journal of the American Heart Association · doi:10.1161/jaha.125.045593 · Cited by 1
“20 In addition to the primary analysis, subgroup and interaction analyses were conducted to examine whether the association between insomnia and incident CVD differed by age group (≤60 versus >60 years) and sex.”
Celik, N., Yao, Z.-Q., Safarnejad, M., Albrecht, G., Vahdat, D., & Blaha, M. J. (2026) · American Journal of Preventive Cardiology · doi:10.1016/j.ajpc.2026.101435 · Cited by 1
“Additionally, they may overestimate the proportion of individuals classified as high-risk [11,12].”
Pi, J.-L., Farina, J., Lahiri, R., Jeong, J., Gurudu, A., Park, H.-B., Chao, C.-J., Ayoub, C., Arsanjani, R., & Banerjee, I. (2025) · arXiv.org · doi:10.48550/arxiv.2506.19174 · Cited by 1
“Furthermore, these models often exhibit reduced performance in diverse populations due to population bias based on selective sampling [10, 4].”
Wu, S., Jiang, S., Yao, Y., & Li, M. (2025) · Coronary Artery Disease · doi:10.1097/mca.0000000000001545 · Cited by 3
Mitigating Bias in Opportunistic Screening for MACE With Causal Reasoning
Pi, J., Farina, J., Chao, C., Ayoub, C., Arsanjani, R., & Banerjee, I. (2025) · IEEE Transactions on Artificial Intelligence · doi:10.1109/tai.2025.3567961
“However, these models face signifi-cant performance drop when applied to diverse populations due to the population bias [7], [8].”
Chan, K., MYERS, J. N., Huberman, D. B., Ota, D., Jaramillo, J. P., & Kiratli, B. J. (2024) · Journal of Spinal Cord Medicine · doi:10.1080/10790268.2024.2375888 · Cited by 1
Zinzuwadia, A. N., Mineeva, O., Li, C., Farukhi, Z. M., Giulianini, F., Cade, B. E., Chen, L., Karlson, E. W., Paynter, N. P., Mora, S., et al. (2024) · Circulation Cardiovascular Quality and Outcomes · doi:10.1161/circoutcomes.123.010439 · Cited by 1
Time to Routinely Measure eGFR and Albuminuria in Young and Middle-Aged Adults.
Duprez, D. A., & Jacobs, D. R. (2023) · Journal of the American College of Cardiology · doi:10.1016/j.jacc.2023.07.013 · Cited by 1
Nasr, N. M. G., Soltész, B., Sándor, J., Ádány, R., & Fiatal, S. (2022) · Journal of Cardiovascular Development and Disease · doi:10.3390/jcdd9090295 · Cited by 3
“Previous studies found that all three models based on the Framingham score—the Framingham Adult Treatment Panel (ATP) III model, the Framingham Wilson model, and pooled cohort equations (PCE)—provide an incomplete prognosis of CHD events [29].”
MethodEarly prediction of delirium in a pediatric cardiac intensive care unit: A pilot study
Reiter, P. D., Wright, G. C., Good, R. J., Payan, M., Lieb, A., & Kaufman, J. (2021) · Progress in Pediatric Cardiology · doi:10.1016/j.ppedcard.2021.101401 · Cited by 2
Prediction models in respiratory medicine
Abramson, M., & Wolfe, R. (2020) · Respirology (Carlton South. Print) · doi:10.1111/resp.13854 · Cited by 1
Dumancas, G. G., de Castro, R., Saludes, J. P., Peñaranda, B. S., Bello, G., Villa, F. R. P., Villareal, B. N. L., Padernal, W. F., Posecion, T. M. A., Guanzon, M. L. V. V., et al. (2020) · Current Epidemiology Reports · doi:10.1007/s40471-020-00232-7 · Cited by 1
Chauhan, N. K., & Kaur, N. (2024) · AIP conference proceedings · doi:10.1063/5.0228691 · Cited by 1
Manish Kumar, S., M, N., & Kalpana, A. (2026) · Indian Journal of Public Health Research & Development · doi:10.37506/tenfe466
“[12, 13] Furthermore, data exploring the association between Framingham Risk Score and exercise capacity in the Indian population remains limited.”
Сулейменова, М., Amanova, R., & Keneskanova, A. (2026) · BioMedInformatics · doi:10.3390/biomedinformatics6050069
“Therefore, although these models are broadly applicable, their predictive accuracy requires recalibration and adaptation to specific populations to avoid systematic overprediction [9].”
Echo Chambers: Bias and Representation in Cardiac Imaging Datasets for Artificial Intelligence
Gorijavolu, R., Jaiswal, N., Pratap, J. S., Madapati, K., López, M. D. P. A., Leite, M., Muwanguzi, D. P., Izath, N., Samsel, K., Shoyombo, I., et al. (2026) · Current Cardiology Reports · doi:10.1007/s11886-026-02406-z · Cited by 1
“When risk models cali - brated on Western cohorts are applied to populations with different disease severity and treatment patterns, the predictions are also miscalibrated [ 54, 55 ].”
Ali, W. M. (2026) · Natural Resources for Human Health · doi:10.53365/nrfhh.516
“The decrease from 0.853 (development) to 0.652 (time-matched external) represents true temporal transportability loss, a typical decrease of 0.15 – 0.25 reported in published literature on cardiovascular external validation of tests [16,18].”
InfluentialAbiodun, O. O., & Anya, T. (2026) · Nigerian Postgraduate Medical Journal · doi:10.4103/npmj.npmj_580_25
Ten-year estimates of cardiovascular disease mortality risk in Islamic Republic of Iran.
Akhondi, H., Sakhvidi, M. Z., Khayatian, M., & Soodejani, M. T. (2026) · Eastern Mediterranean health journal = La revue de sante de la Mediterranee orientale = al-Majallah al-sihhiyah li-sharq al-mutawassit · doi:10.26719/2026.32.7.454
“The model incorporates key clinical and demographic variables, including age, sex, blood pressure, cholesterol levels and smoking status, to estimate the absolute probability of CVD events or death within a 10-year period (5,6).”
Nusinovici, S., Kim, H., Seo, J., Rim, T., Chen, Q.-Y., Lu, Z.-Y., Lee, C. J., Tham, Y., Nam, D., Thakur, S., et al. (2026) · Ophthalmology Science · doi:10.1016/j.xops.2026.101386
Wang, S., Li, T., & Huang, H. (2026) · Computer Methods in Biomechanics & Biomedical Engineering · doi:10.1080/10255842.2026.2708886
Zhu, F., Chen, J., Tong, W., Qiu, P., Mu, J., Xu, X., & Zhang, Q. (2026) · Systematic Reviews · doi:10.1186/s13643-026-03259-x
“To quantify uncertainty and heterogeneity, 95% confidence intervals (CIs) and 95% prediction intervals (PIs) will be calculated [36].”
Gholamalizadeh, H., Izadi-Moud, A., Soflaei, S. S., Darroudi, S., Ghayour-Mobarhan, M., Mohebati, M., & Shahri, B. (2026) · Scientific Reports · doi:10.1038/s41598-026-57438-w
“Nowadays, clinical decisions regarding the initiation and optimization of preventive treatment are guided by risk assessment systems, such as the Framingham scoring system 6,7 .”
Hamedi, A., Seif, M., Sharifi, M., Rezaianzadeh, A., Lashkardoost, H., Baberi, F., & Hassanzadeh, J. (2026) · Vascular Health and Risk Management · doi:10.2147/vhrm.s619033
“23 Heterogeneity in predictive performance across outcome types and gender has also been documented, with discrimination often stronger for fatal than nonfatal events.”
Advancing cardiovascular risk stratification in COPD: methodological gains and remaining gaps
Samarasinghe, Y., & Sadatsafavi, M. (2026) · European Respiratory Journal · doi:10.1183/13993003.00497-2026
Quennelle, S., Malekzadeh-Milani, S. G., Garcelon, N., Burgun, A., Bonnet, D., & Neuraz, A. (2026) · BMC Cardiovascular Disorders · doi:10.1186/s12872-026-06065-4
“Based on a population cohort from Framingham, Massachusetts, it leads to over-or underestimate risks of developing cardiovascular diseases in non-white populations [12, 13].”
Boilla, S. K., Lee, I.-C., Tsai, W.-C., Tsai, T.-H., & Lee, G.-B. (2026) · Chemical Engineering Journal · doi:10.1016/j.cej.2026.178086
Cruz, M. S., López, P. T. T., Dabreu, M. S. P., Cañellas, L. R., López-González, Á., & Ramírez-Manent, J. I. (2026) · Medical Science · doi:10.3390/medsci14020294
“These observations reinforce previous methodological recommendations emphasizing that agreement analyses, calibration assessment, and reclassification metrics should complement correlation-based comparisons when evaluating cardiovascular prediction tools [43,44].”
Machine learning prediction of long-term postoperative pneumonia risk: a retrospective cohort study
Lin, C.-A., Sung, K., Lee, C., & Sung, S. (2026) · BMC Medical Informatics and Decision Making · doi:10.1186/s12911-026-03604-z
“Cardiovascular risk scores predict 10-year events based on a single time-point assessment of traditional risk factors [27], as these baseline factors reflect chronic vulnerability rather than immediate causes.”
Yeh, T.-M., Hung, K.-C., Hung, C.-L., Lin, C., Tu, S.-K., Tsan, Y., & Liao, C. (2026) · Journal of Clinical Medicine · doi:10.3390/jcm15114075
“Comparative studies suggest that the performance of these models varies across populations, with slightly higher discrimination reported for the ASCVD Risk Estimator in some settings [15].”
Mohammad, A., Irshad, A., Aurangzeb, R. F., Mahmood, S., Singla, B., Singla, S., Haroon, F., Junaid, M., & Talha, A. (2026) · Cureus · doi:10.7759/cureus.109433
Rasouli, M. A., Najafi, F., Ansari-Moghaddam, A., Nouri, B., Moradpour, F., Moradi, G., & Moradi, Y. (2026) · Health Science Reports · doi:10.1002/hsr2.72469
“A systematic review and meta‐analysis by Damen et al. [85] evaluated the Framingham CHD and PCE models, while in 2022, Zhiting et al. assessed the general Framingham CVD and PCE models in the Chinese general population.”
Health justice, resource allocation and age in suicide risk assessment
Hart, J., Lignou, S., & Fazel, S. (2026) · Nature Mental Health · doi:10.1038/s44220-026-00635-3 · Cited by 1
“Risk tools in the rest of medicine have been robustly developed following the Framingham, SCORE, QRISK or ST1RE cardiovascular risk models, diabetes risk, and also cancer mortality risk scores, where they provide a probability score rather than categorization 66–72 .”
Lai, X.-J., Zhong, S., Lin, C.-Y., Cheng, Z., & Li, H. (2026) · International Journal of General Medicine · doi:10.2147/ijgm.s580442
Tang, J., Wong, G., Zhou, H., Zhou, J., Lau, G. K. K., Lee, E., Lum, T. Y. S., Wong, I. C. K., & Luo, H. (2026) · Schizophrenia Research · doi:10.1016/j.schres.2026.03.008
Tucker, D. R., Dungate, B., Chiu, D. S., Noga, H. L., Lee, C., Bedaiwy, M. A., Williams, C., Allaire, C., Talhouk, A., & Yong, P. J. (2026) · Pain · doi:10.1097/j.pain.0000000000003915 · Cited by 2
Han, C., You, S. C., Lee, H. C., Park, J. Y., Lim, H., Park, C., Pak, H. N., Kwon, O. S., Kim, S., Kim, J., et al. (2026) · BMC Medical Informatics and Decision Making · doi:10.1186/s12911-026-03400-9 · Cited by 2
Never too late for the heart: Lessons for midlife cardiovascular disease prevention.
Jeemon, P., & Henna, K. (2026) · National Medical Journal of India · doi:10.25259/nmji_2072_2025
Bockarie, A. S., Ayisi‐Boateng, N. K., Nguah, S. B., Appiah, L. T., Fiattor, T., Afriyie-Ansah, S., MacCready, E., Sam, V. A., Mensah, N. A., Tagge, R., et al. (2026) · Equity Neuroscience · doi:10.1016/j.neuros.2026.100024
Mohlele, D., Ntimana, C., Seakamela, K. P., Choma, S. R., Satekge, T. M., & Ringane, M. (2026) · Frontiers in Cardiovascular Medicine · doi:10.3389/fcvm.2026.1726722
Lu, C., Li, M., Sun, D., Zhang, H., Li, L., Yu, Y., Wang, J., Cao, L., Hu, Z., & Li, X. (2026) · CNS Neuroscience & Therapeutics · doi:10.1002/cns.70737
“A large systematic review and meta-analysis evaluated the performance of PCE across multiple cohorts and found that overestimation was particularly pronounced in high-risk patients and discrimination performance was better in female patients [11].”
Metadata
- Authors
- Damen, J. A., Pajouheshnia, R., Heus, P., Moons, K. G. M., Reitsma, J. B., Scholten, R. J. P. M., Hooft, L., & Debray, T. P. A.
- Affiliations
- Utrecht University (NL)
- Corresponding author
- Damen, Johanna A.
- ORCID
- Venue
- BMC Medicine
- Published
- 2019-06-13
- Volume
- 17
- Issue
- 1
- Pages
- 109-109
- ISSN
- 1741-7015 (ISSN-L)
- PMC
- PMC6563379
- OpenAlex
- W2953059279
- Cited by
- 250
- References
- 111
- Citations by year
- 2026: 33 · 2025: 45 · 2024: 37 · 2023: 41 · 2022: 37 · 2021: 27 · 2020: 25 · 2019: 3
- FWCI
- 3.76
- Type
- journal article
- Language
- en
- Open access
- gold
- doi.org
- Locations
- BMC Medicine (publishedVersion, cc-by)
- Europe PMC (PubMed Central) (publishedVersion, cc-by)
- PubMed Central (publishedVersion, cc-by)
- PubMed (publishedVersion)
- DOAJ (DOAJ: Directory of Open Access Journals) (submittedVersion, cc-by-sa)
- Utrecht University Repository (Utrecht University) (submittedVersion, other-oa)
- Funders
- Cochrane Methods Innovation Funds Round 2 (MTH001F)
- Cochrane Trusted methods and Support for Cochrane Reviews of Prognostic studies (-)
- Netherlands Organization for Scientific Research (918.10.615, 91208004, 91617050)
- CREW NHS project (2013T083)
- Topics
- Health Sciences › Medicine › Public Health, Environmental and Occupational Health › Health Promotion and Cardiovascular Prevention
- Health Sciences › Medicine › Cardiology and Cardiovascular Medicine › Lipoproteins and Cardiovascular Health
- Health Sciences › Medicine › Cardiology and Cardiovascular Medicine › Cardiovascular Health and Risk Factors
- Keywords
- Framingham risk score, Pooled Cohort Equations, cardiovascular risk prediction, coronary heart disease risk, risk overestimation, model calibration, discrimination (statistics), sex differences, population heterogeneity
- MeSH terms
- Aged, Cardiovascular Diseases, Female, Humans, Male, Models, Theoretical, Predictive Value of Tests, Prognosis, Risk Factors, Cohort Studies, Risk Assessment
About these checks
Registry, retraction, Cites and statistics results are computed, not judged, with one exception: a printed reference that no index lists is read once by a model before it counts as a citation error. Claims are extracted by a model and kept only when their quote appears verbatim in the text; each cited source is then checked, with a model’s help, for whether it says what the claim relies on. Those verdicts can be wrong — read the claim’s quote and the cited source before relying on one.
Statistics and arithmetic are recomputed, not judged.
Confidence bands are shown only for fields calibrated on our annotated test set. None is calibrated yet, so no band is shown.
What counts as a claim ›How we measure confidence ›How we check this ›
Are you an author, or do you see a problem with this page? Request a review
