

The DOI matches its Crossref record; 54 of the 54 references it cites were found in a registry or an index.
PKN2 in colon cancer cells inhibits M2 phenotype polarization of tumor-associated macrophages via regulating DUSP6-Erk1/2 pathway
Open accessAbstract
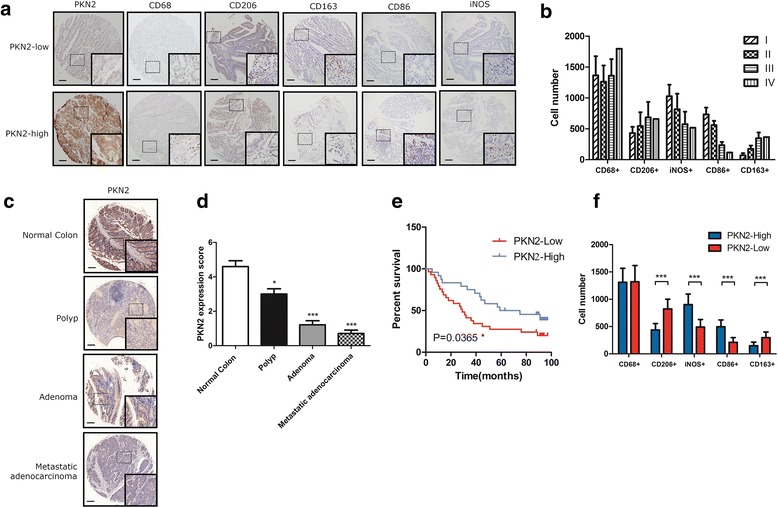
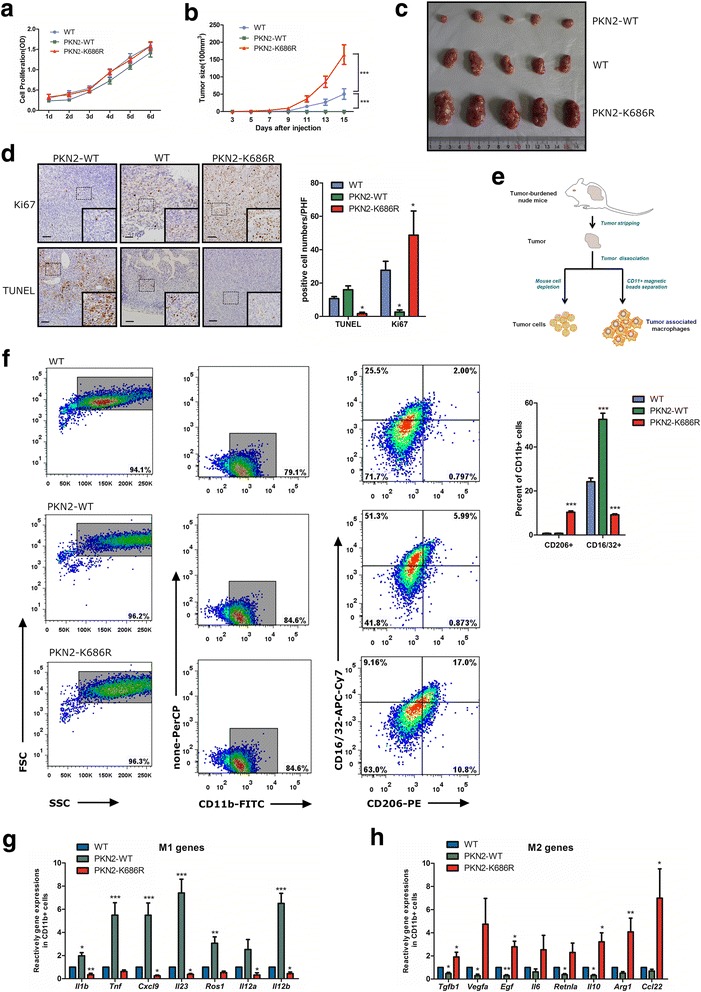
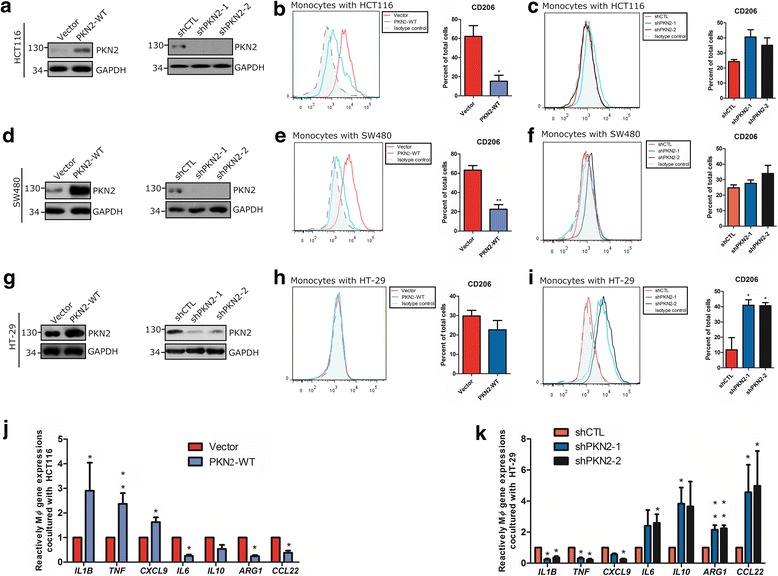
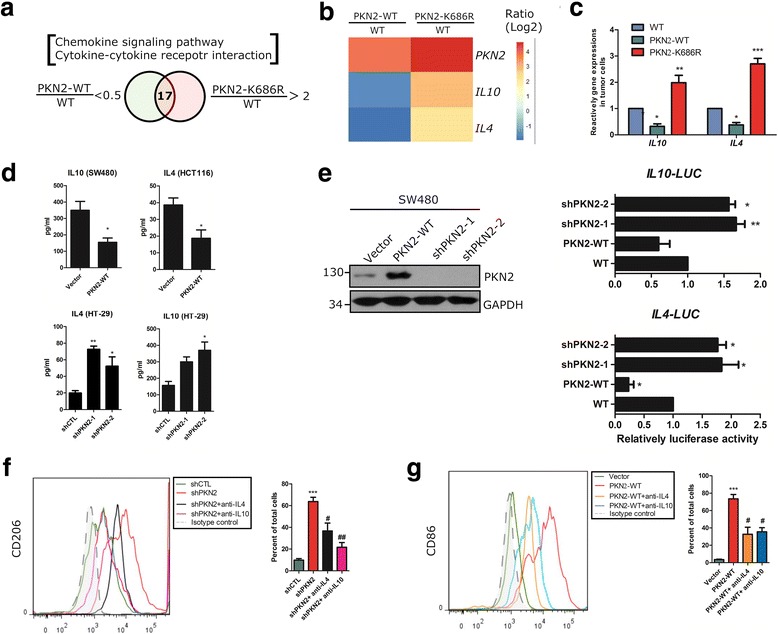
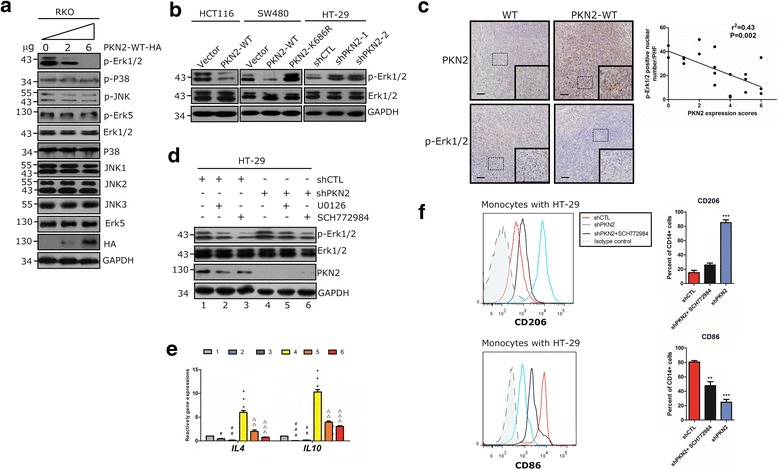
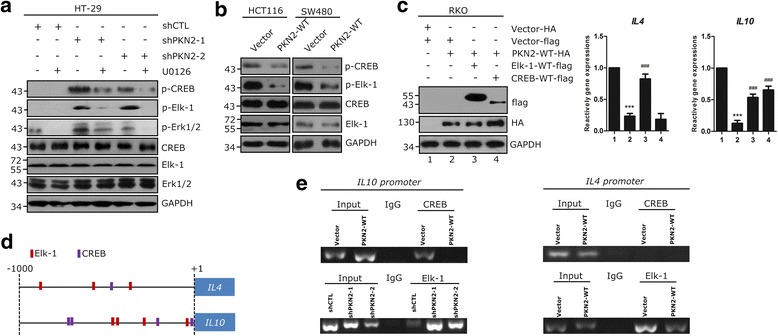
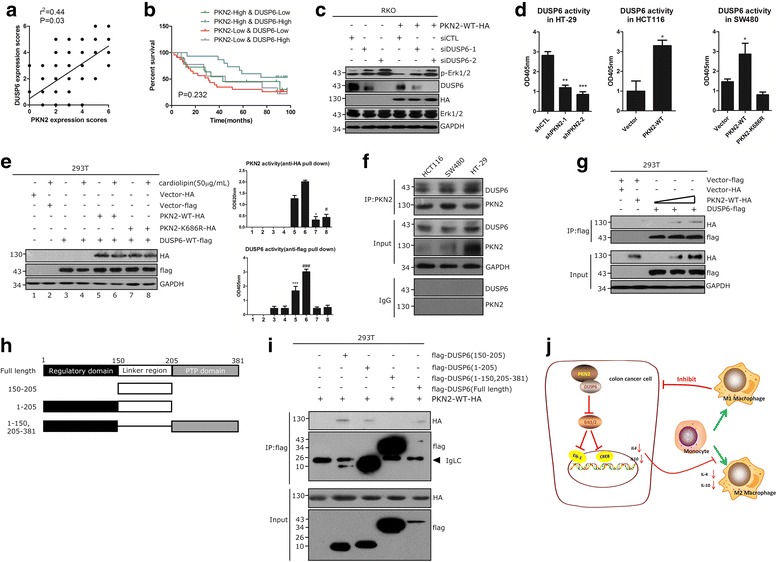
BACKGROUND: Protein kinase N2 (PKN2) is a PKC-related serine/threonine-protein kinase. PKN2 is required for tumor cell migration, invasion and apoptosis. However, the functional role of PKN2 in regulating tumor associated macrophages (TAMs) polarization in colon cancer has never been reported. METHODS: PKN2 expression in human colon cancer tissues was examined with immunohistochemistry (IHC). M1/M2 macrophage signatures were evaluated by RT-PCR, IHC and flow cytometry. The effects of PKN2 on tumor growth and TAM polarization were investigated both in vitro and in vivo. PKN2 targeted cytokines/pathway were analyzed by gene expression analysis and further confirmed by PCR, luciferase assay or western blot. Correlations between PKN2 and transcriptional factors for IL4 and IL10 were confirmed by ChIP-qPCR. The catalytic activities of PKN2 and DUSP6 were determined by kinase activity assay. Interactions between PKN2 and DUSP6 were confirmed by Co-IP. RESULTS: The expression of PKN2 in colon cancer cells predicted a favorable prognosis and was associated with low M2 macrophage content in human colon cancer tissues. PKN2 inhibited tumor growth in mice xenograft model and inhibited M2 phenotype polarization both in vitro and in vivo. Mechanistically, PKN2 suppresses the expression of IL4 and IL10 from colon cancer cells by inhibiting Erk1/2 phosphorylation, which is required for phosphorylation and binding of CREB and Elk-1 to the promoters of IL4 and IL10. DUSP6, which is phosphorylated and activated through direct association with PKN2, suppresses Erk1/2 activation. CONCLUSIONS: The expression of PKN2 in colon cancer cells suppresses tumor associated M2 macrophage polarization and tumor growth. Targeting PKN2 signaling pathway may provide a potential therapeutic strategy for colon cancer.
Overview
The claims and statistics of this paper haven’t been checked yet.
Run the check — free, no account needed. It reads the open-access text and checks the sources it cites.
Integrity signals
Registry
Cites
Statistics
Figures
Verification
Claims the paper makes
The claims and statistics of this paper haven’t been checked yet.
Run the check — free, no account needed. It reads the open-access text and checks the sources it cites.
Claims other papers make about this one
Each is checked against this paper’s own text: does it say what the citing paper says it does?
In the citing paper
“Through data analysis, we found that patients with gastric cancer with high expression of PSPH and low immune score had poor prognosis because of a high amount of M0 macrophages and a low amount of M1 macrophages, which was consistent with the previous study [38].”
From Phosphoserine phosphatase as a prognostic biomarker in patients with gastric cancer and its potential association with immune cells (2022) · cites this paper as [38]
Self-check
Percentages, sums and reported differences re-computed from the paper’s own numbers.
The self-check needs the paper’s full text.
Citations
Cites
Lozano, R., Naghavi, M., Foreman, K., Lim, S., Shibuya, K., Aboyans, V., Abraham, J., Adair, T., Aggarwal, R., Ahn, S. Y., et al. (2012) · The Lancet · doi:10.1016/s0140-6736(12)61728-0 · Cited by 14,070
Siegel, R., Naishadham, D., & Jemal, A. (2012) · CA: A Cancer Journal for Clinicians · doi:10.3322/caac.20138 · Cited by 10,679
Macrophage Diversity Enhances Tumor Progression and Metastasis
Qian, B., & Pollard, J. W. (2010) · Cell · doi:10.1016/j.cell.2010.03.014 · Cited by 5,349
Kyriakis, J. M., & Avruch, J. (2001) · Physiological Reviews · doi:10.1152/physrev.2001.81.2.807 · Cited by 3,400
Bingle, L., Brown, N. J., & Lewis, C. E. (2002) · The Journal of Pathology · doi:10.1002/path.1027 · Cited by 2,022
Tumor-Associated Macrophages as Major Players in the Tumor Microenvironment
Chanmee, T., Ontong, P., Konno, K., & Itano, N. (2014) · Cancers · doi:10.3390/cancers6031670 · Cited by 1,591
Tumor-associated macrophages: Functional diversity, clinical significance, and open questions
Biswas, S. K., Allavena, P., & Mantovani, A. (2013) · Seminars in Immunopathology · doi:10.1007/s00281-013-0367-7 · Cited by 551
Pharmacological inhibitors of MAPK pathways
English, J. M., & Cobb, M. H. (2002) · Trends in Pharmacological Sciences · doi:10.1016/s0165-6147(00)01865-4 · Cited by 449
M2 macrophages promote beta-cell proliferation by up-regulation of SMAD7
Xiao, X., Gaffar, I. M., Guo, P., Wiersch, J. C., Fischbach, S., Peirish, L., Song, Z., El‐Gohary, Y., Prasadan, K. L., Shiota, C., et al. (2014) · Proceedings of the National Academy of Sciences · doi:10.1073/pnas.1321347111 · Cited by 312
Sunters, A., Madureira, P. A., Pomeranz, K. M., Aubert, M., Brosens, J. J., Cook, S. J., Burgering, B. M. T., Coombes, R. C., & Lam, E. W. ‐. (2006) · Cancer Research · doi:10.1158/0008-5472.can-05-1997 · Cited by 251
Cited by
Sorted by citations
Peña-Romero, A. C., & Orenes‐Piñero, E. (2022) · Cancers · doi:10.3390/cancers14071681 · Cited by 271
He, Z., Wang, J., Zhu, C., Xu, J., Chen, P., Jiang, X., Chen, Y., Jiang, J., & Sun, C.-Y. (2022) · Cancer Letters · doi:10.1016/j.canlet.2022.215751 · Cited by 203
Self-citationYang, Y., Li, S., To, K. K. W., Zhu, S., Wang, F., & Fu, L. (2025) · Journal of Experimental & Clinical Cancer Research · doi:10.1186/s13046-025-03377-9 · Cited by 221
Jiang, H., Wei, H., Wang, H., Wang, Z., Li, J., Ou, Y., Xiao, X., Wang, W., Chang, A., Sun, W., et al. (2022) · Cell Death and Disease · doi:10.1038/s41419-022-04632-z · Cited by 197
Zhong, Q., Fang, Y., Lai, Q., Wang, S., He, C., Li, A., Liu, S., & Yan, Q. (2020) · Journal of Experimental & Clinical Cancer Research · doi:10.1186/s13046-020-01637-4 · Cited by 141
A review of Glycogen Synthase Kinase-3 (GSK3) inhibitors for cancers therapies
Thapa, R., Gupta, G., Bhat, A. A., Almalki, W. H., Alzarea, S. I., Kazmi, I. A., Saleem, S., Khan, R., Altwaijry, N., Dureja, H., et al. (2023) · International Journal of Biological Macromolecules · doi:10.1016/j.ijbiomac.2023.127375 · Cited by 139
Bai, X., Guo, Y.-R., Zhao, Z., Li, X., Dai, D.-Q., Zhang, J., Li, Y.-S., & Zhang, C. (2025) · Cancer Letters · doi:10.1016/j.canlet.2025.217772 · Cited by 140
The role of tumor-associated macrophages in osteosarcoma progression – therapeutic implications
Huang, Q., Liang, X., Ren, T., Huang, Y., Zhang, H., Yu, Y., Chen, C., Wang, W., Niu, J., Lou, J., et al. (2021) · Cellular Oncology · doi:10.1007/s13402-021-00598-w · Cited by 118
Huang, C., Ou, R., Chen, X., Zhang, Y., Li, J., Liang, Y., Zhu, X., Liu, L., Li, M., Lin, D., et al. (2021) · Journal of Experimental & Clinical Cancer Research · doi:10.1186/s13046-021-02108-0 · Cited by 115
Zhang, Z., Yang, Z., Wang, S., Wang, X., & Mao, J. (2024) · Biomedicine & Pharmacotherapy · doi:10.1016/j.biopha.2024.116413 · Cited by 106
Ma, J., Chen, L., Zhu, X., Li, Q., Hu, L., & Li, H. (2021) · Acta Biochimica et Biophysica Sinica · doi:10.1093/abbs/gmab102 · Cited by 96
Zhang, G., Gao, Z.-X., Guo, X., Ma, R., Wang, X., Zhou, P., Li, C., Tang, Z., Zhao, R., & Gao, P. (2023) · Journal of Clinical Investigation · doi:10.1172/jci166224 · Cited by 94
Macrophages: Subtypes, Distribution, Polarization, Immunomodulatory Functions, and Therapeutics
Peng, M., Li, N., Wang, H., Li, Y., Liu, H., Luo, Y., Lang, B., Zhang, W., Li, S., Tian, L., et al. (2025) · MedComm · doi:10.1002/mco2.70304 · Cited by 98
Xu, T., Yu, S., Zhang, J., & Wu, S. (2021) · Journal of Hematology & Oncology · doi:10.1186/s13045-021-01198-9 · Cited by 79
The strategies of targeting the NLRP3 inflammasome to treat inflammatory diseases
Jiang, H., Gong, T., & Zhou, R. (2019) · Advances in immunology · doi:10.1016/bs.ai.2019.11.003 · Cited by 71
Yang, W., Yang, S., Zhang, F., Cheng, F., Wang, X., & Rao, J. (2020) · Annals of Translational Medicine · doi:10.21037/atm.2020.02.11 · Cited by 70
Chen, L., Wang, D., Peng, F., Qiu, J., Ouyang, L., Qiao, Y., & Liu, X. (2019) · Nano Letters · doi:10.1021/acs.nanolett.9b00237 · Cited by 66
A novel role of kallikrein-related peptidase 8 in the pathogenesis of diabetic cardiac fibrosis
Du, J.-K., Yu, Q., Liu, Y., Du, S., Huang, L.-Y., Xu, D., Ni, X., & Zhu, X. (2021) · Theranostics · doi:10.7150/thno.48530 · Cited by 56
Functional and Therapeutic Significance of Tumor-Associated Macrophages in Colorectal Cancer
Li, Y., Chen, Z., Han, J., Ma, X., Zheng, X., & Chen, J. (2022) · Frontiers in Oncology · doi:10.3389/fonc.2022.781233 · Cited by 55
Epiregulin confers EGFR-TKI resistance via EGFR/ErbB2 heterodimer in non-small cell lung cancer
Ma, S., Zhang, L., Ren, Y., Dai, W., Chen, T., Luo, L., Zeng, J., Mi, K., Lang, J., & Cao, B. (2021) · Oncogene · doi:10.1038/s41388-021-01734-4 · Cited by 54
Protein kinase N controls a lysosomal lipid switch to facilitate nutrient signalling via mTORC1
Wallroth, A., Koch, P. A., Marat, A. L., Krause, E., & Haucke, V. (2019) · Nature Cell Biology · doi:10.1038/s41556-019-0377-3 · Cited by 55
Ferroptosis and Its Potential Role in Glioma: From Molecular Mechanisms to Therapeutic Opportunities
Luo, Y., Tian, G., Fang, X., Bai, S., Yuan, G., & Pan, Y. (2022) · Antioxidants · doi:10.3390/antiox11112123 · Cited by 53
Du, C., Wang, K., Zhao, Y., Nan, X., Chen, R., Quan, S., & Xiong, B. (2022) · Nutrients · doi:10.3390/nu14091808 · Cited by 49
IL4 from T Follicular Helper Cells Downregulates Antitumor Immunity
Shirota, H., Klinman, D. M., Ito, S.-E. A., Ito, H., Kubo, M., & Ishioka, C. (2016) · Cancer Immunology Research · doi:10.1158/2326-6066.cir-16-0113 · Cited by 41
Yan, Y., Huang, P., Mao, K., He, C., Xu, Q., Zhang, M., Liu, H., Zhou, Z., Zhou, Q., Zhou, Q., et al. (2020) · Oncogene · doi:10.1038/s41388-020-01498-3 · Cited by 41
Chen, W., Huang, J., Xiong, J., Fu, P., Chen, C., Liu, Y., Li, Z., Jie, Z., & Cao, Y. (2021) · Oxidative Medicine and Cellular Longevity · doi:10.1155/2021/6290261 · Cited by 40
MiR-452-5p promotes colorectal cancer progression by regulating an ERK/MAPK positive feedback loop
Lin, X., Han, L., Gu, C.-C., Lai, Y., Lai, Q., Li, Q., He, C., Meng, Y., Pan, L., Liu, S., et al. (2021) · Aging · doi:10.18632/aging.202657 · Cited by 37
Cui, X., Qin, T., Zhao, Z., Yang, G., Sanches, J. G. P., Zhang, Q., Fan, S., Cao, L., & Hu, X. (2021) · Journal of Cancer · doi:10.7150/jca.58698 · Cited by 36
Zhang, B., Yuan, P., Xu, G. H., Chen, Z., Li, Z., Ye, H., Wang, J., Shi, P., & Sun, X. (2021) · Cell Death and Disease · doi:10.1038/s41419-021-04110-y · Cited by 35
Yang, D., Yang, L., Cai, J., Li, H., Zheng, X., & Hou, Y. (2022) · Molecular and Cellular Biochemistry · doi:10.1007/s11010-022-04461-w · Cited by 34
Guo, X., Zhang, H., He, C., Qin, K., Lai, Q., Fang, Y., Chen, Q., Li, W., Wang, Y., Wang, X., et al. (2024) · Biomarker Research · doi:10.1186/s40364-024-00573-1 · Cited by 34
Wang, H., Cheng, Q., Chang, K., Bao, L., & Yi, X. (2022) · Frontiers in Cell and Developmental Biology · doi:10.3389/fcell.2021.807862 · Cited by 34
FBXO38 regulates macrophage polarization to control the development of cancer and colitis
Zheng, X., Jiang, Q., Han, M., Ye, F., Wang, M., Qiu, Y., Wang, J., Gao, M., Hou, F., & Wang, H. (2023) · Cellular and Molecular Immunology · doi:10.1038/s41423-023-01081-2 · Cited by 31
Yang, L., Huang, C., Wang, C., Zhang, S., Li, Z., Zhu, Y., Li, D., Gao, L., Ge, Z., Su, M., et al. (2019) · Anti-Cancer Drugs · doi:10.1097/cad.0000000000000868 · Cited by 29
Self-citationTang, Y., Hu, S. C., Li, T., & Qiu, X. (2023) · Gene · doi:10.1016/j.gene.2023.147413 · Cited by 30
Yang, H., Li, L., Liu, X., & Zhao, Y. (2021) · Medical Science Monitor · doi:10.12659/msm.927977 · Cited by 28
The structure and function of protein kinase C-related kinases (PRKs)
Sophocleous, G., Owen, D., & Mott, H. R. (2021) · Biochemical Society Transactions · doi:10.1042/bst20200466 · Cited by 30
Zhang, Y., Jiang, M., Du, G., Zhong, X., He, C., Qin, M., Hou, Y., Liu, R., & Sun, X. (2022) · Acta Pharmaceutica Sinica B · doi:10.1016/j.apsb.2022.03.017 · Cited by 28
Li, Y., Shi, Y., Zhang, X., Li, P., Ma, L., Hu, P., Xu, L., Dai, Y., Xia, S., & Qiu, H. (2023) · Biochimica et Biophysica Acta (BBA) - Molecular Basis of Disease · doi:10.1016/j.bbadis.2023.166665 · Cited by 27
Xia, S., Wang, Z., Chen, L., Zhou, Y., Li, Y., Wang, S., Chen, A., Xu, X., Shao, J., Zhang, Z., et al. (2021) · Biochemical Pharmacology · doi:10.1016/j.bcp.2021.114730 · Cited by 25
Predictive biomarkers of disease progression in idiopathic pulmonary fibrosis
Zhu, W., Liu, C., Tan, C., & Zhang, J. (2023) · Heliyon · doi:10.1016/j.heliyon.2023.e23543 · Cited by 29
Zhang, Z., Chen, Y., Zheng, L., Du, J., Wei, S., Zhu, X., & Xiong, J. (2022) · Disease Models & Mechanisms · doi:10.1242/dmm.049662 · Cited by 24
Glyburide attenuates B(a)p and LPS‐induced inflammation‐related lung tumorigenesis in mice
Li, M., Liu, H., Shao, H., Zhang, P., Gao, M., Huang, L., Shang, P., Zhang, Q., Wang, W., Wang, J., et al. (2021) · Environmental Toxicology · doi:10.1002/tox.23293 · Cited by 23
TP53 R273C Mutation Is Associated With Poor Prognosis in LGG Patients
Zhang, J., Liu, M., Fang, Y., Li, J., Chen, Y., & Jiao, S. (2022) · Frontiers in Genetics · doi:10.3389/fgene.2022.720651 · Cited by 23
Checkpoints and immunity in cancers: Role of GNG12
Alausa, A. O., Victor, U. C., Fadahunsi, O. S., Owolabi, N., Adeniji, A., Olatinwo, M., Ogunlana, A. T., Olaleke, B., Balogun, T. A., Ogundepo, S., et al. (2022) · Pharmacological Research · doi:10.1016/j.phrs.2022.106242 · Cited by 24
Zhu, Q., Wu, X., Tang, M., & Wu, L. (2020) · Medicine · doi:10.1097/md.0000000000019839 · Cited by 25
Du, Y., Hou, Y., Shi, Y., Liu, J., & Li, T. (2021) · Frontiers in Oncology · doi:10.3389/fonc.2020.588360 · Cited by 20
RetractedCrosstalk Among YAP, LncRNA, and Tumor-Associated Macrophages in Tumorigenesis Development
Xu, J., Liu, X., Zhang, Q., Liu, H., Zhang, P., Tian, Z., Zhang, C., & Li, X. (2022) · Frontiers in Oncology · doi:10.3389/fonc.2021.810893 · Cited by 20
Self-citationZhang, Z., Song, Y., Zhang, X., Wang, S., Jia, Z., Wang, L., Wang, C., Wang, X., & Mao, J. (2023) · Journal of Ethnopharmacology · doi:10.1016/j.jep.2023.117210 · Cited by 21
Feng, Y., Jin, C., Wang, T., Chen, Z., Ji, D., Zhang, Y., Zhang, C., Zhang, D., Peng, W., & Sun, Y. (2024) · Advanced Science · doi:10.1002/advs.202304222 · Cited by 20
Zhang, Z., Yang, Z., Wang, S., Wang, X., & Mao, J. (2024) · Biomedicine & Pharmacotherapy · doi:10.1016/j.biopha.2024.117367 · Cited by 22
DUSP6 regulates Notch1 signalling in colorectal cancer
Png, C. W., Weerasooriya, M., Li, H., Hou, X., Teo, F. Y., Huang, S., Ser, Z., Weng, F. Y. K., Rethnam, M., Chia, G., et al. (2024) · Nature Communications · doi:10.1038/s41467-024-54383-y · Cited by 18
Zhou, P., Xu, T., Hu, H., & Hua, F. (2021) · International Journal of Endocrinology · doi:10.1155/2021/5499963 · Cited by 18
Role of tumor-associated macrophages in common digestive system malignant tumors
Shen, Y. G., Chen, J., Li, M., Xiang, Z., Wu, J., & Wang, Y. (2023) · World Journal of Gastrointestinal Oncology · doi:10.4251/wjgo.v15.i4.596 · Cited by 18
Regulatory mechanism of macrophage polarization based on Hippo pathway
Liu, Y., An, Y., Li, G., & Wang, S. (2023) · Frontiers in Immunology · doi:10.3389/fimmu.2023.1279591 · Cited by 20
Development of 2-(4-pyridyl)-benzimidazoles as PKN2 chemical tools to probe cancer
Scott, F., Fala, A. M., Pennicott, L. E., Reuillon, T. D., Massirer, K. B., Elkins, J. M., & Ward, S. E. (2020) · Bioorganic & Medicinal Chemistry Letters · doi:10.1016/j.bmcl.2020.127040 · Cited by 18
Miao, X., Liu, C., Jiang, Y., Wang, Y., Kong, D., Wu, Z., Wang, X., Tian, R. L., Yu, X., Zhu, X., et al. (2021) · Cell Death and Disease · doi:10.1038/s41419-021-04305-3 · Cited by 18
The Prognostic Value and Mechanisms of TMEM16A in Human Cancer
Chen, W., Gu, M., Gao, C., Chen, B., Yang, J., Xie, X., Wang, X., Sun, J. F., & Wang, J. (2021) · Frontiers in Molecular Biosciences · doi:10.3389/fmolb.2021.542156 · Cited by 17
FAL1: A critical oncogenic long non-coding RNA in human cancers
Lv, X., Yang, L., Li, Y., Li, H., Zhou, L., Wang, B., Zhi, Z., & Tang, W. (2019) · Life Sciences · doi:10.1016/j.lfs.2019.116918 · Cited by 17
Du, L., Min, H., Meng, Y., Zhang, K., Wang, L., Zhang, Y., Sun, P., Zhang, W., Qi, Y., & Wu, G. (2025) · Nano Letters · doi:10.1021/acs.nanolett.4c05354 · Cited by 18
Chang, Z., Li, R., Zhang, J., An, L., Zhou, G., Lei, M., Deng, J., Yang, R., Song, Z., Zhong, W., et al. (2022) · Frontiers in Immunology · doi:10.3389/fimmu.2022.1008865 · Cited by 16
Wang, H., Lou, J., Liu, H., Liu, Y., Xie, B., Zhang, W., Xie, J., Pan, H., & Han, W. (2024) · Scientific Reports · doi:10.1038/s41598-024-66388-0 · Cited by 16
Upregulation of KLK8 Predicts Poor Prognosis in Pancreatic Cancer
Hua, Q., Li, T., Liu, Y., Shen, X., Zhu, X., & Xu, P. (2021) · Frontiers in Oncology · doi:10.3389/fonc.2021.624837 · Cited by 16
Huang, M.-Y., Liu, X.-Y., Shao, Q., Zhang, X., Miao, L., Wu, X.-Y., Xu, Y.-X., Wang, F., Wang, H.-Y., Zeng, L., et al. (2022) · BMC Gastroenterology · doi:10.1186/s12876-021-02073-0 · Cited by 15
Li, A., Hong, J., Ma, X., Huang, Y., Jiang, Q., Zhang, C., Wang, Y., & Huang, Y. (2025) · International Journal of Nanomedicine · doi:10.2147/ijn.s499381 · Cited by 14
Ye, Z., Cheng, P., Huang, Q., Hu, J., Huang, L., & Hu, G. (2024) · Frontiers in Immunology · doi:10.3389/fimmu.2024.1388176 · Cited by 15
Mashayekhi, V., Schomisch, A., Rasheed, S., Aparicio-Puerta, E., Risch, T., Yildiz, D., Koch, M., Both, S., Ludwig, N., Legroux, T. M., et al. (2024) · Cell Communication and Signaling · doi:10.1186/s12964-024-01701-y · Cited by 14
Gao, C., Wang, S., Xie, X., Ramadori, P., Li, X., Liu, X., Ding, X., Liang, J., Xu, B., Feng, Y., et al. (2024) · Cellular and Molecular Gastroenterology and Hepatology · doi:10.1016/j.jcmgh.2024.101411 · Cited by 17
Ai, Y., Tang, Z., Zou, C., Wei, H., Wu, S., & Huang, D. (2020) · Journal of Cellular and Molecular Medicine · doi:10.1111/jcmm.15943 · Cited by 13
Wang, L., Wang, Y., & Bi, J. (2022) · Functional & Integrative Genomics · doi:10.1007/s10142-022-00884-2 · Cited by 14
Differentially Expressed miRNAs Influence Metabolic Processes in Pituitary Oncocytoma
Krokker, L., Nyírő, G., Reiniger, L., Darvasi, O., Szücs, N., Czirják, S., Tóth, M., Igaz, P., Patócs, A., & Butz, H. (2019) · Neurochemical Research · doi:10.1007/s11064-019-02789-2 · Cited by 14
Yuan, H., Xue, Y., Guo, C., Song, J., Zhang, Y. X., Yin, T., He, H., Gou, J., & Tang, X. (2022) · International Journal of Pharmaceutics · doi:10.1016/j.ijpharm.2022.121860 · Cited by 13
Tu, R., Kang, Y., Pan, Y., Da, Y., Ren, D., Zhang, R., Cai, Z., Liu, Y., Xu, J., Ma, J., et al. (2024) · Cancer Cell International · doi:10.1186/s12935-024-03224-5 · Cited by 13
Self-citationLi, J., Wen, S., Li, B., Li, N., & Zhan, X. (2021) · Cells · doi:10.3390/cells10092225 · Cited by 14
Sujina, A., Fahma, A., Subair, S., Dcunha, L., Gopalakrishnan, A. P., Ummar, S., Shivamurthy, P. B., Ramesh, P., & Raju, R. (2025) · The Protein Journal · doi:10.1007/s10930-025-10293-6 · Cited by 12
Feng, X., Wang, L., Pu, L., Li, J., Li, H., Liu, D., & Li, R. (2024) · International Journal of Molecular Sciences · doi:10.3390/ijms251810123 · Cited by 12
Yang, X., Zeng, T., Liu, Z., He, W., Hu, M., Tang, T., Chen, L., & Xing, L. (2022) · Cancer Medicine · doi:10.1002/cam4.4795 · Cited by 12
Xie, Y., Gan, C., Liu, H., Hou, Y., Su, X., Xue, T., Wang, D., Li, P., Lin, Y., Qiu, Q., et al. (2024) · Phytotherapy Research · doi:10.1002/ptr.8351 · Cited by 11
CD163+ macrophages suppress T cell response by producing TGF-β in pediatric colorectal polyps
Zhang, S.-X., Li, X., Zhu, L., Ming, S., Wang, H., Xie, J., Ren, L., Huang, J., Liang, D., Xiong, L., et al. (2021) · International Immunopharmacology · doi:10.1016/j.intimp.2021.107644 · Cited by 12
Self-citationTu, R., Ma, J., Chen, Y., Kang, Y., Ren, D., Cai, Z., Zhang, R., Pan, Y., Liu, Y., Da, Y., et al. (2024) · Cell Death and Disease · doi:10.1038/s41419-024-07136-0 · Cited by 11
Liu, G., Huang, K., Lin, B., Zhang, R., Zhu, Y., Dong, X., Wu, C., Zhu, H., Lin, J., Bao, M., et al. (2025) · Biochimica et Biophysica Acta (BBA) - Molecular Basis of Disease · doi:10.1016/j.bbadis.2025.167690 · Cited by 11
Self-citationLINC00668 cooperated with HuR dependent upregulation of PKN2 to facilitate gastric cancer metastasis
Li, J., Dong, W., Jiang, Q., Zhang, F., & Dong, H. (2021) · Cancer Biology & Therapy · doi:10.1080/15384047.2021.1905138 · Cited by 10
Menegatti, J., Nakel, J., Stepanov, Y. K., Caban, K. M., Ludwig, N., Nord, R., Pfitzner, T., Yazdani, M., Vilimova, M., Kehl, T., et al. (2022) · Cancers · doi:10.3390/cancers14205031 · Cited by 11
Gao, X., Long, R., Qin, M., Zhu, W., Wei, L., Dong, P., Chen, J., Luo, J., & Feng, J. (2023) · International Journal of Molecular Medicine · doi:10.3892/ijmm.2023.5327 · Cited by 11
Liu, L., Chen, Y., Lin, X., Wu, M., Li, J., Xie, Q., Sferra, T. J., Han, Y., Liu, H., Cao, L., et al. (2021) · PubMed Central · doi:10.1186/s12935-021-02246-7 · Cited by 10
Yang, B., Wang, L., & Tian, Z. (2022) · International Journal of Experimental Pathology · doi:10.1111/iep.12460 · Cited by 10
Identification of a 9‐gene prognostic signature for breast cancer
Tian, Z., Tang, J., Liao, X. H., Yang, Q., Wu, Y., & Wu, G. (2020) · Cancer Medicine · doi:10.1002/cam4.3523 · Cited by 10
Fu, X., Zhang, G., Hou, Z., Fu, T., & Cui, G. (2025) · Molecular Medicine · doi:10.1186/s10020-025-01132-6 · Cited by 8
Qiu, Y., Wei, X., Cao, J., Wang, J., Dou, Q., Zhou, F., Chen, X., Liu, Y., Wan, G., Huang, M., et al. (2025) · Reproductive Sciences · doi:10.1007/s43032-025-01944-1 · Cited by 8
Role of a mixed probiotic product, VSL#3, in the prevention and treatment of colorectal cancer
Wei, L., Duan, L., Zhao, H., & Tai, J. (2022) · European Journal of Pharmacology · doi:10.1016/j.ejphar.2022.175152 · Cited by 8
Exploring the Immune Landscape of ccRCC : Prognostic Signatures and Therapeutic Implications
Pan, M., Xu, X., Zhang, D., & Cao, W. (2024) · Journal of Cellular and Molecular Medicine · doi:10.1111/jcmm.70212 · Cited by 8
Bioinformatic approaches to the investigation of the atavistic genes implicated in cancer
Louka, A., Takan, I., Pavlopoulou, A., & Georgakilas, A. G. (2021) · Frontiers in Bioscience-Landmark · doi:10.52586/4944 · Cited by 8
Identification of Circular RNA-Based Immunomodulatory Networks in Colorectal Cancer
Feng, Z., Li, L., Tu, Y., Shu, X., Zhang, Y., Zeng, Q., Luo, L., Wu, A., Chen, W., Cao, Y., et al. (2022) · Frontiers in Oncology · doi:10.3389/fonc.2021.779706 · Cited by 8
Ren, J., Jin, Z., & Huang, Y. (2024) · Physiological Reports · doi:10.14814/phy2.16157 · Cited by 6
Lai, W., Liao, J., Li, X., Liang, P., He, L., Huang, K., Liang, X., & Wang, Y. (2023) · Frontiers in Genetics · doi:10.3389/fgene.2023.1067666 · Cited by 8
Zhu, Y., Li, C., Lin, X., Sun, J., & Cheng, Y. (2019) · Europe PMC (PubMed Central) · doi:10.12122/j.issn.1673-4254.2019.10.08 · Cited by 7
Self-citationEPSTI1 as an immune biomarker predicts the prognosis of patients with stage III colon cancer
Wang, X., Cheng, W., Zeng, X., Dou, X., Zhou, Z., & Pei, Q. (2022) · Frontiers in Immunology · doi:10.3389/fimmu.2022.987394 · Cited by 6
Sun, Z., Zhang, Z., Zhang, J., Yang, Z., Pan, S., Li, X., Wang, X., & Zhu, X. (2025) · International Immunopharmacology · doi:10.1016/j.intimp.2025.114479 · Cited by 6
In Vitro Methods to Evaluate Macrophage Polarization and Function in Cancer
Ummarino, A., Anfray, C., Maeda, A., Torres, F., & Allavena, P. (2023) · Methods in molecular biology · doi:10.1007/978-1-0716-2914-7_6 · Cited by 6
Progress of IL-10 and liver metastasis
Zeng, C., Niu, F., Li, H., Huang, Z., Ke, Y., Yu, L., & Chen, M. (2025) · Cytokine · doi:10.1016/j.cyto.2025.156932 · Cited by 5
Metadata
- Authors
- Cheng, Y., Zhu, Y., Xu, J., Yang, M., Chen, P., Xu, W., Zhao, J., Geng, L., & Gong, S.
- Affiliations
- Guangzhou Women and Children Medical Center (CN)
- Nanfang Hospital (CN)
- Corresponding author
- Gong, Sitang
- ORCID
- Venue
- Molecular Cancer
- Published
- 2018-01-24
- Volume
- 17
- Issue
- 1
- Pages
- 13-13
- ISSN
- 1476-4598 (ISSN-L)
- PMC
- PMC5784528
- OpenAlex
- W2790033844
- Cited by
- 161
- References
- 54
- Citations by year
- 2026: 11 · 2025: 22 · 2024: 25 · 2023: 22 · 2022: 28 · 2021: 37 · 2020: 8 · 2019: 7
- FWCI
- 5.80
- Type
- journal article
- Language
- en
- Open access
- gold
- doi.org
- Licence
- cc-by
- Locations
- Molecular Cancer (publishedVersion, cc-by)
- PubMed Central (publishedVersion, cc-by)
- PubMed (publishedVersion)
- DOAJ (DOAJ: Directory of Open Access Journals) (submittedVersion, cc-by-sa)
- Funders
- National Natural Science Foundation of China (81301758, 81602646)
- Natural Science Foundation of Guangdong Province (2016A030310254)
- China Postdoctoral Science Foundation (2016M600648)
- Topics
- Life Sciences › Immunology and Microbiology › Immunology › Immune cells in cancer
- Life Sciences › Biochemistry, Genetics and Molecular Biology › Molecular Biology › Angiogenesis and VEGF in Cancer
- Life Sciences › Biochemistry, Genetics and Molecular Biology › Molecular Biology › TGF-β signaling in diseases
- Keywords
- PKN2, colon cancer, tumor-associated macrophages, M2 macrophage polarization, DUSP6, ERK1/2 phosphorylation, IL-4, IL-10, CREB, Elk-1, tumor growth, prognostic factors, kinase signaling pathways
- MeSH terms
- Colonic Neoplasms, Humans, Immunohistochemistry, Macrophage Activation, Macrophages, Neoplasm Staging, Prognosis, Promoter Regions, Genetic, Protein Binding, Protein Kinase C, Biomarkers, Tumor, Gene Expression Regulation, Neoplastic, Cytokines, MAP Kinase Signaling System, Cell Line, Tumor, ets-Domain Protein Elk-1, CREB-Binding Protein, Dual Specificity Phosphatase 6
About these checks
Registry, retraction, Cites and statistics results are computed, not judged, with one exception: a printed reference that no index lists is read once by a model before it counts as a citation error. Claims are extracted by a model and kept only when their quote appears verbatim in the text; each cited source is then checked, with a model’s help, for whether it says what the claim relies on. Those verdicts can be wrong — read the claim’s quote and the cited source before relying on one.
Statistics and arithmetic are recomputed, not judged.
Confidence bands are shown only for fields calibrated on our annotated test set. None is calibrated yet, so no band is shown.
What counts as a claim ›How we measure confidence ›How we check this ›
Are you an author, or do you see a problem with this page? Request a review
