

The DOI matches its Crossref record; 87 of the 88 references it cites were found in a registry or an index.
Senescence-associated IL-6 and IL-8 cytokines induce a self- and cross-reinforced senescence/inflammatory milieu strengthening tumorigenic capabilities in the MCF-7 breast cancer cell line
Open accessAbstract
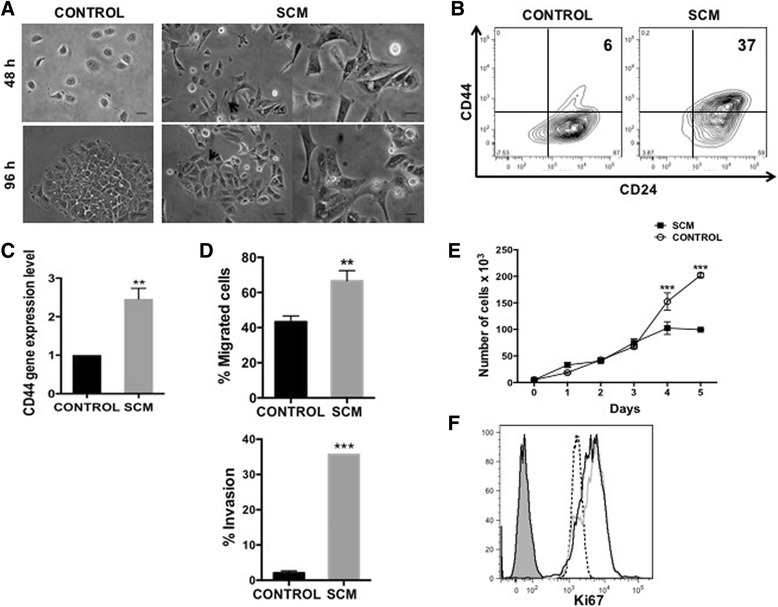
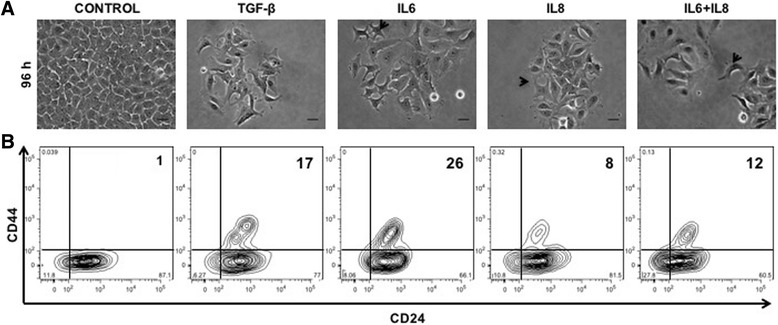
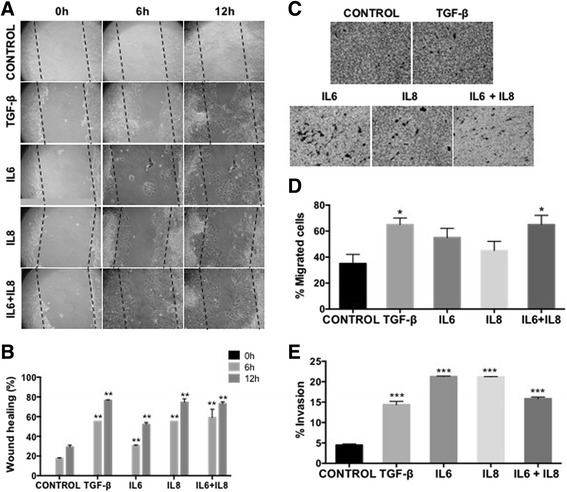
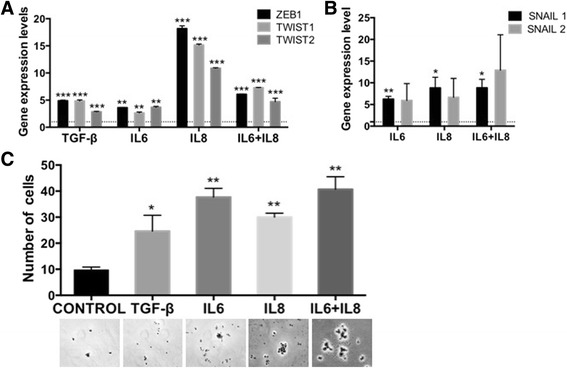
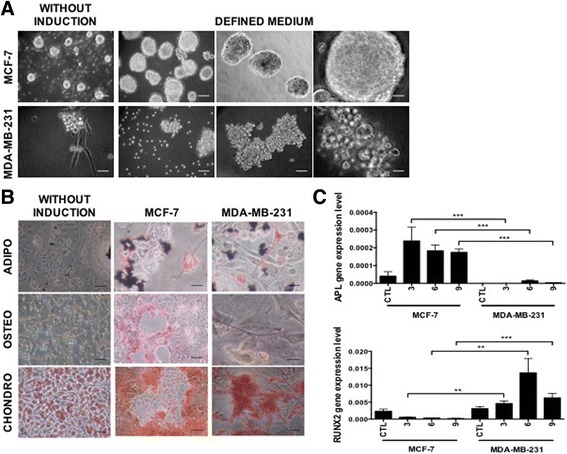
BACKGROUND: There is compelling evidence associating senescent cells with the malignant progression of tumours. Of all senescence-related mechanisms, the so-called senescence-associated secretory phenotype (SASP) has attracted much attention. Since the pro-inflammatory cytokines IL-6 and IL-8 are consistently present in the SASP, and secreted by highly aggressive breast cancer cell lines, we aimed at elucidating their role on the less aggressive breast cancer cell line MCF-7, which does not secret these cytokines. METHODS: The MCF-7 cell line was treated with either senescence-conditioned medium (SCM), IL-6 or IL-8 and then evaluated for phenotypic (CD44 and CD24 by FACS) and functional changes associated with an EMT program (migration/invasion) and for the acquisition of stem cell properties: mammosphere-forming capacity, expression of reprogramming factors (by qRT-PCR) and multilineage differentiation potential. We also evaluated the role of IL6 and IL8 in the cytokine-secreting, highly tumorigenic cell line MDA-MB-231. RESULTS: Our results show that treatment of MCF-7 cells with IL6 and IL8, alone or together, induced the appearance of cells with fibroblastoid morphology, increased CD44 expression and migration, self-renewal and multilineage differentiation capacity, all characteristics compatible with an EMT program and stemness. These changes closely resembled those induced by a SCM. Interestingly, SCM treatments further increased IL6 and IL8 secretion by MCF-7 cells, thus suggesting the participation of an autocrine loop. Indeed, neutralizing antibodies against IL6 and IL8 reversed the effects of SCM on MCF-7, pinpointing these cytokines as major mediators of EMT and stemness-related effects associated with the senescent microenvironment. Additionally, prolonged exposure of MCF cells to IL6 or IL8 induced the appearance of senescent cells, suggesting a mechanism by which senescence and inflammation are reinforced favouring the acquisition of EMT and stem-like features at the population level, thus increasing tumour aggressiveness. Strikingly, our results also show that both IL6 and IL8 are important to maintain aggressive traits in MDA-MB-231 cells, a highly tumorigenic cell line, which appears to be devoid of stemness-related features. CONCLUSIONS: This study demonstrates that, similar to what is observed with a senescent microenvironment, purified IL6 and IL8 induce a self- and cross-reinforced senescence/inflammatory milieu responsible for the emergence of epithelial plasticity and stemness features, thus conferring more aggressive phenotypes to a luminal breast cancer cell line. On the other hand, the basal-like MDA-MB-231 cells, whose aggressiveness-related features depend on IL6 and IL8 secretion, almost completely lack mammosphere formation and differentiation capacities, suggesting that tumour aggressiveness is not always related to stemness.
Overview
The claims and statistics of this paper haven’t been checked yet.
Run the check — free, no account needed. It reads the open-access text and checks the sources it cites.
Integrity signals
Registry
Cites
Statistics
Figures
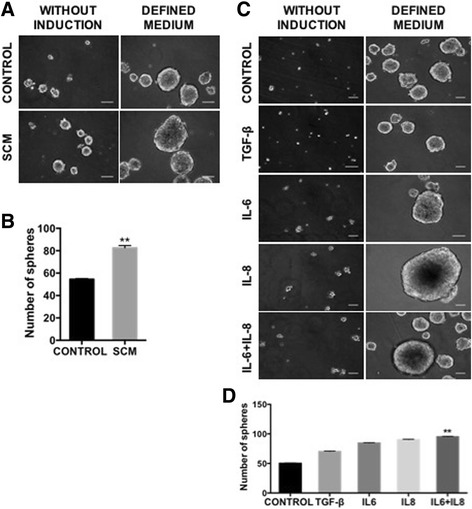
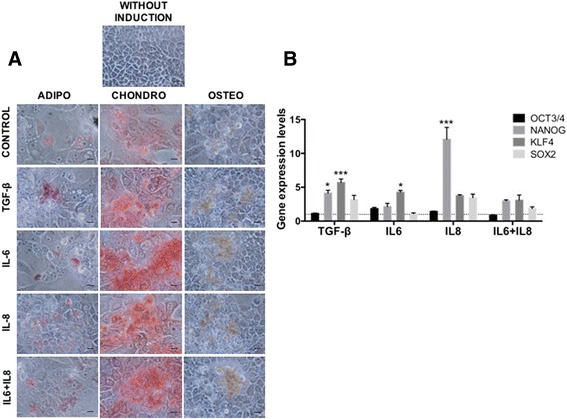
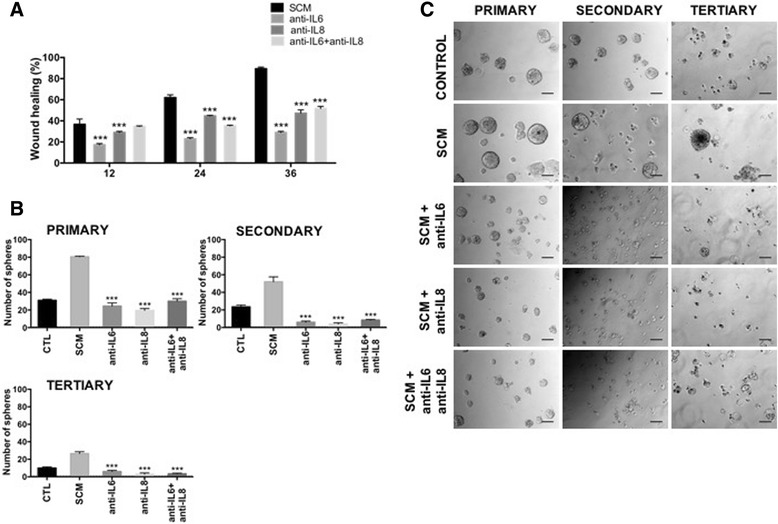
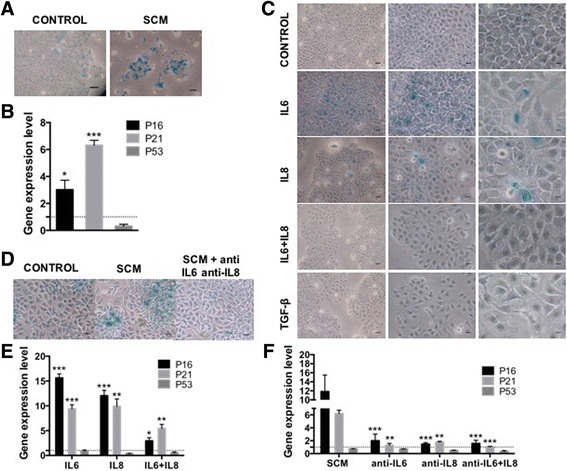
Verification
Claims the paper makes
The claims and statistics of this paper haven’t been checked yet.
Run the check — free, no account needed. It reads the open-access text and checks the sources it cites.
Claims other papers make about this one
Each is checked against this paper’s own text: does it say what the citing paper says it does?
The source backs part of the claim, not all of it — or backs it for a different population, condition or comparison.
In the citing paper
“IL-6 and IL-8, two well- characterized and abundant SASP factors, are known drivers of cancer proliferation 163,164 .”
From Senescence and cancer — role and therapeutic opportunities (2022) · cites this paper as [164]
Experimental — accuracy not yet measuredThe source backs part of the claim, not all of it — or backs it for a different population, condition or comparison.
In the citing paper
“but also enhance SASP autocrine loop, as found in multiple previous studies,124,125,126,127”
From Single-cell senescence identification reveals senescence heterogeneity, trajectory, and modulators (2024) · cites this paper as [126]
Experimental — accuracy not yet measured
Self-check
Percentages, sums and reported differences re-computed from the paper’s own numbers.
The self-check needs the paper’s full text.
Citations
Cites
Analyzing real-time PCR data by the comparative CT method
Schmittgen, T. D., & Livak, K. J. (2008) · Nature Protocols · doi:10.1038/nprot.2008.73 · Cited by 26,190
The Epithelial-Mesenchymal Transition Generates Cells with Properties of Stem Cells
Mani, S. A., Guo, W., Liao, M.-J., Eaton, E. N., Ayyanan, A., Zhou, A. Y., Brooks, M. W., Reinhard, F., Zhang, C. C., Shipitsin, M. V., et al. (2008) · Cell · doi:10.1016/j.cell.2008.03.027 · Cited by 8,839
p53 Mutations in Human Cancers
Hollstein, M., Sidransky, D., Vogelstein, B., & Harris, C. C. (1991) · Science · doi:10.1126/science.1905840 · Cited by 8,018
Specific Association of Human Telomerase Activity with Immortal Cells and Cancer
Kim, N. W., Piatyszek, M. A., Prowse, K. R., Harley, C. B., West, M. D., Ho, P. L. C., Coviello, G. M., Wright, W. E., Weinrich, S. L., & Shay, J. W. (1994) · Science · doi:10.1126/science.7605428 · Cited by 7,091
The senescence-associated secretory phenotype: the dark side of tumor suppression
Coppé, J.-P., Desprez, P.-Y., Krtolica, A., & Campisi, J. (2010) · Annual Review of Pathology: Mechanisms of Disease · doi:10.1146/annurev-pathol-121808-102144 · Cited by 5,206
TGF-β-induced epithelial to mesenchymal transition
Xu, J., Lamouille, S., & Derynck, R. (2009) · Cell Research · doi:10.1038/cr.2009.5 · Cited by 2,804
A survey of telomerase activity in human cancer
Shay, J. W., & Bacchetti, S. (1997) · European Journal of Cancer · doi:10.1016/s0959-8049(97)00062-2 · Cited by 2,794
Ben‐Porath, I., Thomson, M., Carey, V. J., Ge, R., Bell, G. W., Regev, A., & Weinberg, R. A. (2008) · Nature Genetics · doi:10.1038/ng.127 · Cited by 2,571
Senescence and tumour clearance is triggered by p53 restoration in murine liver carcinomas
Xue, W., Zender, L., Miething, C., Dickins, R. A., Hernando, E., Krizhanovsky, V., Cordon-Cardo, C., & Lowe, S. W. (2007) · Nature · doi:10.1038/nature05529 · Cited by 2,473
A complex secretory program orchestrated by the inflammasome controls paracrine senescence
Acosta, J. C., Banito, A., Wuestefeld, T., Georgilis, A., Janich, P., Morton, J. P., Athineos, D., Kang, T.-W., Lasitschka, F., Andrulis, M., et al. (2013) · Nature Cell Biology · doi:10.1038/ncb2784 · Cited by 2,278 · cited 1×
“This paracrineinduced senescence has also been shown recently for TGF-β, VEGF and CCL2 suggesting that this is a general mechanism for senescence propagation involving not only tumour cells but also surrounding stromal cells [81].”
Background
Cited by
Sorted by citations
Items 401–428 of 428
Song, H., Yang, M., Wu, S., Dai, Q., Qin, W., Xie, W., Chen, Y., Jiang, X., Zhang, X., Deng, X., et al. (2026) · iScience · doi:10.1016/j.isci.2026.116033
The Ets family transcription factor EHF suppresses senescence-associated inflammatory responsesPreprint
Fumoto, Y., Fujikawa, M., Katayama, Y., Mahandaran, T., Ishikawa, F., & Miyoshi, T. (2026) · bioRxiv (Cold Spring Harbor Laboratory) · doi:10.64898/2026.05.31.728776
Cell-autonomous immunity model of aging and disease
Wu, F., Winer, D. A., & Furman, D. (2026) · Trends Open · doi:10.1016/j.treopn.2026.04.012
Bernardelli, C., Selvaggio, P., Cappello, G., Fede, E. D., Taci, E., Rosa, S., Colombo, E. A., Grazioli, P., Peli, V., Barilani, M., et al. (2026) · Biomedicine & Pharmacotherapy · doi:10.1016/j.biopha.2026.119556
Inhibition of NHE1 induces trophoblast cell senescence via ADGRG6 mediated by CXCL8
Lin, Z., Shi, J., Huang, X., Wang, J., Zheng, Z., Chen, M., 朱晓勇, Li, M., & Shao, J. (2026) · Journal of Reproductive Immunology · doi:10.1016/j.jri.2026.104927
Khorraminejad‐Shirazi, M., Sani, M., Falamarzi, K., Sani, F., Dehghan, Y., Nazari, M. B., Hassannia, E., Aminnia, S., Mosalamiaghili, S., Mokarram, P., et al. (2026) · Scientific Reports · doi:10.1038/s41598-026-58275-7
Strong paracrine effects of the SASP from senescent SEO-COPD fibroblasts
Meuleman, R. A., Timens, W., Kooistra, W., van den Berge, M., Brandsma, C., & Woldhuis, R. R. (2026) · Heliyon · doi:10.1016/j.heliyon.2026.e45164 · Cited by 1
Liu, S., Zhang, Y., Li, L., Wang, H., Yuan, H., Zhang, D. C., Zhao, D., Guan, Y., & Yuan, Z. (2026) · Biology Direct · doi:10.1186/s13062-026-00901-5
Han, Y., Ma, L., & Ma, X. (2026) · Biology Direct · doi:10.1186/s13062-026-00908-y
Pioger, A., Martin, N., Abbadie, C., & Dehennaut, V. (2026) · Biochimica et Biophysica Acta (BBA) - Reviews on Cancer · doi:10.1016/j.bbcan.2026.189665
Capece, M., Reshetnikova, E., Wang, Y., Katuwal, N. B., Bellan, D. D. L., Kumar, A., Bharti, V., Watkins, R., Krull, J. E., Gu, S., et al. (2026) · Journal for ImmunoTherapy of Cancer · doi:10.1136/jitc-2025-013441
Wang, R., Shang, D., Tu, Z., & Liu, H. (2026) · Expert Opinion on Therapeutic Targets · doi:10.1080/14728222.2026.2709798
Senescence-Associated Exosomes and Intercellular Communication in Cancer
Arjmand, B., Shahrahmani, F., Moradi, S., Alavi-Moghadam, S., Rezaei–Tavirani, M., Janbabaei, G., & Rad, S. (2026) · Regenerative Engineering and Translational Medicine · doi:10.1007/s40883-026-00621-2
The structural origin of irreversible transitions in biological networks
Kim, J., Jang, S., Lee, J., Hopper, C., & Cho, K. (2026) · Proceedings of the National Academy of Sciences · doi:10.1073/pnas.2600800123
Etrouth, S., Zhu, Y., & Zhang, D. (2026) · Journal of Respiration · doi:10.3390/jor6030021
Gao, X., Zhang, Y., Sun, Y., & Xu, T. (2026) · Frontiers in Oncology · doi:10.3389/fonc.2026.1853883
Japranata, V. V., Liu, M., Boncimino, F., Cicco, E. D., Palumbo, S., Todorova, K. A., Gantumur, E., Sol, S., & Mandinova, A. (2026) · Cells · doi:10.3390/cells15171586
Du, L., Zhang, Y., Liang, R., Song, B., Zhou, J., 夏贤武, Liu, C., Wu, K., & Cao, X. (2026) · Journal of Hematology & Oncology · doi:10.1186/s13045-026-01847-x
Jathar, A., Ganure, K. A., Fatema, S., Farooqui, M. N., Jirekar, D., Ghumare, P., Patil, P. S., & Madar, I. H. (2026) · ACS Applied Materials & Interfaces · doi:10.1021/acsami.6c14749
The p53-PA200 Feedback Loop Modulates Age-Dependent Tumorigenesis
Jiang, C.-Y., Wang, Y.-L., Lv, N., Cai, B., & Jiang, T.-X. (2026) · International Journal of Molecular Sciences · doi:10.3390/ijms27198783
Cellular senescence: six decades of discovery and reinvention
Klaver, M., Steeneken, L. S., Veeningen, N., Altulea, A., & Demaria, M. (2026) · The EMBO Journal · doi:10.1038/s44318-026-00922-w
Verdugo‐Sivianes, E. M., Campos‐Silva, C., García-Márquez, J. L., & Aguado-Domínguez, E. (2026) · Cancers · doi:10.3390/cancers18193204
Li, Z., Zhang, Z., Zhao, Q., Zhu, Z., Yang, K., Meng, Y., Zhang, Q., & Yu, W. (2026) · Experimental & Molecular Medicine · doi:10.1038/s12276-026-01864-3
Tcypileva, A. S., Floren, D. D., Docshin, P. M., & Malashicheva, A. (2026) · Translational Medicine · doi:10.18705/2311-4495-2026-13-4-399-414
Pereira, S. D., Padam, K. S. R., Shruptha, P., Atreya, A., Joshi, M. B., & Satyamoorthy, K. (2026) · Inflammation Research · doi:10.1007/s00011-026-02391-7
Chang, X., Jiang, L., Zhang, L., Ren, T., Fan, C., & Li, P. (2026) · PeerJ · doi:10.7717/peerj.21835
Lyu, S., & González-Angulo, E. (2026) · Diagnostics · doi:10.3390/diagnostics16213466
Naseer, S., Tan, W.-Y., Sow, Y.-T., Wai, Z.-Y., Ramanitharan, S.-S., Bay, P.-E., Chen, C., & Chye, S. M. (2026) · Nutrients · doi:10.3390/nu18213522
Metadata
- Authors
- Ortiz-Montero, P., Londoño-Vallejo, A., & Vernot, J.-P.
- Affiliations
- Universidad Nacional de Colombia (CO)
- Corresponding author
- Vernot, Jean-Paul
- ORCID
- Vernot, Jean-Paul
- Venue
- Cell Communication and Signaling
- Published
- 2017-05-04
- Volume
- 15
- Issue
- 1
- Pages
- 17-17
- ISSN
- 1478-811X (ISSN-L)
- PMC
- PMC5418812
- OpenAlex
- W2611479744
- Cited by
- 428
- References
- 88
- Citations by year
- 2026: 58 · 2025: 87 · 2024: 57 · 2023: 35 · 2022: 47 · 2021: 63 · 2020: 37 · 2019: 20 · 2018: 21 · 2017: 3
- FWCI
- 16.40
- Type
- journal article
- Language
- en
- Open access
- gold
- doi.org
- Licence
- cc-by
- Locations
- Cell Communication and Signaling (publishedVersion, cc-by)
- PubMed Central (publishedVersion, cc-by)
- PubMed (publishedVersion)
- HAL (submittedVersion, cc-by)
- DOAJ (DOAJ: Directory of Open Access Journals) (submittedVersion, cc-by-sa)
- Funders
- Patrimonio Autónomo Fondo Nacional de Financiamiento para la Ciencia, la Tecnología y la Innovación, Francisco José de Caldas, Colciencias (Contract No RC-692–2013)
- DIEB and Faculty of Medicine, Universidad Nacional de Colombia. (30174)
- Topics
- Life Sciences › Biochemistry, Genetics and Molecular Biology › Cell Biology › Telomeres, Telomerase, and Senescence
- Health Sciences › Medicine › Oncology › Cancer Cells and Metastasis
- Life Sciences › Biochemistry, Genetics and Molecular Biology › Molecular Biology › TGF-β signaling in diseases
- Keywords
- senescence-associated secretory phenotype, interleukin-6, interleukin-8, senescence, breast cancer, MCF-7 cells, MDA-MB-231 cells, epithelial-mesenchymal transition, cancer stemness, tumorigenicity, autocrine loop, inflammation, multilineage differentiation, CD44, CD24
- MeSH terms
- Breast Neoplasms, Humans, Inflammation, Phenotype, Interleukin-6, Interleukin-8, Cellular Senescence, Culture Media, Conditioned, MCF-7 Cells, Carcinogenesis
About these checks
Registry, retraction, Cites and statistics results are computed, not judged, with one exception: a printed reference that no index lists is read once by a model before it counts as a citation error. Claims are extracted by a model and kept only when their quote appears verbatim in the text; each cited source is then checked, with a model’s help, for whether it says what the claim relies on. Those verdicts can be wrong — read the claim’s quote and the cited source before relying on one.
Statistics and arithmetic are recomputed, not judged.
Confidence bands are shown only for fields calibrated on our annotated test set. None is calibrated yet, so no band is shown.
What counts as a claim ›How we measure confidence ›How we check this ›
Are you an author, or do you see a problem with this page? Request a review
