Student or educator? Sign up with your school email and get 6 months of Pro free.
Cited by 29

The DOI matches its Crossref record; 50 of the 50 references it cites were found in a registry or an index.

Elevated circulating TGFβ1 during acute liver failure activates TGFβR2 on cortical neurons and exacerbates neuroinflammation and hepatic encephalopathy in mice

McMillin, Matthew, Grant, Stephanie, Frampton, Gabriel, Petrescu, Anca D., Williams, Elaina, Jefferson, Brandi, Thomas, Alison, Brahmaroutu, Ankita, DeMorrow, Sharon·2019·Journal of Neuroinflammation

Abstract

Acute liver failure resulting from drug-induced liver injury can lead to the development of neurological complications called hepatic encephalopathy (HE). Hepatic transforming growth factor beta 1 (TGFβ1) is upregulated due to liver failure in mice and inhibiting circulating TGFβ reduced HE progression. However, the specific contributions of TGFβ1 on brain cell populations and neuroinflammation during HE are not known. Therefore, the aim of this study was to characterize hepatic and brain TGFβ1 signaling during acute liver failure and its contribution to HE progression using a combination of pharmacological and genetic approaches. C57Bl/6 or neuron-specific transforming growth factor beta receptor 2 (TGFβR2) null mice (TGFβR2 ΔNeu ) were treated with azoxymethane (AOM) to induce acute liver failure and HE. The activity of circulating TGFβ1 was inhibited in C57Bl/6 mice via injection of a neutralizing antibody against TGFβ1 (anti-TGFβ1) prior to AOM injection. In all mouse treatment groups, liver damage, neuroinflammation, and neurological deficits were assessed. Inflammatory signaling between neurons and microglia were investigated in in vitro studies through the use of pharmacological inhibitors of TGFβ1 signaling in HT-22 and EOC-20 cells. TGFβ1 was expressed and upregulated in the liver following AOM injection. Pharmacological inhibition of TGFβ1 after AOM injection attenuated neurological decline, microglia activation, and neuroinflammation with no significant changes in liver damage. TGFβR2 ΔNeu mice administered AOM showed no effect on liver pathology but significantly reduced neurological decline compared to control mice. Microglia activation and neuroinflammation were attenuated in mice with pharmacological inhibition of TGFβ1 or in TGFβR2 ΔNeu mice. TGFβ1 increased chemokine ligand 2 (CCL2) and decreased C-X3-C motif ligand 1 (CX3CL1) expression in HT-22 cells and reduced interleukin-1 beta (IL-1ß) expression, tumor necrosis factor alpha (TNFα) expression, and phagocytosis activity in EOC-20 cells. Increased circulating TGFβ1 following acute liver failure results in activation of neuronal TGFβR2 signaling, driving neuroinflammation and neurological decline during AOM-induced HE.

Overview

The claims and statistics of this paper haven’t been checked yet.

Run the check — free, no account needed. It reads the open-access text and checks the sources it cites.

A few free checks a day · papers already verified open instantly · results are public

Integrity signals

Registry

Crossref · 10.1186/s12974-019-1455-y

Cites

50 of 50 references verified0 citation errors · 0 not checkable

Statistics

Figures

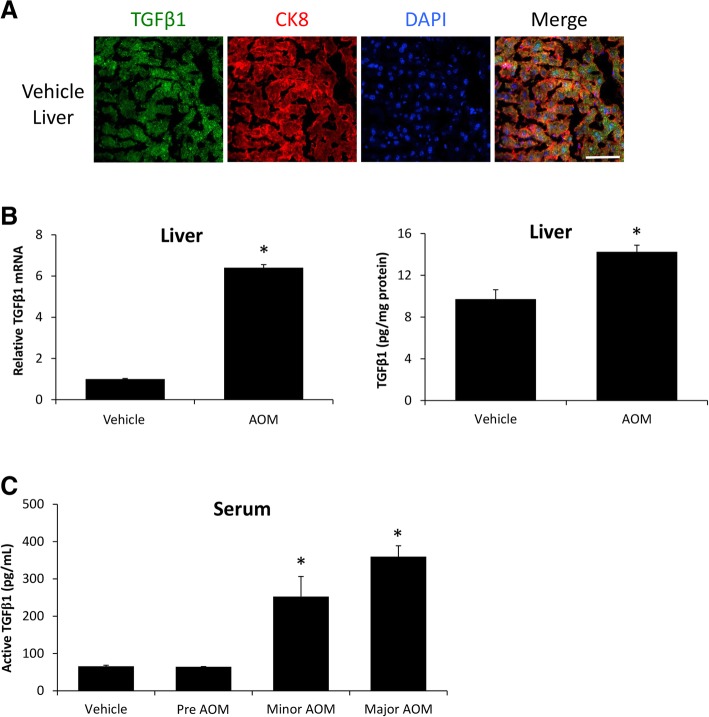
Fig. 1 Hepatic TGFβ1 is increased during AOM-induced HE. a Immunofluorescence for TGFβ1 (green) and CK8 (red) in mice injected with saline. Scale bar indicates 50 μM. b Relative TGFβ1 mRNA expression in the livers from vehicle- and AOM-treated mice. c Concentration of active TGFβ1 levels in liver homogenates normalized by total protein concentration in vehicle and AOM-treated mice. d Serum active TGFβ1 concentration measured in picograms per milliliter of serum from vehicle and AOM-treated time course mice. *p < 0.05 compared to vehicle-treated mice. n = 3 for TGFβ1 mRNA analyses and n = 4 for ELISA analyses
Fig. 1 Hepatic TGFβ1 is increased during AOM-induced HE. a Immunofluorescence for TGFβ1 (green) and CK8 (red) in mice injected with saline. Scale bar indicates 50 μM. b Relative TGFβ1 mRNA expression in the livers from vehicle- and AOM-treated mice. c Concentration of active TGFβ1 levels in liver homogenates normalized by total protein concentration in vehicle and AOM-treated mice. d Serum active TGFβ1 concentration measured in picograms per milliliter of serum from vehicle and AOM-treated time course mice. *p < 0.05 compared to vehicle-treated mice. n = 3 for TGFβ1 mRNA analyses and n = 4 for ELISA analysesCC BY · PubMed Central
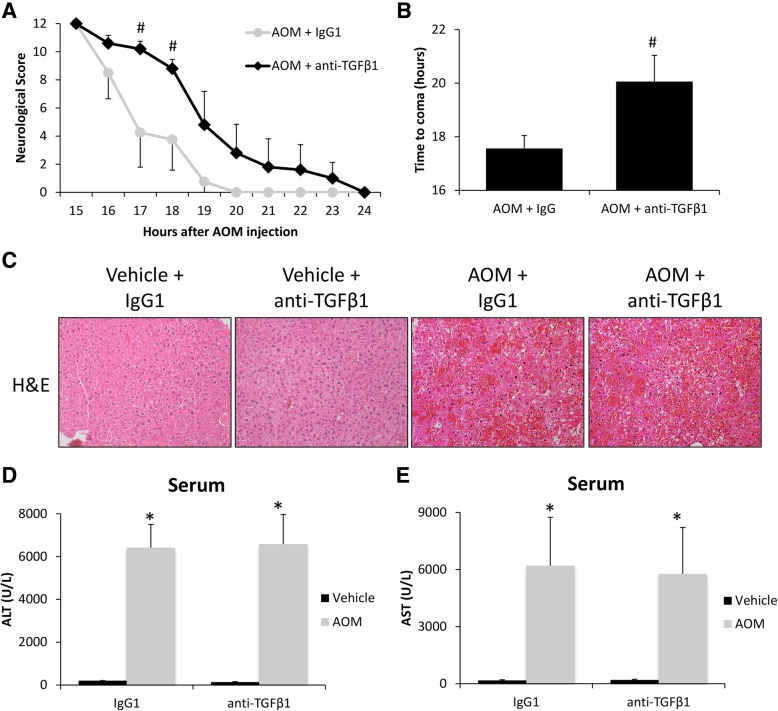
Fig. 2 TGFβ1 contributes to HE-induced neurological decline. a Neurological score analyses as assessed by reflex scores and ataxia at the indicated hours post-AOM injection in AOM-treated mice pre-treated with IgG1 or anti-TGFβ1. b Time taken to progress to coma in hours of AOM-treated mice infused with IgG1 or anti-TGFβ1. c Representative H&E images from the livers of vehicle- or AOM-treated mice pre-treated with IgG1 or anti-TGFβ1. d Serum ALT levels of vehicle- or AOM-treated mice pre-treated with IgG1 or anti-TGFβ1. e Serum AST levels of vehicle- or AOM-treated mice pre-treated with IgG1 or anti-TGFβ1. *p < 0.05 compared to vehicle and IgG1-treated mice, #p < 0.05 compared to AOM- and IgG1-treated mice. For all analyses, n = 4 for AOM-treated with IgG1 groups and n = 5 for AOM and anti-TGFβ1 groups.
Fig. 2 TGFβ1 contributes to HE-induced neurological decline. a Neurological score analyses as assessed by reflex scores and ataxia at the indicated hours post-AOM injection in AOM-treated mice pre-treated with IgG1 or anti-TGFβ1. b Time taken to progress to coma in hours of AOM-treated mice infused with IgG1 or anti-TGFβ1. c Representative H&E images from the livers of vehicle- or AOM-treated mice pre-treated with IgG1 or anti-TGFβ1. d Serum ALT levels of vehicle- or AOM-treated mice pre-treated with IgG1 or anti-TGFβ1. e Serum AST levels of vehicle- or AOM-treated mice pre-treated with IgG1 or anti-TGFβ1. *p < 0.05 compared to vehicle and IgG1-treated mice, #p < 0.05 compared to AOM- and IgG1-treated mice. For all analyses, n = 4 for AOM-treated with IgG1 groups and n = 5 for AOM and anti-TGFβ1 groups.CC BY · PubMed Central
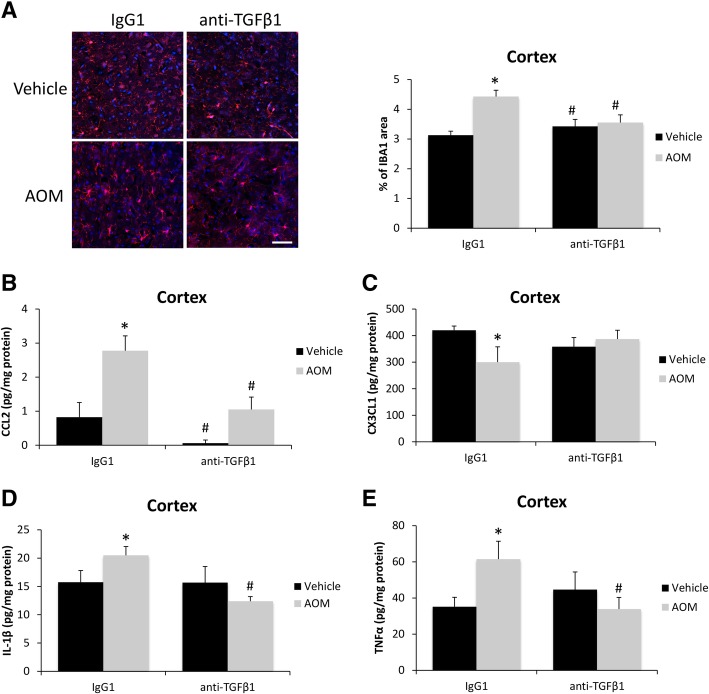
Fig. 3 TGFβ1 promotes microglia proliferation and neuroinflammation. a Representative staining and quantification for IBA1 (red) in the cortex from IgG1 or anti-TGFβ1 mice administered saline (vehicle) or AOM. DAPI (blue) was used to stain nuclei. Scale bar indicates 50 μM. b CCL2 protein expression normalized by total protein concentration in the cortex of IgG1 or anti-TGFβ1 mice administered vehicle or AOM. c CX3CL1 protein expression normalized by total protein concentration in the cortex of IgG1 or anti-TGFβ1 mice administered vehicle or AOM. d IL-1β protein expression normalized by total protein concentration in the cortex of IgG1 or anti-TGFβ1 mice administered vehicle or AOM. e TNFα protein expression normalized by total protein concentration in the cortex of IgG1 or anti-TGFβ1 mice administered vehicle or AOM. *p < 0.05 compared to vehicle- and IgG1-treated mice, #p < 0.05 compared to AOM- and IgG1-treated mice. n = 3 for all analyses
Fig. 3 TGFβ1 promotes microglia proliferation and neuroinflammation. a Representative staining and quantification for IBA1 (red) in the cortex from IgG1 or anti-TGFβ1 mice administered saline (vehicle) or AOM. DAPI (blue) was used to stain nuclei. Scale bar indicates 50 μM. b CCL2 protein expression normalized by total protein concentration in the cortex of IgG1 or anti-TGFβ1 mice administered vehicle or AOM. c CX3CL1 protein expression normalized by total protein concentration in the cortex of IgG1 or anti-TGFβ1 mice administered vehicle or AOM. d IL-1β protein expression normalized by total protein concentration in the cortex of IgG1 or anti-TGFβ1 mice administered vehicle or AOM. e TNFα protein expression normalized by total protein concentration in the cortex of IgG1 or anti-TGFβ1 mice administered vehicle or AOM. *p < 0.05 compared to vehicle- and IgG1-treated mice, #p < 0.05 compared to AOM- and IgG1-treated mice. n = 3 for all analysesCC BY · PubMed Central
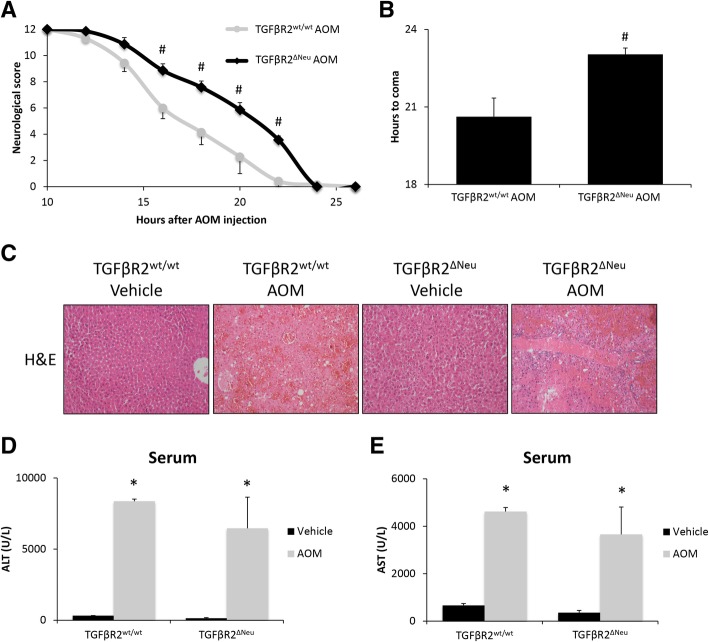
Fig. 4 Neuronal TGFβR2 mediates AOM-induced neurological decline. a Neurological score analyses as assessed by reflex scores and ataxia at the indicated hours post-AOM injection in TGFβR2wt/wt and TGFβR2ΔNeu mice. b Time taken to progress to coma in TGFβR2wt/wt and TGFβR2ΔNeu mice administered AOM. c Representative H&E images from the livers of TGFβR2wt/wt and TGFβR2ΔNeu mice administered vehicle or AOM. d Serum ALT levels of TGFβR2wt/wt and TGFβR2ΔNeu mice administered vehicle or AOM. e Serum AST levels of TGFβR2wt/wt and TGFβR2ΔNeu mice administered vehicle or AOM. *p < 0.05 compared to TGFβR2wt/wt vehicle-treated mice, #p < 0.05 compared to TGFβR2wt/wt AOM-treated mice. n = 4 for all analyses
Fig. 4 Neuronal TGFβR2 mediates AOM-induced neurological decline. a Neurological score analyses as assessed by reflex scores and ataxia at the indicated hours post-AOM injection in TGFβR2wt/wt and TGFβR2ΔNeu mice. b Time taken to progress to coma in TGFβR2wt/wt and TGFβR2ΔNeu mice administered AOM. c Representative H&E images from the livers of TGFβR2wt/wt and TGFβR2ΔNeu mice administered vehicle or AOM. d Serum ALT levels of TGFβR2wt/wt and TGFβR2ΔNeu mice administered vehicle or AOM. e Serum AST levels of TGFβR2wt/wt and TGFβR2ΔNeu mice administered vehicle or AOM. *p < 0.05 compared to TGFβR2wt/wt vehicle-treated mice, #p < 0.05 compared to TGFβR2wt/wt AOM-treated mice. n = 4 for all analysesCC BY · PubMed Central
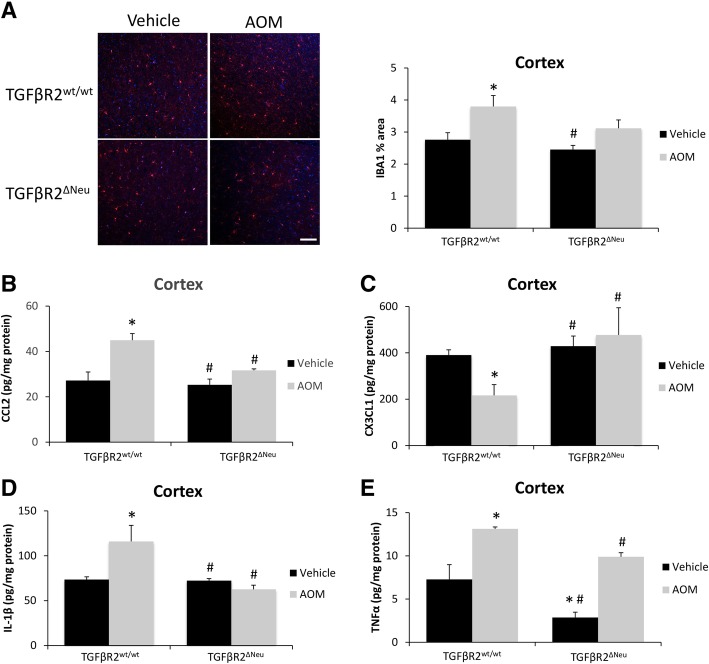
Fig. 5 Neuroinflammation during AOM-induced HE is driven by TGFβR2 in neurons. a Representative staining and quantification for IBA1 (red) in the cortex from of TGFβR2wt/wt and TGFβR2ΔNeu mice administered vehicle or AOM. DAPI (blue) was used to stain nuclei. Scale bar indicates 75 μM. b CCL2 protein expression normalized by total protein concentration in the cortex of TGFβR2wt/wt and TGFβR2ΔNeu mice administered vehicle or AOM. c CX3CL1 protein expression normalized by total protein concentration in the cortex of TGFβR2wt/wt and TGFβR2ΔNeu mice administered vehicle or AOM. d IL-1β protein expression normalized by total protein concentration in the cortex of TGFβR2wt/wt and TGFβR2ΔNeu mice administered vehicle or AOM. e TNFα protein expression normalized by total protein concentration in the cortex of TGFβR2wt/wt and TGFβR2ΔNeu mice administered vehicle or AOM. *p < 0.05 compared to TGFβR2wt/wt vehicle-treated mice, #p < 0.05 compared to TGFβR2wt/wt AOM-treated mice. n = 3 for all analyses
Fig. 5 Neuroinflammation during AOM-induced HE is driven by TGFβR2 in neurons. a Representative staining and quantification for IBA1 (red) in the cortex from of TGFβR2wt/wt and TGFβR2ΔNeu mice administered vehicle or AOM. DAPI (blue) was used to stain nuclei. Scale bar indicates 75 μM. b CCL2 protein expression normalized by total protein concentration in the cortex of TGFβR2wt/wt and TGFβR2ΔNeu mice administered vehicle or AOM. c CX3CL1 protein expression normalized by total protein concentration in the cortex of TGFβR2wt/wt and TGFβR2ΔNeu mice administered vehicle or AOM. d IL-1β protein expression normalized by total protein concentration in the cortex of TGFβR2wt/wt and TGFβR2ΔNeu mice administered vehicle or AOM. e TNFα protein expression normalized by total protein concentration in the cortex of TGFβR2wt/wt and TGFβR2ΔNeu mice administered vehicle or AOM. *p < 0.05 compared to TGFβR2wt/wt vehicle-treated mice, #p < 0.05 compared to TGFβR2wt/wt AOM-treated mice. n = 3 for all analysesCC BY · PubMed Central
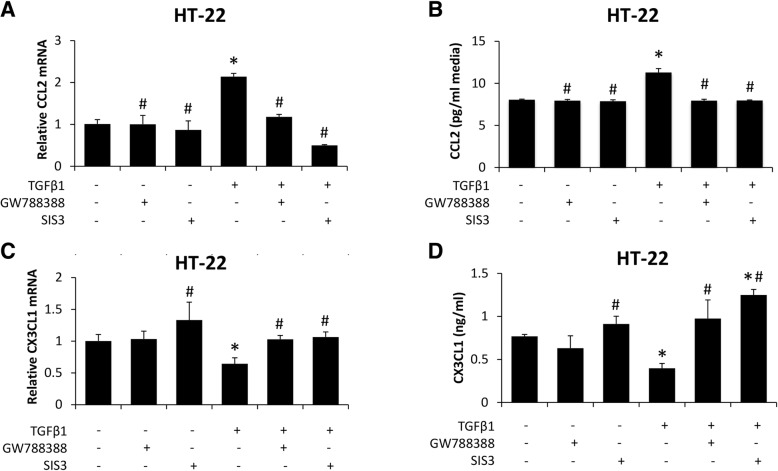
Fig. 6 Neuronal CCL2 and CX3CL1 expression is modulated by TGFβ1-mediated signaling. a Relative CCL2 mRNA expression of HT-22 cells treated with recombinant TGFβ1, GW788388, or SIS3. b CCL2 concentrations in HT-22 cell media treated with recombinant TGFβ1, GW788388, or SIS3. c Relative CX3CL1 mRNA expression of HT-22 cells treated with recombinant TGFβ1, GW788388, or SIS3. d CX3CL1 concentrations in HT-22 cell media treated with recombinant TGFβ1, GW788388, or SIS3. *p < 0.05 compared to basal HT-22 cells. #p < 0.05 compared to TGFβ1-treated HT-22 cells. n = 3 for mRNA analyses and n = 4 for ELISA analyses
Fig. 6 Neuronal CCL2 and CX3CL1 expression is modulated by TGFβ1-mediated signaling. a Relative CCL2 mRNA expression of HT-22 cells treated with recombinant TGFβ1, GW788388, or SIS3. b CCL2 concentrations in HT-22 cell media treated with recombinant TGFβ1, GW788388, or SIS3. c Relative CX3CL1 mRNA expression of HT-22 cells treated with recombinant TGFβ1, GW788388, or SIS3. d CX3CL1 concentrations in HT-22 cell media treated with recombinant TGFβ1, GW788388, or SIS3. *p < 0.05 compared to basal HT-22 cells. #p < 0.05 compared to TGFβ1-treated HT-22 cells. n = 3 for mRNA analyses and n = 4 for ELISA analysesCC BY · PubMed Central
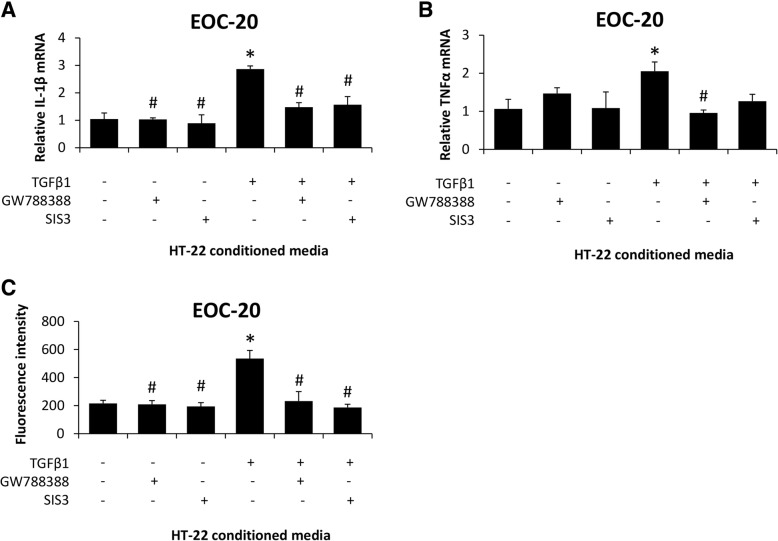
Fig. 7 Microglia activation is induced by secreted factors from TGFβ1-stimulated neurons. a Relative IL-1β and (b) TNFα mRNA expression in EOC-20 cells supplemented with conditioned media from HT-22 cells treated with recombinant TGFβ1, GW788388, or SIS3. c Phagocytosis activity, reported as fluorescence intensity of phagocytized E. coli bioparticles, in EOC-20 cells supplemented with conditioned media from HT-22 cells treated with recombinant TGFβ1, GW788388, or SIS3. *p < 0.05 compared to EOC-20 supplemented with basal HT-22 conditioned media. #p < 0.05 compared to EOC-20 supplemented with TGFβ1-treated HT-22 conditioned media. n = 3 for mRNA analyses and n = 7 for phagocytosis activity assay
Fig. 7 Microglia activation is induced by secreted factors from TGFβ1-stimulated neurons. a Relative IL-1β and (b) TNFα mRNA expression in EOC-20 cells supplemented with conditioned media from HT-22 cells treated with recombinant TGFβ1, GW788388, or SIS3. c Phagocytosis activity, reported as fluorescence intensity of phagocytized E. coli bioparticles, in EOC-20 cells supplemented with conditioned media from HT-22 cells treated with recombinant TGFβ1, GW788388, or SIS3. *p < 0.05 compared to EOC-20 supplemented with basal HT-22 conditioned media. #p < 0.05 compared to EOC-20 supplemented with TGFβ1-treated HT-22 conditioned media. n = 3 for mRNA analyses and n = 7 for phagocytosis activity assayCC BY · PubMed Central
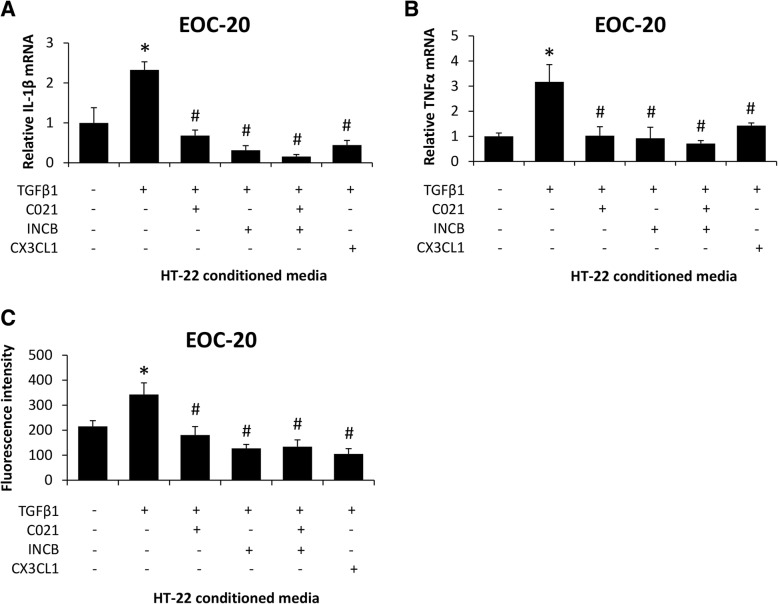
Fig. 8 TGFβ1-induced CCL2 and CX3CL1 modulation in neurons promote microglia activation. a Relative IL-1β and (b) TNFα mRNA expression in EOC-20 cells treated with C021, INCB, or recombinant CX3CL1 following supplementation with conditioned media from HT-22 cells treated with recombinant TGFβ1. c Phagocytosis activity, reported as fluorescence intensity of phagocytized E. coli bioparticles, in EOC-20 cells treated with C021, INCB, or recombinant CX3CL1 following supplementation with conditioned media from HT-22 cells treated with recombinant TGFβ1. *p < 0.05 compared to EOC-20 supplemented with basal HT-22 conditioned media. #p < 0.05 compared to EOC-20 supplemented with TGFβ1-treated HT-22 conditioned media. n = 3 for mRNA analyses and n = 7 for phagocytosis activity assay
Fig. 8 TGFβ1-induced CCL2 and CX3CL1 modulation in neurons promote microglia activation. a Relative IL-1β and (b) TNFα mRNA expression in EOC-20 cells treated with C021, INCB, or recombinant CX3CL1 following supplementation with conditioned media from HT-22 cells treated with recombinant TGFβ1. c Phagocytosis activity, reported as fluorescence intensity of phagocytized E. coli bioparticles, in EOC-20 cells treated with C021, INCB, or recombinant CX3CL1 following supplementation with conditioned media from HT-22 cells treated with recombinant TGFβ1. *p < 0.05 compared to EOC-20 supplemented with basal HT-22 conditioned media. #p < 0.05 compared to EOC-20 supplemented with TGFβ1-treated HT-22 conditioned media. n = 3 for mRNA analyses and n = 7 for phagocytosis activity assayCC BY · PubMed Central
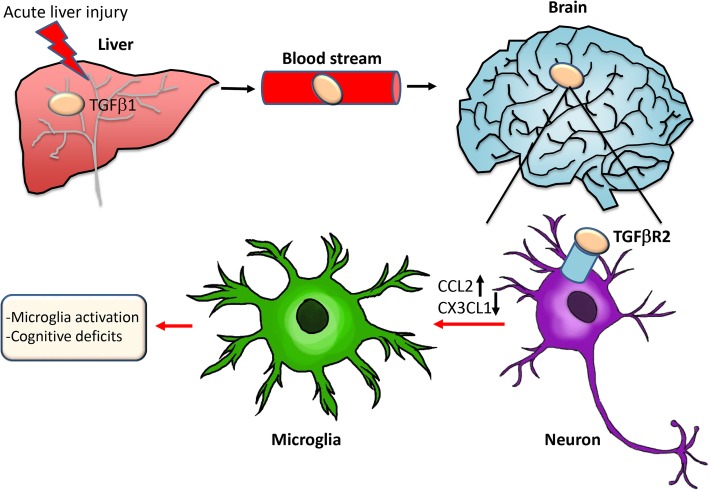
Fig. 9 Working model of TGFβ1 signaling during AOM-induced HE. AOM-induced liver failure leads to an increase of hepatic TGFβ1 that enters the bloodstream, crosses the blood–brain barrier, and enters the brain. This results in the activation of TGFβR2 on neurons leading to increased expression and secretion of CCL2 and decreased expression and secretion of CX3CL1 from neurons. This imbalance of CCL2 and CX3CL1 leads to changes in chemokine receptor-mediated signaling in microglia, which ultimately results in microglia activation and worse HE outcomes
Fig. 9 Working model of TGFβ1 signaling during AOM-induced HE. AOM-induced liver failure leads to an increase of hepatic TGFβ1 that enters the bloodstream, crosses the blood–brain barrier, and enters the brain. This results in the activation of TGFβR2 on neurons leading to increased expression and secretion of CCL2 and decreased expression and secretion of CX3CL1 from neurons. This imbalance of CCL2 and CX3CL1 leads to changes in chemokine receptor-mediated signaling in microglia, which ultimately results in microglia activation and worse HE outcomesCC BY · PubMed Central

Verification

Claims the paper makes

The claims and statistics of this paper haven’t been checked yet.

Run the check — free, no account needed. It reads the open-access text and checks the sources it cites.

A few free checks a day · papers already verified open instantly · results are public

Claims other papers make about this one

Each is checked against this paper’s own text: does it say what the citing paper says it does?

Self-check

Percentages, sums and reported differences re-computed from the paper’s own numbers.

The self-check needs the paper’s full text.

Citations

Cites

Show all 50 references

Research works printed but not linked: 1

  1. McMillin M, Galindo C, Pae HY, Frampton G, Di Patre P, Quinn M, et al. Gli1 activation and protection against hepatic encephalopathy is suppressed by circulating transforming growth factor β1 in mice. J Hepatol. 2014;61(6):1260–6. · DOI

Cited by

See all 29

Metadata

Authors
McMillin, M., Grant, S., Frampton, G., Petrescu, A. D., Williams, E., Jefferson, B., Thomas, A., Brahmaroutu, A., & DeMorrow, S.
Venue
Journal of Neuroinflammation
Published
2019-04-02
Volume
16
Issue
1
ISSN
1742-2094
Cited by
29
References
50
Language
en
Licence
Funders
  • National Institute of Diabetes and Digestive and Kidney Diseases (DK082435, DK112803)
  • U.S. Department of Veterans Affairs (BX002638, BX003486)

About these checks

Registry, retraction, Cites and statistics results are computed, not judged, with one exception: a printed reference that no index lists is read once by a model before it counts as a citation error. Claims are extracted by a model and kept only when their quote appears verbatim in the text; each cited source is then checked, with a model’s help, for whether it says what the claim relies on. Those verdicts can be wrong — read the claim’s quote and the cited source before relying on one.

Statistics and arithmetic are recomputed, not judged.

Confidence bands are shown only for fields calibrated on our annotated test set. None is calibrated yet, so no band is shown.

What counts as a claim ›How we measure confidence ›How we check this ›

Are you an author, or do you see a problem with this page? Request a review

How to cite

Cite CoChat for the checks on this page, and the paper for its own findings.

This page
CoChat. (2026). Citation check: Elevated circulating TGFβ1 during acute liver failure activates TGFβR2 on cortical neurons and exacerbates neuroinflammation and hepatic encephalopathy in mice. https://app.cochat.ai/papers/10.1186/s12974-019-1455-y
The paper
McMillin, M., Grant, S., Frampton, G., Petrescu, A. D., Williams, E., Jefferson, B., Thomas, A., Brahmaroutu, A., & DeMorrow, S. (2019). Elevated circulating TGFβ1 during acute liver failure activates TGFβR2 on cortical neurons and exacerbates neuroinflammation and hepatic encephalopathy in mice. Journal of Neuroinflammation. https://doi.org/10.1186/s12974-019-1455-y

Data sources

Bibliographic data: Semantic Scholar, OpenAlex, Crossref.

Contains information from the Semantic Scholar Academic Graph Datasets, made available under the ODC Attribution License (ODC-BY 1.0).

Semantic Scholar’s data is described in: Kinney, R., et al. (2023). The Semantic Scholar Open Data Platform. arXiv:2301.10140.