

The DOI matches its Crossref record; 47 of the 47 references it cites were found in a registry or an index.
Exposure to combustion generated environmentally persistent free radicals enhances severity of influenza virus infection
Open accessAbstract
BACKGROUND: Exposures to elevated levels of particulate matter (PM) enhance severity of influenza virus infection in infants. The biological mechanism responsible for this phenomenon is unknown. The recent identification of environmentally persistent free radicals (EPFRs) associated with PM from a variety of combustion sources suggests its role in the enhancement of influenza disease severity. METHODS: Neonatal mice (< seven days of age) were exposed to DCB230 (combustion derived PM with a chemisorbed EPFR), DCB50 (non-EPFR PM sample), or air for 30 minutes/day for seven consecutive days. Four days post-exposure, neonates were infected with influenza intranasally at 1.25 TCID50/neonate. Neonates were assessed for morbidity (% weight gain, peak pulmonary viral load, and viral clearance) and percent survival. Lungs were isolated and assessed for oxidative stress (8-isoprostanes and glutathione levels), adaptive immune response to influenza, and regulatory T cells (Tregs). The role of the EPFR was also assessed by use of transgenic mice expressing human superoxide dismutase 2. RESULTS: Neonates exposed to EPFRs had significantly enhanced morbidity and decreased survival following influenza infection. Increased oxidative stress was also observed in EPFR exposed neonates. This correlated with increased pulmonary Tregs and dampened protective T cell responses to influenza infection. Reduction of EPFR-induced oxidative stress attenuated these effects. CONCLUSIONS: Neonatal exposure to EPFR containing PM resulted in pulmonary oxidative stress and enhanced influenza disease severity. EPFR-induced oxidative stress resulted in increased presence of Tregs in the lungs and subsequent suppression of adaptive immune response to influenza.
Overview
The claims and statistics of this paper haven’t been checked yet.
Run the check — free, no account needed. It reads the open-access text and checks the sources it cites.
Integrity signals
Registry
Cites
Statistics
Figures
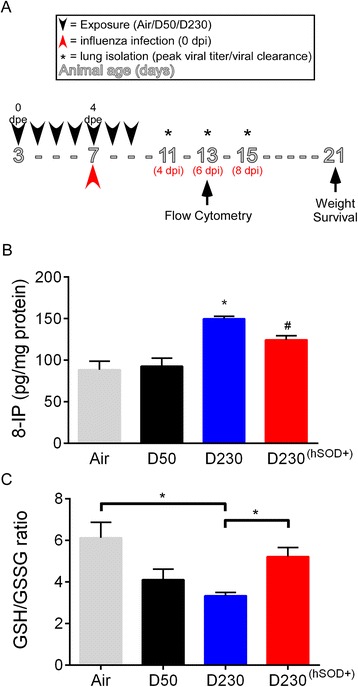
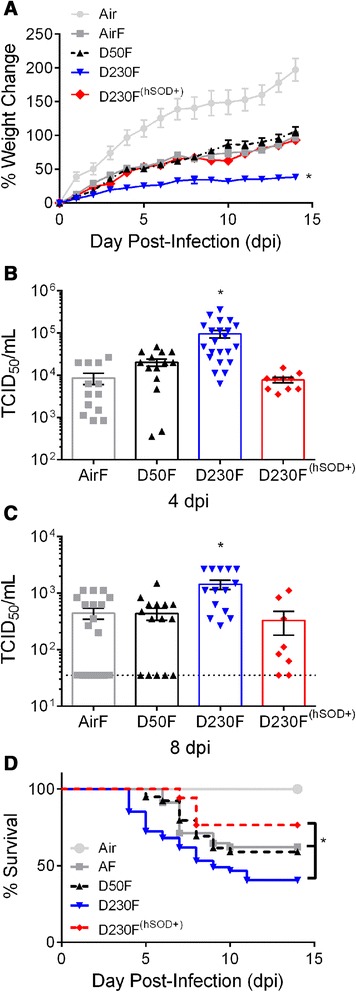
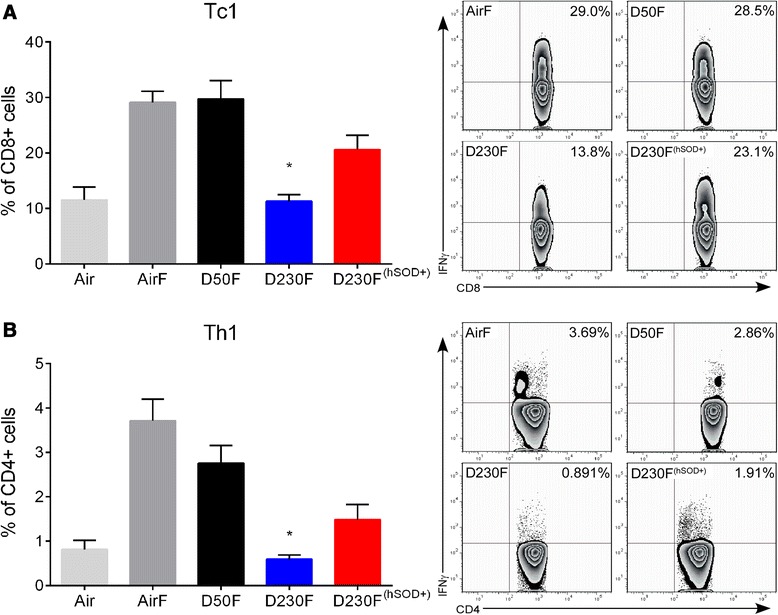
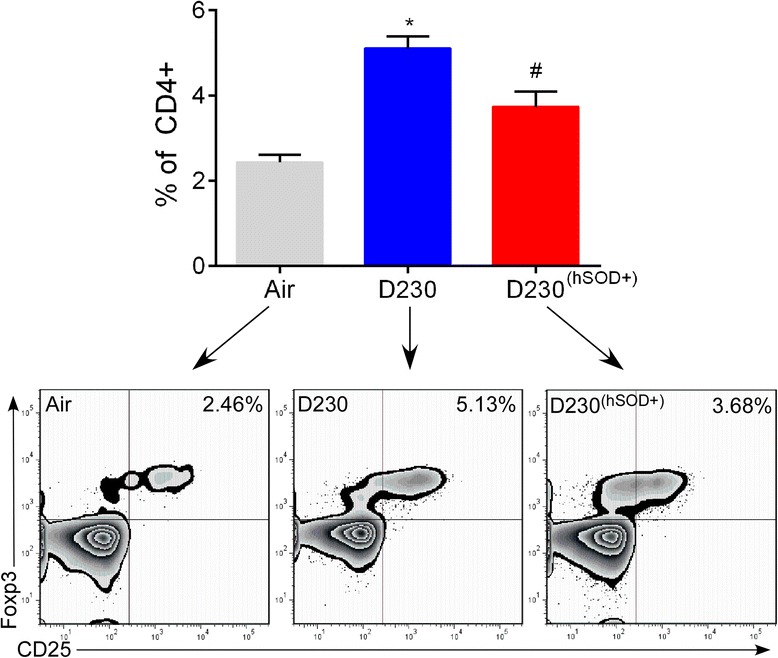
Verification
Claims the paper makes
The claims and statistics of this paper haven’t been checked yet.
Run the check — free, no account needed. It reads the open-access text and checks the sources it cites.
Claims other papers make about this one
Each is checked against this paper’s own text: does it say what the citing paper says it does?
The source backs part of the claim, not all of it — or backs it for a different population, condition or comparison.
In the citing paper
“Moreover, the initial immune suppression is relevant to respiratory infection risk, which investigators went on to show neonates exposed to PM0.1 early in life were more susceptible to severe influenza infection [74].”
From Air pollution and children’s health—a review of adverse effects associated with prenatal exposure from fine to ultrafine particulate matter (2021) · cites this paper as [74]
Experimental — accuracy not yet measuredThe source backs part of the claim, not all of it — or backs it for a different population, condition or comparison.
In the citing paper
“Successive research from this group supports the role of early life PM0.1 exposure and increased risk of both asthma and respiratory infection risk.”
From Air pollution and children’s health—a review of adverse effects associated with prenatal exposure from fine to ultrafine particulate matter (2021) · cites this paper as [74]
Experimental — accuracy not yet measured
Self-check
Percentages, sums and reported differences re-computed from the paper’s own numbers.
The self-check needs the paper’s full text.
Citations
Cites
Lung cancer, cardiopulmonary mortality, and long-term exposure to fine particulate air pollution
Pope III, C. A. (2002) · JAMA · doi:10.1001/jama.287.9.1132 · Cited by 8,447
Beitrag zur kollektiven Behandlung pharmakologischer Reihenversuche
Kärber, G. (1931) · Naunyn-Schmiedeberg s Archives of Pharmacology · doi:10.1007/bf01863914 · Cited by 3,074
Regulatory T cells: mechanisms of differentiation and function
Josefowicz, S. Z., Lu, L.-F., & Rudensky, A. Y. (2012) · Annual Review of Immunology · doi:10.1146/annurev.immunol.25.022106.141623 · Cited by 2,866
Valavanidis, A., Fiotakis, K., & Vlachogianni, T. (2008) · Journal of Environmental Science and Health Part C · doi:10.1080/10590500802494538 · Cited by 1,536
Indoor air pollution in developing countries and acute lower respiratory infections in children
Smith, K. R. (2000) · Thorax · doi:10.1136/thorax.55.6.518 · Cited by 948
THE METHOD OF ‘RIGHT AND WRONG CASES’ (‘CONSTANT STIMULI’) WITHOUT GAUSS'S FORMULAE
Spearman, C. (1908) · British Journal of Psychology 1904-1920 · doi:10.1111/j.2044-8295.1908.tb00176.x · Cited by 723
Effector T cells control lung inflammation during acute influenza virus infection by producing IL-10
Sun, J., Madan, R., Karp, C. L., & Braciale, T. J. (2009) · Nature Medicine · doi:10.1038/nm.1929 · Cited by 626
Role of Free Radicals in the Toxicity of Airborne Fine Particulate Matter
Dellinger, B., Pryor, W. A., Cueto, R., Squadrito, G. L., Hegde, V. K., & Deutsch, W. A. (2001) · Chemical Research in Toxicology · doi:10.1021/tx010050x · Cited by 533
Flow Cytometry: A Practical Approach
Ormerod, M. G. (1994) · Cited by 452
Health Effects of Particulate Air Pollution
Dockery, D. W. (2009) · Annals of Epidemiology · doi:10.1016/j.annepidem.2009.01.018 · Cited by 367
Cited by
Sorted by citations
Recent Insights into Particulate Matter (PM2.5)-Mediated Toxicity in Humans: An Overview
Thangavel, P., Park, D., & Lee, Y. (2022) · International Journal of Environmental Research and Public Health · doi:10.3390/ijerph19127511 · Cited by 815
Ruan, X., Sun, Y., Du, W., Tang, Y., Liu, Q., Zhang, Z., Doherty, W., Frost, R. L., Qian, G., & Tsang, D. C. W. (2019) · Bioresource Technology · doi:10.1016/j.biortech.2019.02.105 · Cited by 402
Effects of air pollutants on the transmission and severity of respiratory viral infections
Domingo, J. L., & Rovira, J. (2020) · Environmental Research · doi:10.1016/j.envres.2020.109650 · Cited by 387
Johnson, N. M., Hoffmann, A. R., Behlen, J. C., Lau, C., Pendleton, D., Harvey, N., Shore, R., Li, Y., Chen, J., Tian, Y., et al. (2021) · Environmental Health and Preventive Medicine · doi:10.1186/s12199-021-00995-5 · Cited by 339
“1 early in life were more susceptible to severe influenza infection [74].”
BackgroundEnvironmentally Persistent Free Radicals: Insights on a New Class of Pollutants
Vejerano, E. P., Rao, G., Khachatryan, L., Cormier, S. A., & Lomnicki, S. M. (2018) · Environmental Science & Technology · doi:10.1021/acs.est.7b04439 · Cited by 294
Self-citationAir pollution and temperature are associated with increased COVID-19 incidence: A time series study
Li, H., Xu, X.-L., Dai, D., Huang, Z.-Y., Ma, Z., & Guan, Y. (2020) · International Journal of Infectious Diseases · doi:10.1016/j.ijid.2020.05.076 · Cited by 288
Environmentally persistent free radicals: Occurrence, formation mechanisms and implications
Pan, B., Li, H., Lang, D., & Xing, B. (2019) · Environmental Pollution · doi:10.1016/j.envpol.2019.02.032 · Cited by 251
Odinga, E. S., Waigi, M. G., Gudda, F. O., Wang, J., Yang, B., Hu, X., Li, S., & Gao, Y. (2019) · Environment International · doi:10.1016/j.envint.2019.105172 · Cited by 230
Jia, H., Zhao, S. J., Shi, Y., Zhu, L. Y., Wang, C., & Sharma, V. K. (2018) · Environmental Science & Technology · doi:10.1021/acs.est.8b00425 · Cited by 213
Li, T., Yu, Y., Sun, Z., & Duan, J. (2022) · Particle and Fibre Toxicology · doi:10.1186/s12989-022-00507-5 · Cited by 210
Feng, C. X., Li, J., Sun, W., Zhang, Y., & Wang, Q. (2016) · Environmental Health · doi:10.1186/s12940-016-0115-2 · Cited by 198
SARS-CoV-2 infection, COVID-19 pathogenesis, and exposure to air pollution: What is the connection?
Woodby, B., Arnold, M. M., & Valacchi, G. (2021) · Annals of the New York Academy of Sciences · doi:10.1111/nyas.14512 · Cited by 160
Pollution, Infectious Disease, and Mortality: Evidence from the 1918 Spanish Influenza Pandemic
Clay, K. B., Lewis, J., & Severnini, E. (2015) · The Journal of Economic History · doi:10.1017/s002205071800058x · Cited by 147
Effect of ambient air pollutants and meteorological variables on COVID-19 incidence
Jiang, Y., Wu, X.-J., & Guan, Y. (2020) · Infection Control and Hospital Epidemiology · doi:10.1017/ice.2020.222 · Cited by 142
Formation of environmentally persistent free radicals on microplastics under UV irradiations
Liu, S., Huang, W., Yang, J., Xiong, Y., Huang, Z., Wang, J., Cai, T., Dang, Z., & Yang, C. (2023) · Journal of Hazardous Materials · doi:10.1016/j.jhazmat.2023.131277 · Cited by 143
Viral respiratory infections and air pollutants
Loaiza-Ceballos, M. C., Marín-Palma, D., Zapata, W., & Hernández, J. C. (2021) · Air Quality Atmosphere & Health · doi:10.1007/s11869-021-01088-6 · Cited by 120
Popović, I., Magalhães, R. J. S., Ge, E., Marks, G. B., Dong, G., Wei, X., & Knibbs, L. D. (2018) · Environmental Research · doi:10.1016/j.envres.2018.12.011 · Cited by 110
The 1918 Influenza Pandemic and Its Lessons for COVID-19
Beach, B., Clay, K. B., & Saavedra, M. H. (2022) · Journal of Economic Literature · doi:10.1257/jel.20201641 · Cited by 106
In utero ultrafine particulate matter exposure causes offspring pulmonary immunosuppression
Rychlik, K. A., Secrest, J. R., Lau, C., Pulczinski, J., Zamora, M. L., Leal, J., Langley, R., Myatt, L. G., Raju, M., Chang, R. C.-A., et al. (2019) · Proceedings of the National Academy of Sciences · doi:10.1073/pnas.1816103116 · Cited by 98
Pandemic meets pollution: Poor air quality increases deaths by COVID-19
Isphording, I. E., & Pestel, N. (2021) · Journal of Environmental Economics and Management · doi:10.1016/j.jeem.2021.102448 · Cited by 92
Particulate matter air pollution: effects on the respiratory system
Hamanaka, R. B., & Mutlu, G. M. (2025) · Journal of Clinical Investigation · doi:10.1172/jci194312 · Cited by 100
Clay, K. B., Lewis, J., & Severnini, E. (2019) · Economics & Human Biology · doi:10.1016/j.ehb.2019.03.010 · Cited by 83
Li, H., Chen, Q., Wang, C., Wang, R., Sha, T., Yang, X., & Ainur, D. (2022) · Journal of Hazardous Materials · doi:10.1016/j.jhazmat.2022.130087 · Cited by 81
Particulate matter pollution and the COVID-19 outbreak: results from Italian regions and provinces
Bianconi, V., Bronzo, P., Banach, M., Sahebkar, A., Mannarino, M. R., & Pirro, M. (2020) · Archives of Medical Science · doi:10.5114/aoms.2020.95336 · Cited by 76
The 1918 Influenza Pandemic and its Lessons for COVID-19
Beach, B., Clay, K. B., & Saavedra, M. H. (2020) · National Bureau of Economic Research · doi:10.3386/w27673 · Cited by 74
Dugas, T. R., Lomnicki, S. M., Cormier, S. A., Dellinger, B., & Reams, M. A. (2016) · International Journal of Environmental Research and Public Health · doi:10.3390/ijerph13060573 · Cited by 63
Self-citationGao, P., Yao, D., Qian, Y., Zhong, S., Zhang, L., Xue, G., & Jia, H. (2018) · Environmental Chemistry Letters · doi:10.1007/s10311-018-0757-0 · Cited by 65
Tao, R., Cao, W.-J., Li, M.-H., Yang, L., Dai, R., Luo, X., Liu, Y., Ge, B., Su, X., & Xu, J. (2020) · Molecular Immunology · doi:10.1016/j.molimm.2020.07.001 · Cited by 54
Patterson, M. C., DiTusa, M. F., McFerrin, C. A., Kurtz, R. L., Hall, R. W., Poliakoff, E. D., & Sprunger, P. T. (2017) · Chemical Physics Letters · doi:10.1016/j.cplett.2016.12.061 · Cited by 54
Mechanistic insight into the impact of nanomaterials on asthma and allergic airway disease
Meldrum, K., Guo, C., Marczylo, E. L., Gant, T. W., Smith, R. R., & Leonard, M. O. (2017) · Particle and Fibre Toxicology · doi:10.1186/s12989-017-0228-y · Cited by 57
Peaks of Fine Particulate Matter May Modulate the Spreading and Virulence of COVID-19
Rohrer, M., Flahault, A., & Stoffel, M. (2020) · Earth Systems and Environment · doi:10.1007/s41748-020-00184-4 · Cited by 49
Czwojdzińska, M., Terpińska, M., Kuźniarski, A., Płaczkowska, S., & Piwowar, A. (2021) · Biomedical Journal · doi:10.1016/j.bj.2021.11.006 · Cited by 48
Zhu, Y., Wei, J., Liu, Y., Liu, X., Li, J., & Zhang, J. (2019) · Scientific Reports · doi:10.1038/s41598-019-53781-3 · Cited by 47
Environmentally Persistent Free Radicals: Linking Air Pollution and Poor Respiratory Health?
Sly, P. D., Cormier, S. A., Lomnicki, S. M., Harding, J. N., & Grimwood, K. (2019) · American Journal of Respiratory and Critical Care Medicine · doi:10.1164/rccm.201903-0675le · Cited by 47
Self-citationAirborne fine particles drive H1N1 viruses deep into the lower respiratory tract and distant organs
Dong, Z., Ma, J., Qiu, J., Ren, Q., Shan, Q., Duan, X., Li, G., Zuo, Y. Y., Qi, Y., Liu, Y., et al. (2023) · Science Advances · doi:10.1126/sciadv.adf2165 · Cited by 45
Jaligama, S., Patel, V., Wang, P., Sallam, A., Harding, J. N., Kelley, M. A., Mancuso, S. R., Dugas, T. R., & Cormier, S. A. (2018) · Particle and Fibre Toxicology · doi:10.1186/s12989-018-0255-3 · Cited by 45
Self-citationToczyłowski, K., Wietlicka-Piszcz, M., Grabowska, M., & Sulik, A. (2021) · Viruses · doi:10.3390/v13040556 · Cited by 45
Association of indoor air pollution from coal combustion with influenza-like illness in housewives
Wang, B., Liu, Y., Li, Z., & Li, Z. (2016) · Environmental Pollution · doi:10.1016/j.envpol.2016.06.026 · Cited by 44
Lindner-Cendrowska, K., & Bröde, P. (2021) · International Journal of Biometeorology · doi:10.1007/s00484-021-02076-2 · Cited by 44
Jaligama, S., Saravia, J., You, D., Yadav, N., Lee, G. I., Shrestha, B., & Cormier, S. A. (2017) · Respiratory Research · doi:10.1186/s12931-016-0487-4 · Cited by 40
“Lungs were isolated and a single cell suspension was prepared as described earlier [10, 19].”
BackgroundMethodResultInfluentialSelf-citationSmallcombe, C. C., Harford, T. J., Linfield, D. T., Lechuga, S., Bokun, V., Piedimonte, G., & Rezaee, F. (2020) · American Journal of Physiology-Lung Cellular and Molecular Physiology · doi:10.1152/ajplung.00104.2020 · Cited by 38
Zhang, R. Y., Meng, Y., Song, H., Niu, R., Wang, Y., Li, Y., & Wang, S. (2021) · Respiratory Research · doi:10.1186/s12931-021-01744-6 · Cited by 37
Qin, L., Yang, L., Liu, L., Tong, S., Liu, Q. S., Li, G., Zhang, H., Zhu, W., Liu, G., Zheng, M., et al. (2024) · Nature Communications · doi:10.1038/s41467-024-55151-8 · Cited by 38
Janjua, S., Powell, P., Atkinson, R. W., Stovold, E. M., & Normansell, R. (2021) · Cochrane Database of Systematic Reviews · doi:10.1002/14651858.cd013441.pub2 · Cited by 40
Nozza, E., Valentini, S., Melzi, G., Vecchi, R., & Corsini, E. (2021) · The Science of The Total Environment · doi:10.1016/j.scitotenv.2021.146391 · Cited by 34
The effect of air pollution on the transcriptomics of the immune response to respiratory infection
Croft, D. P., Burton, D. S., Nagel, D. J., Bhattacharya, S., Falsey, A. R., Georas, S. N., Hopke, P. K., Johnston, C. J., Kottmann, R. M., Litonjua, A. A., et al. (2021) · Scientific Reports · doi:10.1038/s41598-021-98729-8 · Cited by 34
Alfei, S., & Pandoli, O. G. (2024) · Toxics · doi:10.3390/toxics12040245 · Cited by 36
Jaligama, S., Chen, Z., Saravia, J., Yadav, N., Lomnicki, S. M., Dugas, T. R., & Cormier, S. A. (2015) · Environmental Science & Technology · doi:10.1021/acs.est.5b01439 · Cited by 32
Self-citationChen, H., Zheng, X., Nicholas, J., Humes, S. T., Loeb, J. C., Robinson, S. E., Bisesi, J. H., Das, D., Saleh, N. B., Castleman, W. L., et al. (2017) · Virology Journal · doi:10.1186/s12985-017-0909-z · Cited by 30
Yi, J.-F., Lin, Z.-Z., Li, X., Zhou, Y.-Q., & Guo, Y. (2023) · Chemosphere · doi:10.1016/j.chemosphere.2023.139922 · Cited by 30
Association between particulate matter containing EPFRs and neutrophilic asthma through AhR and Th17
Harding, J. N., Gross, M., Patel, V., Potter, S. S., & Cormier, S. A. (2021) · Respiratory Research · doi:10.1186/s12931-021-01867-w · Cited by 29
Self-citationFormation of environmentally persistent free radicals and their risks for human health: a review
Wang, X., Liu, H., Xue, Y., Cui, L., Chen, L., Ho, K., & Huang, Y. H. (2024) · Environmental Chemistry Letters · doi:10.1007/s10311-024-01701-x · Cited by 32
Particulate Matter and COVID-19 Disease Diffusion in Emilia-Romagna (Italy). Already a Cold Case?
Delnevo, G., Mirri, S., & Roccetti, M. (2020) · Computation · doi:10.3390/computation8020059 · Cited by 28
Reed, J. R., Cruz, A. L. N. D., Lomnicki, S. M., & Backes, W. L. (2015) · Toxicology and Applied Pharmacology · doi:10.1016/j.taap.2015.09.021 · Cited by 26
Kumar, A., Patel, V., Harding, J. N., You, D., & Cormier, S. A. (2021) · Particle and Fibre Toxicology · doi:10.1186/s12989-021-00438-7 · Cited by 25
Self-citationComparative 6+studies of environmentally persistent free radicals on nano-sized coal dusts
Azam, S., Kurashov, V. N., Golbeck, J. H., Bhattacharyya, S., Zheng, S., & Liu, S. (2023) · The Science of The Total Environment · doi:10.1016/j.scitotenv.2023.163163 · Cited by 25
Reed, J. R., Cruz, A. L. N. D., Lomnicki, S. M., & Backes, W. L. (2015) · Biochemical Pharmacology · doi:10.1016/j.bcp.2015.03.012 · Cited by 24
Electronic Signatures of a Model Pollutant–Particle System: Chemisorbed Phenol on TiO2(110)
Patterson, M. C., Thibodeaux, C., Kizilkaya, O., Kurtz, R. L., Poliakoff, E. D., & Sprunger, P. T. (2015) · Langmuir · doi:10.1021/acs.langmuir.5b00030 · Cited by 25
Association between environmental factors and COVID-19 in Shanghai, China
Ma, Y., Cheng, B., Shen, J., Wang, H., Feng, F., Zhang, Y., & Jiao, H. (2021) · Environmental Science and Pollution Research · doi:10.1007/s11356-021-13834-5 · Cited by 24
Zhao, J., Shi, L., Shi, J., Li, H., Lang, D., Wei, Z., Li, S., & Pan, B. (2023) · Journal of Hazardous Materials · doi:10.1016/j.jhazmat.2023.130956 · Cited by 23
When Externalities Collide: Influenza and Pollution
Zivin, J. G., Neidell, M., Sanders, N., & Singer, G. (2023) · American Economic Journal Applied Economics · doi:10.1257/app.20210500 · Cited by 22
Seah, A., Loo, L. H., Jamali, N., Maiwald, M., & Aik, J. (2022) · Environmental Research · doi:10.1016/j.envres.2022.114453 · Cited by 21
Substantial changes in Gaseous pollutants and health effects during COVID-19 in Delhi, India
Singh, B. P., Pandey, P., Wabaidur, S. M., Avtar, R., Kumar, P., & Rahman, S. (2023) · PeerJ · doi:10.7717/peerj.14489 · Cited by 19
The interplay between environmental exposures and COVID-19 risks in the health of children
Sly, P. D., Trottier, B. A., Bulka, C. M., Cormier, S. A., Fobil, J. N., Fry, R. C., Kim, K., Kleeberger, S. R., Kumar, P., Landrigan, P. J., et al. (2021) · Environmental Health · doi:10.1186/s12940-021-00716-z · Cited by 18
Self-citationWeidemann, E., Andersson, P. L., Bidleman, T. F., Boman, C., Carlin, D. J., Collina, E. M., Cormier, S. A., Gouveia-Figueira, S. C., Gullett, B. K., Johansson, C., et al. (2016) · Environmental Science and Pollution Research · doi:10.1007/s11356-016-6308-y · Cited by 17
Self-citationPersistent free radicals in the environment
Qin, L., Zhu, W., Yang, L., Zheng, M., & Liu, G. (2025) · Journal of Hazardous Materials · doi:10.1016/j.jhazmat.2025.138332 · Cited by 17
Jainonthee, C., Wang, Y., Chen, C. W. K., & Jainontee, K. (2022) · Tropical Medicine and Infectious Disease · doi:10.3390/tropicalmed7110341 · Cited by 17
Aryal, A., Noël, A., Khachatryan, L., Cormier, S. A., Chowdhury, P. H., Penn, A. L., Dugas, T. R., & Harmon, A. C. (2023) · Environmental Pollution · doi:10.1016/j.envpol.2023.122183 · Cited by 16
Self-citationDetecting free radicals post viral infections
Damle, V. G., Wu, K., Arouri, D. J., & Schirhagl, R. (2022) · Free Radical Biology and Medicine · doi:10.1016/j.freeradbiomed.2022.08.013 · Cited by 14
Environmental Impacts on Infectious Disease: A Literature View of Epidemiological Evidence
Sly, P. D., Trottier, B. A., Araki, A., & Vilcins, D. (2022) · Annals of Global Health · doi:10.5334/aogh.3670 · Cited by 14
Akan, A. P. (2022) · Environmental Science and Pollution Research · doi:10.1007/s11356-021-18403-4 · Cited by 13
Guan, X., Truong, L., Lomnicki, S. M., Tanguay, R. L., & Cormier, S. A. (2021) · Toxics · doi:10.3390/toxics9010012 · Cited by 11
Self-citationRole of Electronegativity in Environmentally Persistent Free Radicals (EPFRs) Formation on ZnO
Ahmed, S. M., Oumnov, R. A., Kizilkaya, O., Hall, R. W., Sprunger, P. T., & Cook, R. L. (2024) · The Journal of Physical Chemistry C · doi:10.1021/acs.jpcc.3c08231 · Cited by 10
Behlen, J. C., Lau, C. H., Pendleton, D., Li, Y., Hoffmann, A. R., Golding, M. C., Zhang, R., & Johnson, N. M. (2022) · Antioxidants · doi:10.3390/antiox11020352 · Cited by 10
Aryal, A., Harmon, A. C., Varner, K. J., Noël, A., Cormier, S. A., Nde, D. B., Mottram, P. J., Maxie, J., & Dugas, T. R. (2024) · Toxicological Sciences · doi:10.1093/toxsci/kfae007 · Cited by 9
Self-citationEnvironmentally persistent free radicals enhance SARS-CoV-2 replication in respiratory epithelium
Yamamoto, A., Sly, P. D., Chew, K. Y., Khachatryan, L., Begum, N., Yeo, A. J., Vu, L. D., Short, K. R., Cormier, S. A., & Fantino, E. (2023) · Experimental Biology and Medicine · doi:10.1177/15353702221142616 · Cited by 9
Self-citationPM2.5-Related Neonatal Infections: A Global Burden Study from 1990 to 2019
Tang, Z., & Jia, J. (2022) · International Journal of Environmental Research and Public Health · doi:10.3390/ijerph19095399 · Cited by 8
Environmental Impacts on COVID-19: Mechanisms of Increased Susceptibility
Cormier, S. A., Yamamoto, A., Short, K. R., Vu, L. D., & Suk, W. A. (2022) · Annals of Global Health · doi:10.5334/aogh.3907 · Cited by 8
Self-citationFormation Mechanism of Environmentally Persistent Free Radicals on Alkaline Earth Oxide Surfaces
Liang, D., Liu, J., Feng, Y., Tu, K., Wang, L., Qiu, L., & Zhang, X. (2024) · The Journal of Physical Chemistry A · doi:10.1021/acs.jpca.3c07250 · Cited by 7
Yang, S., Fang, Z.-G., Lv, C.-X., An, S.-Y., Guan, P., Huang, D., & Wu, W. (2021) · Environmental Science and Pollution Research · doi:10.1007/s11356-021-16600-9 · Cited by 7
Lau, C. H., Behlen, J. C., Myers, A. N., Li, Y., Zhao, J., Harvey, N., Wright, G. A., Hoffmann, A. R., Zhang, R., & Johnson, N. M. (2022) · Environmental Science & Technology · doi:10.1021/acs.est.2c02786 · Cited by 7
Xiao, K., Wang, Z., Zhou, Y., Fu, D., Zhang, Y., Luo, Z., Lin, Y., Wang, Q., Pei, J., & Shen, G. (2023) · Environmental Geochemistry and Health · doi:10.1007/s10653-023-01688-4 · Cited by 7
Lian, X., Lu, X., Zhang, Z., Yang, L., Du, J., Cui, Y., Li, H.-J., Zhang, W., Wang, C., Liu, B., et al. (2023) · Journal of Medical Virology · doi:10.1002/jmv.28514 · Cited by 6
Zhang, J., Liu, K., Tang, X., & Wang, X. J. (2024) · Ecotoxicology and Environmental Safety · doi:10.1016/j.ecoenv.2024.116239 · Cited by 6
Environmentally Persistent Free Radicals as Sources of POPs
Vejerano, E. P., Ahn, J., Latif, J., & amun, M. M. (2021) · Advances in Environmental and Engineering Research · doi:10.21926/aeer.2102010 · Cited by 6
Effects of Dust Event Days on Influenza: Evidence from Arid Environments in Lanzhou
Zhang, L., Li, S., Wang, B., Liu, C., He, L., Shan, X., Zhang, K., & Luo, B. (2022) · Aerosol and Air Quality Research · doi:10.4209/aaqr.220282 · Cited by 6
Investigating the Relationship Between Air Quality and COVID-19 Transmission
Albrecht, L., Czarnecki, P., & Sakelaris, B. G. (2021) · Journal of Data Science · doi:10.6339/21-jds1010 · Cited by 7
Household dust as a reservoir for environmentally persistent free radicals: a longitudinal study
Vilcins, D., Dangal, P., Lomnicki, S. M., Cormier, S. A., Lee, W. R., & Sly, P. D. (2025) · International Journal of Environmental Health Research · doi:10.1080/09603123.2025.2495202 · Cited by 7
Self-citationFormation mechanism of environmentally persistent free radicals during soot aging
Liang, D., Liu, J., Bai, F., Tu, K., Wang, L., Wang, Z., He, T., & Zhang, X. (2024) · Atmospheric Environment · doi:10.1016/j.atmosenv.2024.120663 · Cited by 5
Different effects of air pollutant concentrations on influenza A and B in Sichuan, China
Li, Z., Zhou, L., Zhang, Q., Fan, Z., & Xiao, C. (2024) · Ecotoxicology and Environmental Safety · doi:10.1016/j.ecoenv.2024.116923 · Cited by 5
Cawley, G. F., Connick, J. P., Eyer, M. K., & Backes, W. L. (2024) · Drug Metabolism and Disposition · doi:10.1124/dmd.124.001939 · Cited by 6
Wang, H., Chen, Y., Zhang, J., Tang, X., & Wang, X. J. (2018) · Ecotoxicology and Environmental Safety · doi:10.1016/j.ecoenv.2018.11.093 · Cited by 5
Air Pollution Increases Influenza HospitalizationsPreprint
Singer, G., Zivin, J. G., Neidell, M., & Sanders, N. (2020) · medRxiv · doi:10.1101/2020.04.07.20057216 · Cited by 5
Kumar, A., Nde, D. B., Guo, C., Pathak, R., Foley, F., Ahmad, S., Dangal, P., Hasan, F., Lard, M. L., Aryal, A., et al. (2025) · Journal of Toxicology and Environmental Health Part B · doi:10.1080/10937404.2025.2602154 · Cited by 4
Self-citationClay, K. B., Lewis, J., Severnini, E., & Wang, X. (2022) · The Review of Economics and Statistics · doi:10.1162/rest_a_01239 · Cited by 4
PM2.5 constituents and risk of influenza-like illness: A nationwide analysis in 289 Chinese cities
Liu, D., Ma, J., Chen, J., Zhou, Y., Hu, W., Liu, Q., Peng, Z., & Yang, J. (2025) · Journal of Hazardous Materials · doi:10.1016/j.jhazmat.2025.138186 · Cited by 4
Contribution of ambient airborne particles on the susceptibility to respiratory viral infections
Chivé, C., Martίn-Faivre, L., Michoud, V., Baeza‐Squiban, A., & García-Verdugo, I. (2025) · Environmental Toxicology and Pharmacology · doi:10.1016/j.etap.2025.104797 · Cited by 3
Investigating environmentally persistent free radicals (EPFRs) emissions of 3D printing process
Hasan, F., Potter, P. M., Al‐Abed, S. R., Matheson, J. M., & Lomnicki, S. M. (2023) · Chemical Engineering Journal · doi:10.1016/j.cej.2023.148158 · Cited by 4
Cao, H., Xu, R., Liang, Y., Li, Q., Jiang, W., Jin, Y., Wang, W., & Yuan, J. (2024) · PeerJ · doi:10.7717/peerj.17163 · Cited by 3
Pandemic Fatigue: A Global Challenge
Sood, S., & Kalra, M. (2021) · doi:10.54111/0001/ee11 · Cited by 3
Metadata
- Authors
- Lee, G. I., Saravia, J., You, D., Shrestha, B., Jaligama, S., Hebert, V. Y., Dugas, T. R., & Cormier, S. A.
- Affiliations
- University of Tennessee Health Science Center (US)
- Louisiana State University Health Sciences Center Shreveport (US)
- Corresponding author
- Cormier, Stephania A
- Venue
- Particle and Fibre Toxicology
- Published
- 2014-10-30
- Volume
- 11
- Issue
- 1
- Pages
- 57-57
- ISSN
- 1743-8977 (ISSN-L)
- PMC
- PMC4222384
- OpenAlex
- W2102366014
- Cited by
- 119
- References
- 47
- Citations by year
- 2026: 1 · 2025: 7 · 2024: 14 · 2023: 17 · 2022: 16 · 2021: 23 · 2020: 13 · 2019: 8 · 2018: 6 · 2017: 4 · 2016: 5 · 2015: 5
- FWCI
- 3.07
- Type
- journal article
- Language
- en
- Open access
- gold
- doi.org
- Locations
- Particle and Fibre Toxicology (publishedVersion, cc-by)
- PubMed Central (publishedVersion, cc-by)
- PubMed (publishedVersion)
- Civil War Book Review (submittedVersion)
- Funders
- National Institute of Allergy and Infectious Diseases (R01AI090059)
- National Institute of Environmental Health Sciences (P42ES013648, R01ES015050)
- Topics
- Physical Sciences › Environmental Science › Health, Toxicology and Mutagenesis › Air Quality and Health Impacts
- Health Sciences › Medicine › Epidemiology › Influenza Virus Research Studies
- Life Sciences › Immunology and Microbiology › Immunology › Immunotoxicology and immune responses
- Keywords
- environmentally persistent free radicals, particulate matter, influenza, disease severity, neonatal mice, oxidative stress, regulatory T cells, adaptive immune response, manganese superoxide dismutase, air pollution
- MeSH terms
- Superoxide Dismutase 2, Animals, Animals, Newborn, Free Radicals, Glutathione, Humans, Lung, Mice, Inbred C57BL, Mice, Transgenic, Orthomyxoviridae Infections, Superoxide Dismutase, Time Factors, Dinoprost, Oxidative Stress, Risk Assessment, Viral Load, Inhalation Exposure, T-Lymphocytes, Regulatory, Mice, Particulate Matter, Influenza A Virus, H1N1 Subtype, Adaptive Immunity
About these checks
Registry, retraction, Cites and statistics results are computed, not judged, with one exception: a printed reference that no index lists is read once by a model before it counts as a citation error. Claims are extracted by a model and kept only when their quote appears verbatim in the text; each cited source is then checked, with a model’s help, for whether it says what the claim relies on. Those verdicts can be wrong — read the claim’s quote and the cited source before relying on one.
Statistics and arithmetic are recomputed, not judged.
Confidence bands are shown only for fields calibrated on our annotated test set. None is calibrated yet, so no band is shown.
What counts as a claim ›How we measure confidence ›How we check this ›
Are you an author, or do you see a problem with this page? Request a review
