Cited by 25

The DOI matches its Crossref record; 1 of the 1 references it cites were found in a registry or an index.

Matrix metalloproteinase 7 promoted Schwann cell migration and myelination after rat sciatic nerve injury

Wang, Hongkui, Zhang, Ping, Yu, Jun, Zhang, Fuchao, Dai, Wenzhao, Yi, Sheng·2019·Molecular Brain

Abstract

Schwann cells experience de-differentiation, proliferation, migration, re-differentiation and myelination, and participate in the repair and regeneration of injured peripheral nerves. Our previous sequencing analysis suggested that the gene expression level of matrix metalloproteinase 7 (MMP7), a Schwann cell-secreted proteolytic enzyme, was robustly elevated in rat sciatic nerve segments after nerve injury. However, the biological roles of MMP7 are poorly understood. Here, we exposed primary cultured Schwann cells with MMP7 recombinant protein and transfected siRNA against MMP7 into Schwann cells to examine the effect of exogenous and endogenous MMP7. Meanwhile, the effects of MMP7 in nerve regeneration after sciatic nerve crush in vivo were observed. Furthermore, RNA sequencing and bioinformatic analysis of Schwann cells were conducted to show the molecular mechanism behind the phenomenon. In vitro studies showed that MMP7 significantly elevated the migration rate of Schwann cells but did not affect the proliferation rate of Schwann cells. In vivo studies demonstrated that increased level of MMP7 contributed to Schwann cell migration and myelin sheaths formation after peripheral nerve injury. MMP7-mediated genetic changes were revealed by sequencing and bioinformatic analysis. Taken together, our current study demonstrated the promoting effect of MMP7 on Schwann cell migration and peripheral nerve regeneration, benefited the understanding of cellular and molecular mechanisms underlying peripheral nerve injury, and thus might facilitate the treatment of peripheral nerve regeneration in clinic.

Overview

The claims and statistics of this paper haven’t been checked yet.

Run the check — free, no account needed. It reads the open-access text and checks the sources it cites.

A few free checks a day · papers already verified open instantly · results are public

Integrity signals

Registry

Crossref · 10.1186/s13041-019-0516-6

Cites

1 of 1 references verified0 citation errors · 0 not checkable

Statistics

Figures

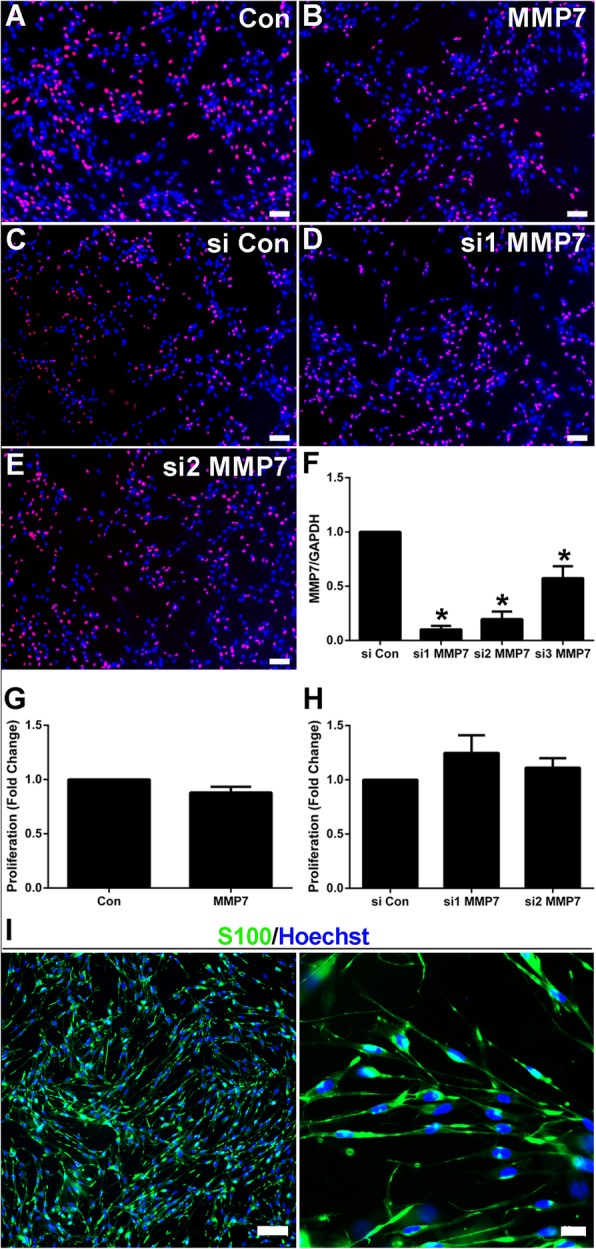
Fig. 1 The in vitro effect of MMP7 on Schwann cell proliferation. a-e Representative cell proliferation images of (a) non-treated Schwann cells (Con), b Schwann cells treated with MMP7 recombinant protein (MMP7), c Schwann cells transfected with siRNA control (si Con), d Schwann cells transfected with MMP7 siRNA1 (si1 MMP7), and (e) Schwann cells transfected with MMP7 siRNA2 (si2 MMP7). Scale bars represented 100 μm. f Relative MMP7 mRNA expression after transfection with siRNA control, MMP7 siRNA1, MMP7 siRNA2, and MMP7 siRNA3. Asterisks indicated significant different from siRNA control, * p-value < 0.05, n = 3. g Summarized proliferation rates of non-treated Schwann cells and Schwann cells treated with MMP7 recombinant protein. n = 3. h Summarized proliferation rates of Schwann cells transfected with siRNA control, MMP7 siRNA1, and MMP7 siRNA2. n = 3. i Schwann cells’ identification by histochemical staining. Specific marker S100 of Schwann cells is green, and Hoechst of nucleus is blue. Scale bars represented 100 μm and 20 μm respectively
Fig. 1 The in vitro effect of MMP7 on Schwann cell proliferation. a-e Representative cell proliferation images of (a) non-treated Schwann cells (Con), b Schwann cells treated with MMP7 recombinant protein (MMP7), c Schwann cells transfected with siRNA control (si Con), d Schwann cells transfected with MMP7 siRNA1 (si1 MMP7), and (e) Schwann cells transfected with MMP7 siRNA2 (si2 MMP7). Scale bars represented 100 μm. f Relative MMP7 mRNA expression after transfection with siRNA control, MMP7 siRNA1, MMP7 siRNA2, and MMP7 siRNA3. Asterisks indicated significant different from siRNA control, * p-value < 0.05, n = 3. g Summarized proliferation rates of non-treated Schwann cells and Schwann cells treated with MMP7 recombinant protein. n = 3. h Summarized proliferation rates of Schwann cells transfected with siRNA control, MMP7 siRNA1, and MMP7 siRNA2. n = 3. i Schwann cells’ identification by histochemical staining. Specific marker S100 of Schwann cells is green, and Hoechst of nucleus is blue. Scale bars represented 100 μm and 20 μm respectivelyCC BY · PubMed Central
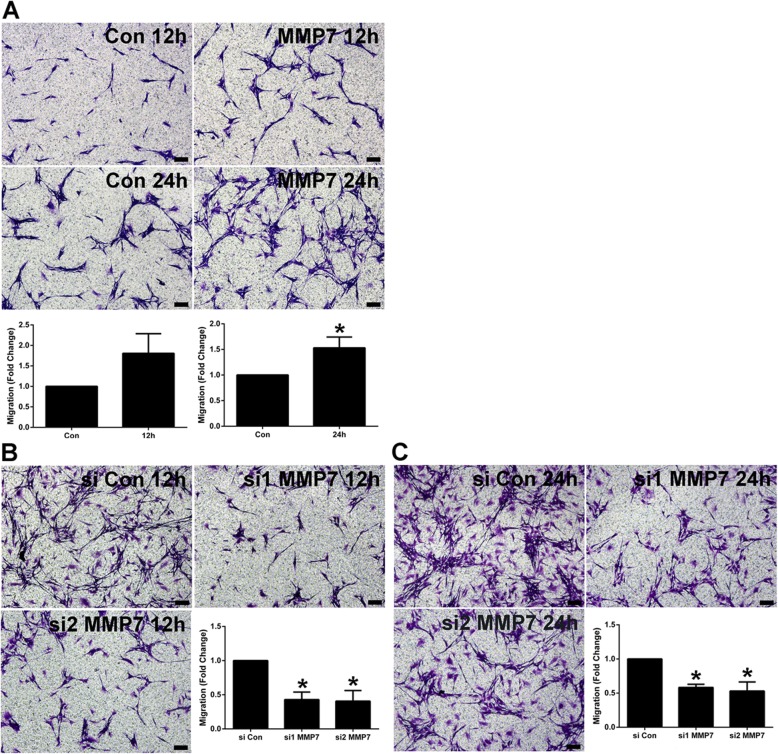
Fig. 2 The in vitro effect of MMP7 on Schwann cell migration. a Representative cell migration images of non-treated Schwann cells (Con) and Schwann cells treated with MMP7 recombinant protein (MMP7) at 12 and 24 h after cell culture. Scale bars represented 100 μm. Histograms showed summarized migration rates of non-treated Schwann cells and Schwann cells treated with MMP7 recombinant protein. The asterisk indicated significant different from non-treated control, * p-value < 0.05, n = 3. b Representative cell migration images of Schwann cells transfected with siRNA control, MMP7 siRNA1, and MMP7 siRNA2 at 12 h after cell culture. Scale bars represented 100 μm. Histograms showed summarized migration rates of Schwann cells transfected with siRNA control, MMP7 siRNA1, and MMP7 siRNA2. Asterisks indicated significant different from siRNA control, * p-value < 0.05, n = 3. c Representative cell migration images of Schwann cells transfected with siRNA control, MMP7 siRNA1, and MMP7 siRNA2 at 24 h after cell culture. Scale bars represented 100 μm. Histograms showed summarized migration rates of Schwann cells transfected with siRNA control, MMP7 siRNA1, and MMP7 siRNA2. Asterisks indicated significant different from siRNA control, * p-value < 0.05, n = 3
Fig. 2 The in vitro effect of MMP7 on Schwann cell migration. a Representative cell migration images of non-treated Schwann cells (Con) and Schwann cells treated with MMP7 recombinant protein (MMP7) at 12 and 24 h after cell culture. Scale bars represented 100 μm. Histograms showed summarized migration rates of non-treated Schwann cells and Schwann cells treated with MMP7 recombinant protein. The asterisk indicated significant different from non-treated control, * p-value < 0.05, n = 3. b Representative cell migration images of Schwann cells transfected with siRNA control, MMP7 siRNA1, and MMP7 siRNA2 at 12 h after cell culture. Scale bars represented 100 μm. Histograms showed summarized migration rates of Schwann cells transfected with siRNA control, MMP7 siRNA1, and MMP7 siRNA2. Asterisks indicated significant different from siRNA control, * p-value < 0.05, n = 3. c Representative cell migration images of Schwann cells transfected with siRNA control, MMP7 siRNA1, and MMP7 siRNA2 at 24 h after cell culture. Scale bars represented 100 μm. Histograms showed summarized migration rates of Schwann cells transfected with siRNA control, MMP7 siRNA1, and MMP7 siRNA2. Asterisks indicated significant different from siRNA control, * p-value < 0.05, n = 3CC BY · PubMed Central
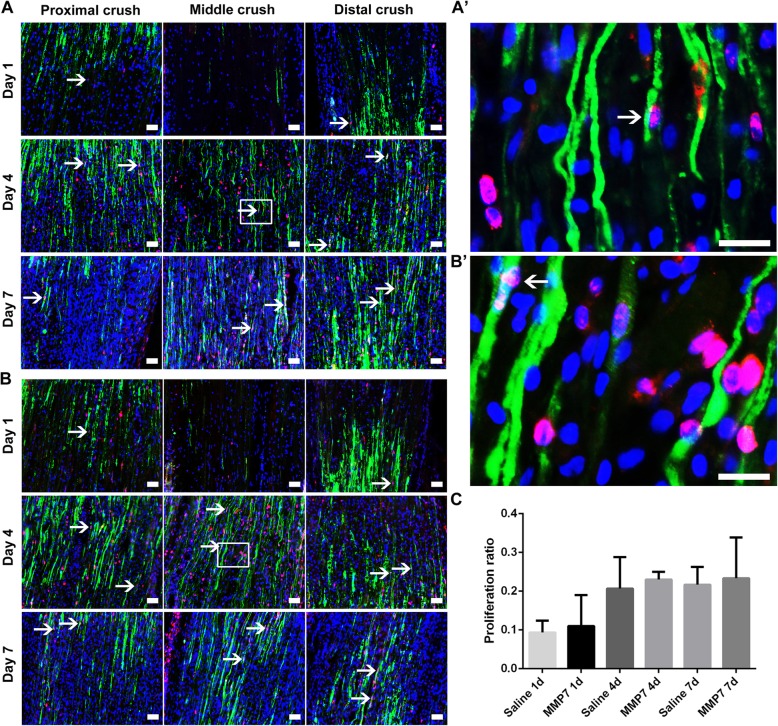
Fig. 3 The in vivo effect of MMP7 on Schwann cell proliferation. A and B Representative immunohistochemistry images of the longitude sections of rat sciatic nerve segments treated with A saline control and B MMP7 recombinant protein. Rat sciatic nerve segments were collected at 1, 7 and 14 days after nerve crush. Green indicated S100 staining of Schwann cells, red indicated Ki67 staining of proliferating cells, and blue indicated Hoechst staining of cell nuclei. Arrows indicated proliferating Schwann cells. Scale bars represented 50 μm. Boxed areas in (A and B) were demonstrated in higher magnifications in (A’ and B′), respectively. Arrows indicated proliferating Schwann cells too. Scale bars represented 20 μm. c Histogram of proliferation ratio in rats injected with saline or MMP7 recombinant protein at 1, 7 and 14 days after nerve crush, n = 3
Fig. 3 The in vivo effect of MMP7 on Schwann cell proliferation. A and B Representative immunohistochemistry images of the longitude sections of rat sciatic nerve segments treated with A saline control and B MMP7 recombinant protein. Rat sciatic nerve segments were collected at 1, 7 and 14 days after nerve crush. Green indicated S100 staining of Schwann cells, red indicated Ki67 staining of proliferating cells, and blue indicated Hoechst staining of cell nuclei. Arrows indicated proliferating Schwann cells. Scale bars represented 50 μm. Boxed areas in (A and B) were demonstrated in higher magnifications in (A’ and B′), respectively. Arrows indicated proliferating Schwann cells too. Scale bars represented 20 μm. c Histogram of proliferation ratio in rats injected with saline or MMP7 recombinant protein at 1, 7 and 14 days after nerve crush, n = 3CC BY · PubMed Central
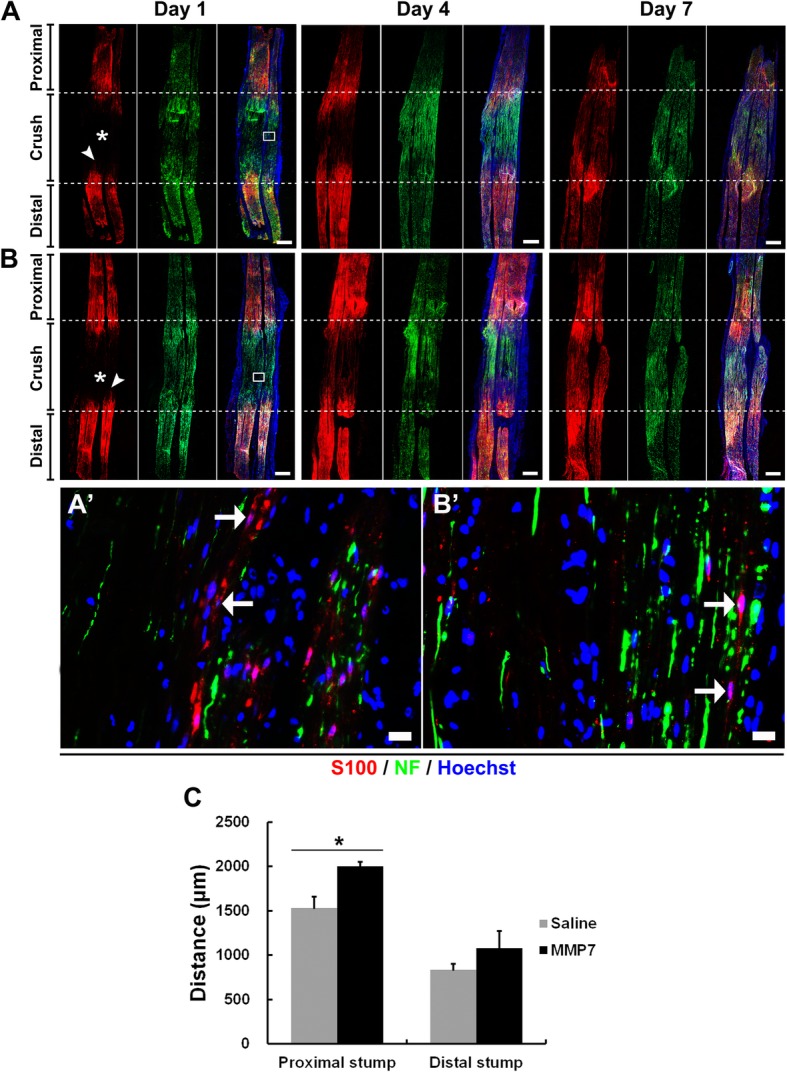
Fig. 4 The in vivo effect of MMP7 on Schwann cell migration. A and B Representative immunohistochemistry images of the longitude sections of rat sciatic nerve segments treated with (A) saline control and (B) MMP7 recombinant protein. Rat sciatic nerve segments were collected at 1, 7 and 14 days after nerve crush. Red indicated S100 staining of Schwann cells, green indicated NF staining of axons, and blue indicated Hoechst staining of cell nuclei. Asterisks indicated migration from the proximal segment. Arrowheads indicated migration from the distal segment. Scale bars represented 500 μm. Boxed areas in (A and B) were shown in higher magnifications in (A’ and B’), respectively. Arrows indicated migrated Schwann cells. Scale bars represented 20 μm. c Summarized migration distances in rats injected with saline or MMP7 recombinant protein. Asterisk indicated significant different from saline control, * p-value < 0.05, n = 3
Fig. 4 The in vivo effect of MMP7 on Schwann cell migration. A and B Representative immunohistochemistry images of the longitude sections of rat sciatic nerve segments treated with (A) saline control and (B) MMP7 recombinant protein. Rat sciatic nerve segments were collected at 1, 7 and 14 days after nerve crush. Red indicated S100 staining of Schwann cells, green indicated NF staining of axons, and blue indicated Hoechst staining of cell nuclei. Asterisks indicated migration from the proximal segment. Arrowheads indicated migration from the distal segment. Scale bars represented 500 μm. Boxed areas in (A and B) were shown in higher magnifications in (A’ and B’), respectively. Arrows indicated migrated Schwann cells. Scale bars represented 20 μm. c Summarized migration distances in rats injected with saline or MMP7 recombinant protein. Asterisk indicated significant different from saline control, * p-value < 0.05, n = 3CC BY · PubMed Central
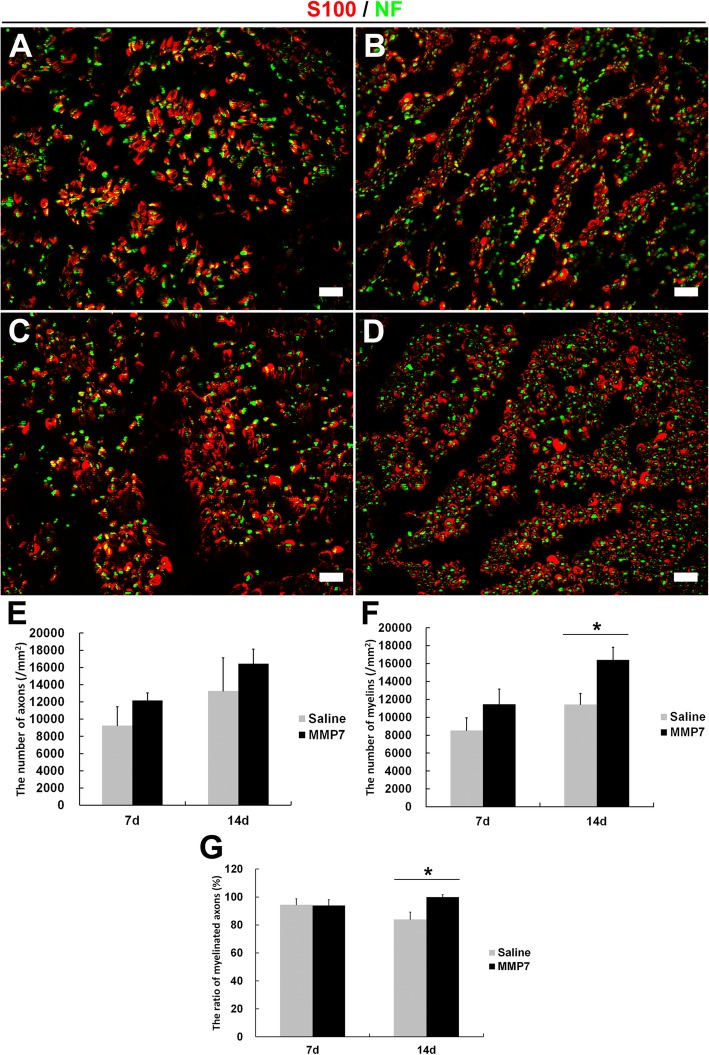
Fig. 5 The in vivo effect of MMP7 on axon and myelin sheath regeneration. a and b Representative immunohistochemistry images of the cross sections of rat sciatic nerve segments (crush sites) treated with saline at (a) 7 days and (b) 14 days after nerve crush. Red indicated S100 staining of Schwann cells and green indicated NF staining of axons. Scale bars represented 20 μm. c and d Representative immunohistochemistry images of rat sciatic nerve segments (crush sites) treated with MMP7 recombinant protein at (c) 7 days and (d) 14 days after nerve crush. Red indicated S100 staining of Schwann cells and green indicated NF staining of axons. Scale bars represented 20 μm. e Summarized numbers of axons in rats injected with saline or MMP7 recombinant protein. f Summarized numbers of myelin sheaths in rats injected with saline or MMP7 recombinant protein. g Summarized ratio of myelinated axons in rats injected with saline or MMP7 recombinant protein. Asterisk indicated significant different from saline control, * p-value < 0.05, n = 3
Fig. 5 The in vivo effect of MMP7 on axon and myelin sheath regeneration. a and b Representative immunohistochemistry images of the cross sections of rat sciatic nerve segments (crush sites) treated with saline at (a) 7 days and (b) 14 days after nerve crush. Red indicated S100 staining of Schwann cells and green indicated NF staining of axons. Scale bars represented 20 μm. c and d Representative immunohistochemistry images of rat sciatic nerve segments (crush sites) treated with MMP7 recombinant protein at (c) 7 days and (d) 14 days after nerve crush. Red indicated S100 staining of Schwann cells and green indicated NF staining of axons. Scale bars represented 20 μm. e Summarized numbers of axons in rats injected with saline or MMP7 recombinant protein. f Summarized numbers of myelin sheaths in rats injected with saline or MMP7 recombinant protein. g Summarized ratio of myelinated axons in rats injected with saline or MMP7 recombinant protein. Asterisk indicated significant different from saline control, * p-value < 0.05, n = 3CC BY · PubMed Central
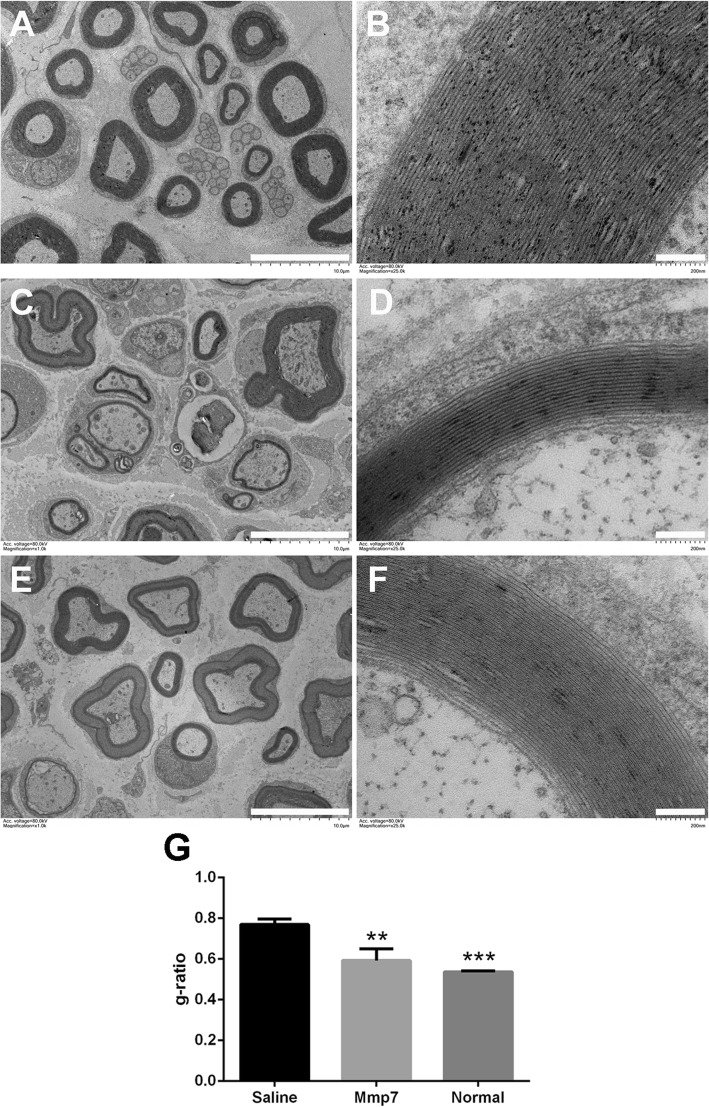
Fig. 6 The in vivo effect of MMP7 on myelin sheath structure. a and b Representative transmission electron microscopy images of myelinated nerve fibers in the normal sciatic nerve. c and d Representative transmission electron microscopy images of myelinated nerve fibers in the sciatic nerve segments of rats treated with saline at 14 days after crush injury. e and f Representative transmission electron microscopy images of myelinated nerve fibers in the sciatic nerve segments of rats treated with MMP7 recombinant protein at 14 days after crush injury. Scale bars in (a, c, and e) represented 10 μm while scale bars in (b, d, and f) represented 200 nm. g Histogram of g-ratio (axon diameter to nerve fiber diameter) in rats injected with saline or MMP7 recombinant protein. Asterisk indicated significant different from saline control, ** p-value < 0.01, *** p-value < 0.001, n = 3
Fig. 6 The in vivo effect of MMP7 on myelin sheath structure. a and b Representative transmission electron microscopy images of myelinated nerve fibers in the normal sciatic nerve. c and d Representative transmission electron microscopy images of myelinated nerve fibers in the sciatic nerve segments of rats treated with saline at 14 days after crush injury. e and f Representative transmission electron microscopy images of myelinated nerve fibers in the sciatic nerve segments of rats treated with MMP7 recombinant protein at 14 days after crush injury. Scale bars in (a, c, and e) represented 10 μm while scale bars in (b, d, and f) represented 200 nm. g Histogram of g-ratio (axon diameter to nerve fiber diameter) in rats injected with saline or MMP7 recombinant protein. Asterisk indicated significant different from saline control, ** p-value < 0.01, *** p-value < 0.001, n = 3CC BY · PubMed Central
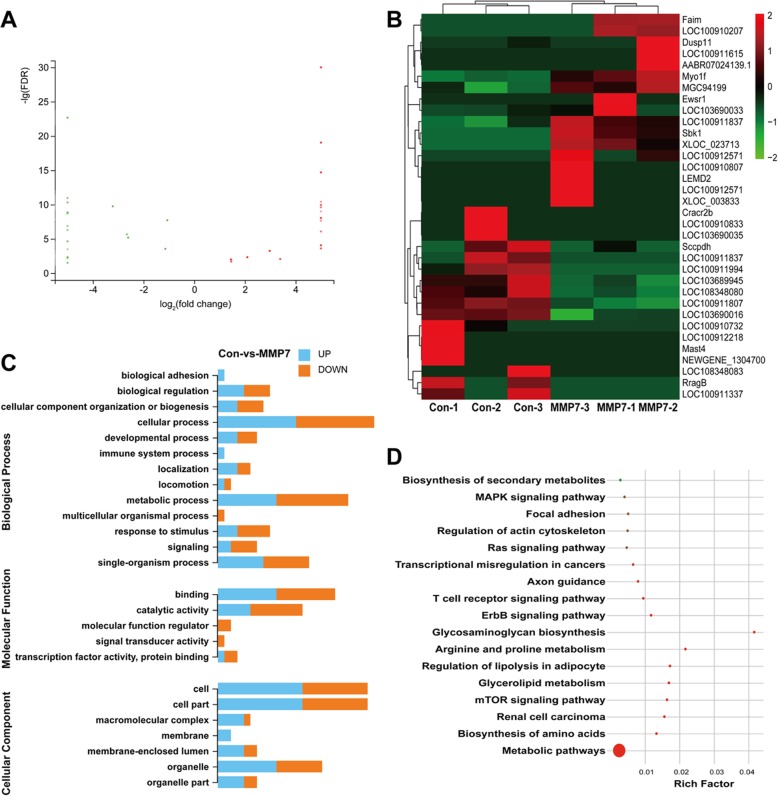
Fig. 7 MMP7 mediated gene expression changes. a Scatter plot of differentially expressed genes in MMP7-treated Schwann cells. Red color indicated up-regulation while green color indicated down-regulation. b Heatmap of the expression levels of these differentially expressed genes. Red color indicated high expression level while green color indicated low expression level. c GO biological process, molecular function, and cellular component terms of differentially expressed genes. The length of bar graph was correlated with the numbers of differentially expressed genes. d KEGG pathways of differentially expressed genes. The size of the circle was correlated with the numbers of differentially expressed genes. The color of the circle was correlated with q-value (red color indicated low q-value)
Fig. 7 MMP7 mediated gene expression changes. a Scatter plot of differentially expressed genes in MMP7-treated Schwann cells. Red color indicated up-regulation while green color indicated down-regulation. b Heatmap of the expression levels of these differentially expressed genes. Red color indicated high expression level while green color indicated low expression level. c GO biological process, molecular function, and cellular component terms of differentially expressed genes. The length of bar graph was correlated with the numbers of differentially expressed genes. d KEGG pathways of differentially expressed genes. The size of the circle was correlated with the numbers of differentially expressed genes. The color of the circle was correlated with q-value (red color indicated low q-value)CC BY · PubMed Central

Verification

Claims the paper makes

The claims and statistics of this paper haven’t been checked yet.

Run the check — free, no account needed. It reads the open-access text and checks the sources it cites.

A few free checks a day · papers already verified open instantly · results are public

Claims other papers make about this one

Each is checked against this paper’s own text: does it say what the citing paper says it does?

Self-check

Percentages, sums and reported differences re-computed from the paper’s own numbers.

The self-check needs the paper’s full text.

Citations

Cites

Research works printed but not linked: 32

  1. Gu X, Ding F, Yang Y, Liu J. Construction of tissue engineered nerve grafts and their application in peripheral nerve regeneration. Prog Neurobiol. 2011;93(2):204–30. https://doi.org/10.1016/j.pneurobio.2010.11.002. · DOI
  2. Li R, Liu Z, Pan Y, Chen L, Zhang Z, Lu L. Peripheral nerve injuries treatment: a systematic review. Cell Biochem Biophys. 2014;68(3):449–54. https://doi.org/10.1007/s12013-013-9742-1. · DOI
  3. Yi S, Xu L, Gu X. Scaffolds for peripheral nerve repair and reconstruction. Exp Neurol. 2018. https://doi.org/10.1016/j.expneurol.2018.05.016. · DOI
  4. Lee SK, Wolfe SW. Peripheral nerve injury and repair. J Am Acad Orthop Surg. 2000;8(4):243–52. · DOI · Paper page
  5. Wong KM, Babetto E, Beirowski B. Axon degeneration: make the Schwann cell great again. Neural Regen Res. 2017;12(4):518–24. https://doi.org/10.4103/1673-5374.205000. · DOI
  6. Chen ZL, Yu WM, Strickland S. Peripheral regeneration. Annu Rev Neurosci. 2007;30:209–33. https://doi.org/10.1146/annurev.neuro.30.051606.094337. · DOI
  7. Dubovy P. Schwann cells and endoneurial extracellular matrix molecules as potential cues for sorting of regenerated axons: a review. Anat Sci Int. 2004;79(4):198–208. https://doi.org/10.1111/j.1447-073x.2004.00090.x. · DOI
  8. Hill R. Extracellular matrix remodelling in human diabetic neuropathy. J Anat. 2009;214(2):219–25. https://doi.org/10.1111/j.1469-7580.2008.01026.x. · DOI
  9. Lamarca A, Gella A, Martianez T, Segura M, Figueiro-Silva J, Grijota-Martinez C, Trullas R, Casals N. Uridine 5′-triphosphate promotes in vitro Schwannoma cell migration through matrix metalloproteinase-2 activation. PLoS One. 2014;9(6):e98998. https://doi.org/10.1371/journal.pone.0098998. · DOI
  10. Page-McCaw A, Ewald AJ, Werb Z. Matrix metalloproteinases and the regulation of tissue remodelling. Nat Rev Mol Cell Biol. 2007;8(3):221–33. https://doi.org/10.1038/nrm2125. · DOI · Paper page
  11. Verma RP, Hansch C. Matrix metalloproteinases (MMPs): chemical-biological functions and (Q)SARs. Bioorg Med Chem. 2007;15(6):2223–68. https://doi.org/10.1016/j.bmc.2007.01.011. · DOI
  12. Nagase H, Visse R, Murphy G. Structure and function of matrix metalloproteinases and TIMPs. Cardiovasc Res. 2006;69(3):562–73. https://doi.org/10.1016/j.cardiores.2005.12.002. · DOI
  13. Sternlicht MD, Werb Z. How matrix metalloproteinases regulate cell behavior. Annu Rev Cell Dev Biol. 2001;17:463–516. https://doi.org/10.1146/annurev.cellbio.17.1.463. · DOI · Paper page
  14. Krekoski CA, Neubauer D, Graham JB, Muir D. Metalloproteinase-dependent predegeneration in vitro enhances axonal regeneration within acellular peripheral nerve grafts. J Neurosci. 2002;22(23):10408–15. · DOI
  15. Remacle AG, Hullugundi SK, Dolkas J, Angert M, Chernov AV, Strongin AY, Shubayev VI. Acute- and late-phase matrix metalloproteinase (MMP)-9 activity is comparable in female and male rats after peripheral nerve injury. J Neuroinflammation. 2018;15(1):89. https://doi.org/10.1186/s12974-018-1123-7. · DOI
  16. La Fleur M, Underwood JL, Rappolee DA, Werb Z. Basement membrane and repair of injury to peripheral nerve: defining a potential role for macrophages, matrix metalloproteinases, and tissue inhibitor of metalloproteinases-1. J Exp Med. 1996;184(6):2311–26. · DOI
  17. Ferguson TA, Muir D. MMP-2 and MMP-9 increase the neurite-promoting potential of schwann cell basal laminae and are upregulated in degenerated nerve. Mol Cell Neurosci. 2000;16(2):157–67. https://doi.org/10.1006/mcne.2000.0859. · DOI
  18. Kobayashi H, Chattopadhyay S, Kato K, Dolkas J, Kikuchi S, Myers RR, Shubayev VI. MMPs initiate Schwann cell-mediated MBP degradation and mechanical nociception after nerve damage. Mol Cell Neurosci. 2008;39(4):619–27. https://doi.org/10.1016/j.mcn.2008.08.008. · DOI
  19. Mantuano E, Inoue G, Li X, Takahashi K, Gaultier A, Gonias SL, Campana WM. The hemopexin domain of matrix metalloproteinase-9 activates cell signaling and promotes migration of schwann cells by binding to low-density lipoprotein receptor-related protein. J Neurosci. 2008;28(45):11571–82. https://doi.org/10.1523/JNEUROSCI.3053-08.2008. · DOI
  20. Qin J, Zha GB, Yu J, Zhang HH, Yi S. Differential temporal expression of matrix metalloproteinases following sciatic nerve crush. Neural Regen Res. 2016;11(7):1165–71. https://doi.org/10.4103/1673-5374.187059. · DOI · Paper page
  21. Yi S, Yuan Y, Chen Q, Wang X, Gong L, Liu J, Gu X, Li S. Regulation of Schwann cell proliferation and migration by miR-1 targeting brain-derived neurotrophic factor after peripheral nerve injury. Sci Rep. 2016;6:29121. https://doi.org/10.1038/srep29121. · DOI
  22. Kim D, Pertea G, Trapnell C, Pimentel H, Kelley R, Salzberg SL. TopHat2: accurate alignment of transcriptomes in the presence of insertions, deletions and gene fusions. Genome Biol. 2013;14(4):R36. https://doi.org/10.1186/gb-2013-14-4-r36. · DOI · Paper page
  23. Li B, Dewey CN. RSEM: accurate transcript quantification from RNA-Seq data with or without a reference genome. BMC Bioinformatics. 2011;12:323. https://doi.org/10.1186/1471-2105-12-323. · DOI · Paper page
  24. Yong VW. Metalloproteinases: mediators of pathology and regeneration in the CNS. Nat Rev Neurosci. 2005;6(12):931–44. https://doi.org/10.1038/nrn1807. · DOI · Paper page
  25. Yong VW, Power C, Forsyth P, Edwards DR. Metalloproteinases in biology and pathology of the nervous system. Nat Rev Neurosci. 2001;2(7):502–11. https://doi.org/10.1038/35081571. · DOI
  26. Nishihara T, Remacle AG, Angert M, Shubayev I, Shiryaev SA, Liu H, Dolkas J, Chernov AV, Strongin AY, Shubayev VI. Matrix metalloproteinase-14 both sheds cell surface neuronal glial antigen 2 (NG2) proteoglycan on macrophages and governs the response to peripheral nerve injury. J Biol Chem. 2015;290(6):3693–707. https://doi.org/10.1074/jbc.M114.603431. · DOI
  27. Hsu JY, McKeon R, Goussev S, Werb Z, Lee JU, Trivedi A, Noble-Haeusslein LJ. Matrix metalloproteinase-2 facilitates wound healing events that promote functional recovery after spinal cord injury. J Neurosci. 2006;26(39):9841–50. https://doi.org/10.1523/JNEUROSCI.1993-06.2006. · DOI
  28. Shubayev VI, Myers RR. Matrix metalloproteinase-9 promotes nerve growth factor-induced neurite elongation but not new sprout formation in vitro. J Neurosci Res. 2004;77(2):229–39. https://doi.org/10.1002/jnr.20160. · DOI
  29. Larsen PH, Wells JE, Stallcup WB, Opdenakker G, Yong VW. Matrix metalloproteinase-9 facilitates remyelination in part by processing the inhibitory NG2 proteoglycan. J Neurosci. 2003;23(35):11127–35. · DOI
  30. Liu H, Kim Y, Chattopadhyay S, Shubayev I, Dolkas J, Shubayev VI. Matrix metalloproteinase inhibition enhances the rate of nerve regeneration in vivo by promoting dedifferentiation and mitosis of supporting schwann cells. J Neuropathol Exp Neurol. 2010;69(4):386–95. https://doi.org/10.1097/NEN.0b013e3181d68d12. · DOI
  31. Spinale FG. Myocardial matrix remodeling and the matrix metalloproteinases: influence on cardiac form and function. Physiol Rev. 2007;87(4):1285–342. https://doi.org/10.1152/physrev.00012.2007. · DOI
  32. Kessenbrock K, Plaks V, Werb Z. Matrix metalloproteinases: regulators of the tumor microenvironment. Cell. 2010;141(1):52–67. https://doi.org/10.1016/j.cell.2010.03.015. · DOI · Paper page

Cited by

Sorted by citations

See all 25

Metadata

Authors
Wang, H., Zhang, P., Yu, J., Zhang, F., Dai, W., & Yi, S.
Venue
Molecular Brain
Published
2019-12
Volume
12
Issue
1
ISSN
1756-6606
Cited by
25
References
1
Language
en
Funders
National Natural Science Foundation of China (31700926)

About these checks

Registry, retraction, Cites and statistics results are computed, not judged, with one exception: a printed reference that no index lists is read once by a model before it counts as a citation error. Claims are extracted by a model and kept only when their quote appears verbatim in the text; each cited source is then checked, with a model’s help, for whether it says what the claim relies on. Those verdicts can be wrong — read the claim’s quote and the cited source before relying on one.

Statistics and arithmetic are recomputed, not judged.

Confidence bands are shown only for fields calibrated on our annotated test set. None is calibrated yet, so no band is shown.

What counts as a claim ›How we measure confidence ›How we check this ›

Are you an author, or do you see a problem with this page? Request a review