

The DOI matches its Crossref record; 32 of the 32 references it cites were found in a registry or an index.
Schmutzi: estimation of contamination and endogenous mitochondrial consensus calling for ancient DNA
Open accessAbstract
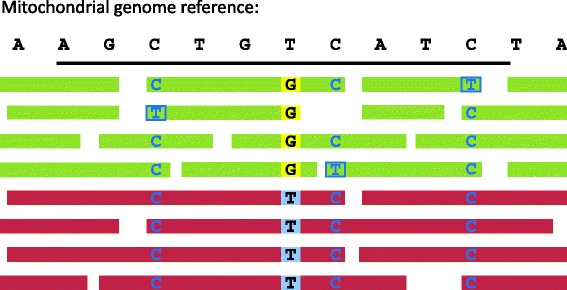
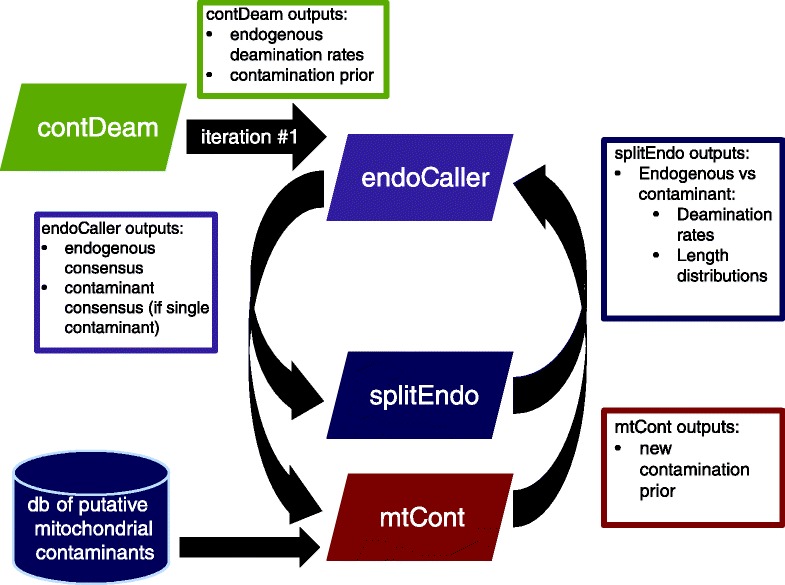
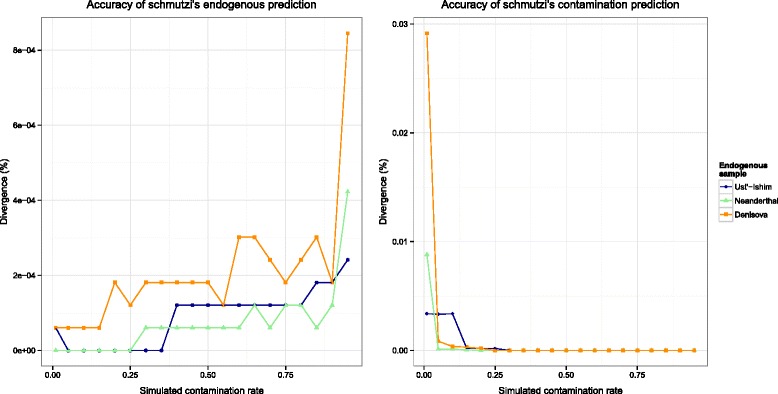
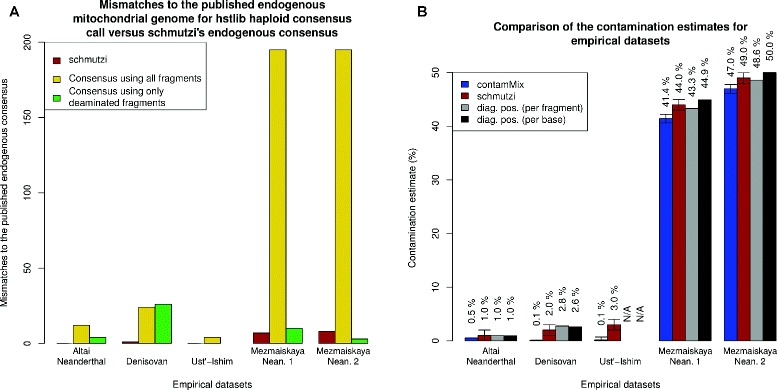
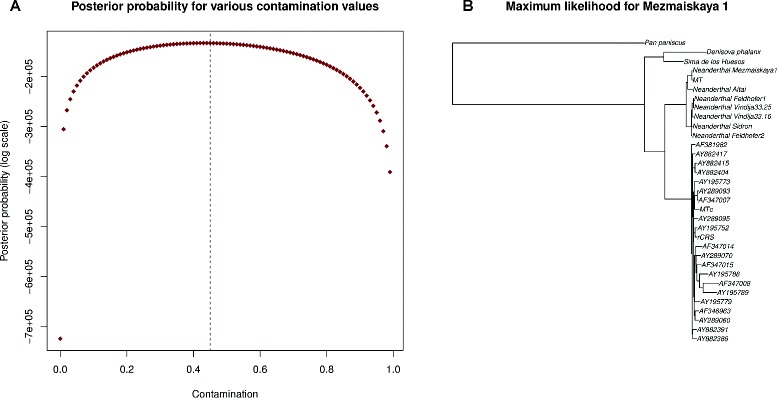
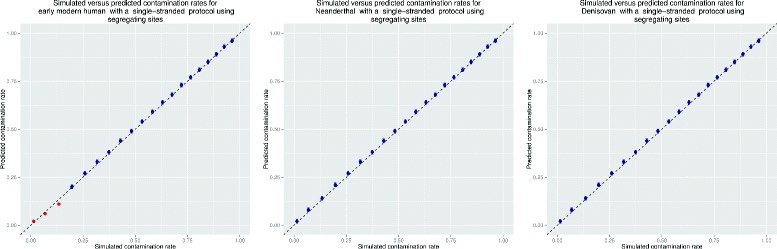
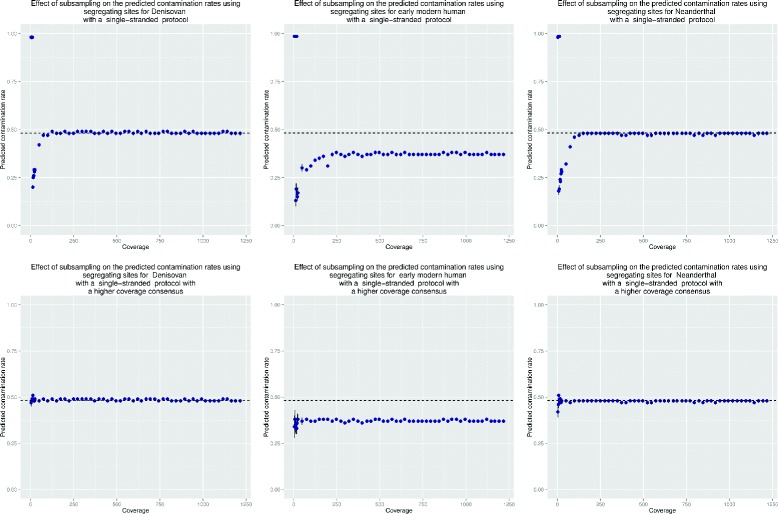
UNLABELLED: Ancient DNA is typically highly degraded with appreciable cytosine deamination, and contamination with present-day DNA often complicates the identification of endogenous molecules. Together, these factors impede accurate assembly of the endogenous ancient mitochondrial genome. We present schmutzi, an iterative approach to jointly estimate present-day human contamination in ancient human DNA datasets and reconstruct the endogenous mitochondrial genome. By using sequence deamination patterns and fragment length distributions, schmutzi accurately reconstructs the endogenous mitochondrial genome sequence even when contamination exceeds 50 %. Given sufficient coverage, schmutzi also produces reliable estimates of contamination across a range of contamination rates. AVAILABILITY: https://bioinf.eva.mpg.de/schmutzi/ license:GPLv3.
Overview
The claims and statistics of this paper haven’t been checked yet.
Run the check — free, no account needed. It reads the open-access text and checks the sources it cites.
Integrity signals
Registry
Cites
Statistics
Figures
Verification
Claims the paper makes
The claims and statistics of this paper haven’t been checked yet.
Run the check — free, no account needed. It reads the open-access text and checks the sources it cites.
Claims other papers make about this one
Each is checked against this paper’s own text: does it say what the citing paper says it does?
The cited source says what the claim attributes to it.
In the citing paper
“Here, we provide the first reliable data set obtained from ancient Egyptians using high-throughput DNA sequencing methods and assessing the authenticity of the retrieved ancient DNA via characteristic nucleotide misincorporation patterns1314 and statistical contamination tests15 to ensure the ancient origin of our obtained data.”
From Ancient Egyptian mummy genomes suggest an increase of Sub-Saharan African ancestry in post-Roman periods (2017) · cites this paper as [15]
The cited source says what the claim attributes to it.
In the citing paper
“However, multiple tools exist for assessing contamination levels in haploid chromosomes, both from mitochondrial DNA data (for example schmutzi 189 ) and using the X-chromosome in males (for example ANGSD 190,191 ).”
From Ancient DNA analysis (2021) · cites this paper as [189]
The cited source says what the claim attributes to it.
In the citing paper
“For highly degraded or contaminated material, analyses may be conditioned on reads showing evidence of post-mortem DNA damage 55,189,192 and/or limited to transversions 7 so as to mitigate both rampant contamination and damage-related nucleotide misincorporation.”
From Ancient DNA analysis (2021) · cites this paper as [189]
In the citing paper
“(iii) We measured human mitochondrial DNA contamination using schmutzi (40).”
From Ancient DNA sheds light on the genetic origins of early Iron Age Philistines (2019) · cites this paper as [40]
Self-check
Percentages, sums and reported differences re-computed from the paper’s own numbers.
The self-check needs the paper’s full text.
Citations
Cites
ANGSD: Analysis of Next Generation Sequencing Data
Korneliussen, T. S., Albrechtsen, A., & Nielsen, R. (2014) · BMC Bioinformatics · doi:10.1186/s12859-014-0356-4 · Cited by 2,982
The complete genome sequence of a Neanderthal from the Altai Mountains
Prüfer, K., Racimo, F., Patterson, N., Jay, F., Sankararaman, S., Sawyer, S., Heinze, A., Renaud, G., Sudmant, P. H., de Filippo, C., et al. (2014) · Nature · doi:10.1038/nature12886 · Cited by 2,254
Self-citationA high-coverage genome sequence from an archaic denisovan individual
Meyer, M., Kircher, M., Gansauge, M.-T., Li, H., Racimo, F., Mallick, S., Schraiber, J. G., Jay, F., Prüfer, K., de Filippo, C., et al. (2012) · Science · doi:10.1126/science.1224344 · Cited by 1,967
Self-citationUpdated comprehensive phylogenetic tree of global human mitochondrial DNA variation
van Oven, M., & Kayser, M. (2009) · Human Mutation · doi:10.1002/humu.20921 · Cited by 1,810
mapDamage2.0: fast approximate Bayesian estimates of ancient DNA damage parameters
Jónsson, H., Ginolhac, A., Schubert, M., Johnson, P. L. F., & Orlando, L. (2013) · Bioinformatics · doi:10.1093/bioinformatics/btt193 · Cited by 1,669
Ancient human genomes suggest three ancestral populations for present-day Europeans
Lazaridis, I., Patterson, N., Mittnik, A., Renaud, G., Mallick, S., Kirsanow, K., Sudmant, P. H., Schraiber, J. G., Castellano, S., Lipson, M., et al. (2014) · Nature · doi:10.1038/nature13673 · Cited by 1,357
Self-citationGenome sequence of a 45,000-year-old modern human from western Siberia
Fu, Q., Li, H., Moorjani, P., Jay, F., Slepchenko, S. M., Bondarev, A. A., Johnson, P. L. F., Aximu-Petri, A., Prüfer, K., de Filippo, C., et al. (2014) · Nature · doi:10.1038/nature13810 · Cited by 1,023
Self-citationPatterns of damage in genomic DNA sequences from a neandertal
Briggs, A. W., Stenzel, U., Johnson, P. L. F., Green, R. E., Kelso, J., Prüfer, K., Meyer, M., Krause, J., Ronan, M. T., Lachmann, M., et al. (2007) · Proceedings of the National Academy of Sciences · doi:10.1073/pnas.0704665104 · Cited by 981
Self-citationThe complete mitochondrial DNA genome of an unknown hominin from southern Siberia
Krause, J., Fu, Q., Good, J. M., Viola, B., Shunkov, M. V., Derevianko, A. P., & Pääbo, S. (2010) · Nature · doi:10.1038/nature08976 · Cited by 818
Analysis of one million base pairs of Neanderthal DNA
Green, R. E., Krause, J., Ptak, S. E., Briggs, A. W., Ronan, M. T., Simons, J. F., Du, L., Egholm, M., Rothberg, J. M., Paunović, M., et al. (2006) · Nature · doi:10.1038/nature05336 · Cited by 758
Cited by
Sorted by citations
EAGER: efficient ancient genome reconstruction
Peltzer, A., Jäger, G., Herbig, A., Seitz, A., Kniep, C., Krause, J., & Nieselt, K. (2016) · Genome Biology · doi:10.1186/s13059-016-0918-z · Cited by 509
Tett, A., Huang, K. D., Asnicar, F., Fehlner-Peach, H., Pasolli, E., Karcher, N., Armanini, F., Manghi, P., Bonham, K., Zolfo, M., et al. (2019) · Cell Host & Microbe · doi:10.1016/j.chom.2019.08.018 · Cited by 476
The population history of northeastern Siberia since the Pleistocene
Sikora, M., Pitulko, V. V., Sousa, V. C., Allentoft, M. E., Vinner, L., Rasmussen, S., Margaryan, A., de Barros Damgaard, P., de la Fuente, C., Renaud, G., et al. (2019) · Nature · doi:10.1038/s41586-019-1279-z · Cited by 389
Self-citationReconstructing Prehistoric African Population Structure
Skoglund, P., Thompson, J. C., Prendergast, M. E., Mittnik, A., Sirak, K. A., Hajdinjak, M., Salie, T., Rohland, N., Mallick, S., Peltzer, A., et al. (2017) · Cell · doi:10.1016/j.cell.2017.08.049 · Cited by 422
Single-cell analysis uncovers convergence of cell identities during axolotl limb regeneration
Gerber, T., Murawala, P., Knapp, D., Masselink, W., Schuez, M., Hermann, S., Gac-Santel, M., Nowoshilow, S., Kageyama, J., Khattak, S., et al. (2018) · Science · doi:10.1126/science.aaq0681 · Cited by 415
Metadata
- Authors
- Renaud, G., Slon, V., Duggan, A. T., & Kelso, J.
- Affiliations
- Max Planck Institute for Evolutionary Anthropology (DE)
- McMaster University (CA)
- Corresponding author
- Renaud, Gabriel
- Venue
- Genome Biology
- Published
- 2015-10-12
- Volume
- 16
- Issue
- 1
- Pages
- 224-224
- ISSN
- 1465-6906 (ISSN-L)
- 1474-760X
- PMC
- PMC4601135
- OpenAlex
- W2099595226
- Cited by
- 509
- References
- 32
- Citations by year
- 2026: 63 · 2025: 78 · 2024: 57 · 2023: 60 · 2022: 40 · 2021: 60 · 2020: 60 · 2019: 34 · 2018: 28 · 2017: 19 · 2016: 10
- FWCI
- 12.98
- Type
- journal article
- Language
- en
- Open access
- gold
- doi.org
- Licence
- Locations
- Genome biology (publishedVersion, cc-by)
- Europe PMC (PubMed Central) (publishedVersion, cc-by)
- PubMed Central (publishedVersion, cc-by)
- PubMed (publishedVersion)
- MPG.PuRe (Max Planck Society) (submittedVersion, cc-by)
- Max Planck Digital Library (submittedVersion, other-oa)
- Funders
- Canadian Network for Research and Innovation in Machining Technology, Natural Sciences and Engineering Research Council of Canada (PGSD2-438066-2013)
- Topics
- Life Sciences › Biochemistry, Genetics and Molecular Biology › Genetics › Forensic and Genetic Research
- Life Sciences › Biochemistry, Genetics and Molecular Biology › Molecular Biology › Genomics and Phylogenetic Studies
- Life Sciences › Biochemistry, Genetics and Molecular Biology › Genetics › Genetic diversity and population structure
- Keywords
- ancient DNA, contamination estimation, cytosine deamination, endogenous DNA, fragment size distribution
- MeSH terms
- Animals, Base Sequence, DNA, Mitochondrial, Humans, Software, Consensus Sequence, Sequence Analysis, DNA, Genome, Mitochondrial, DNA Contamination, Neanderthals
About these checks
Registry, retraction, Cites and statistics results are computed, not judged, with one exception: a printed reference that no index lists is read once by a model before it counts as a citation error. Claims are extracted by a model and kept only when their quote appears verbatim in the text; each cited source is then checked, with a model’s help, for whether it says what the claim relies on. Those verdicts can be wrong — read the claim’s quote and the cited source before relying on one.
Statistics and arithmetic are recomputed, not judged.
Confidence bands are shown only for fields calibrated on our annotated test set. None is calibrated yet, so no band is shown.
What counts as a claim ›How we measure confidence ›How we check this ›
Are you an author, or do you see a problem with this page? Request a review
