

The DOI matches its Crossref record; 94 of the 95 references it cites were found in a registry or an index.
Genomic legacy of the African cheetah, Acinonyx jubatus
Open accessAbstract
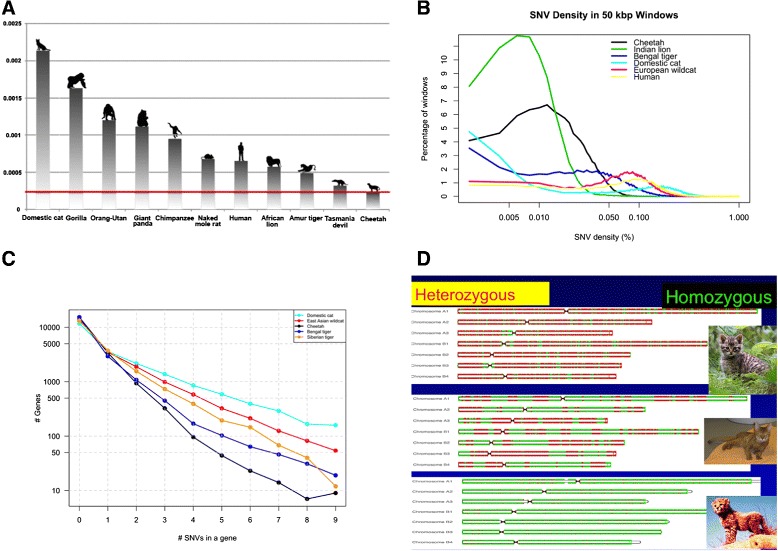
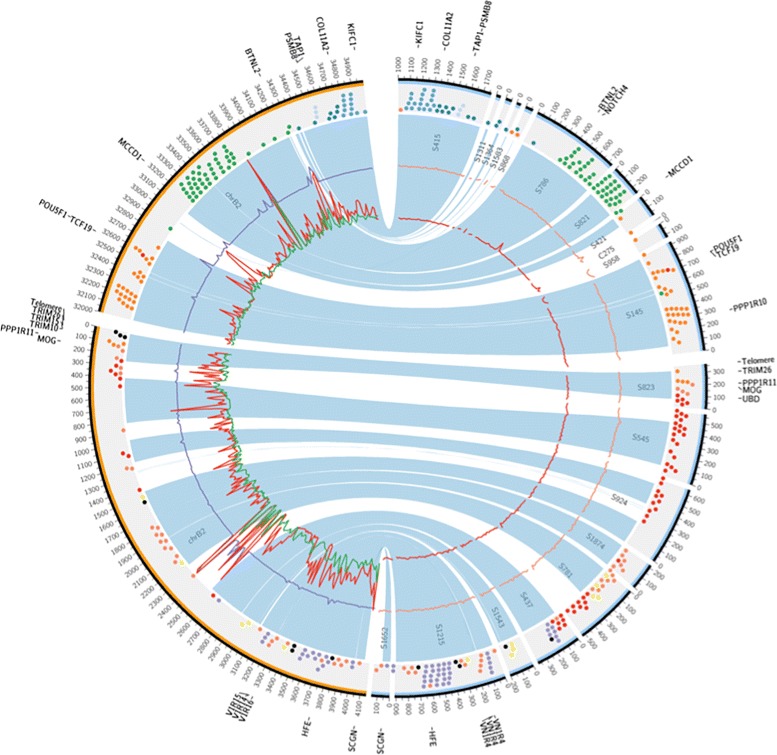
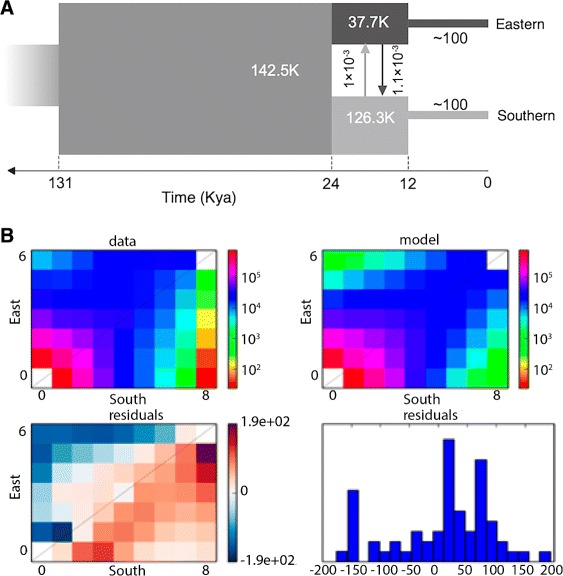
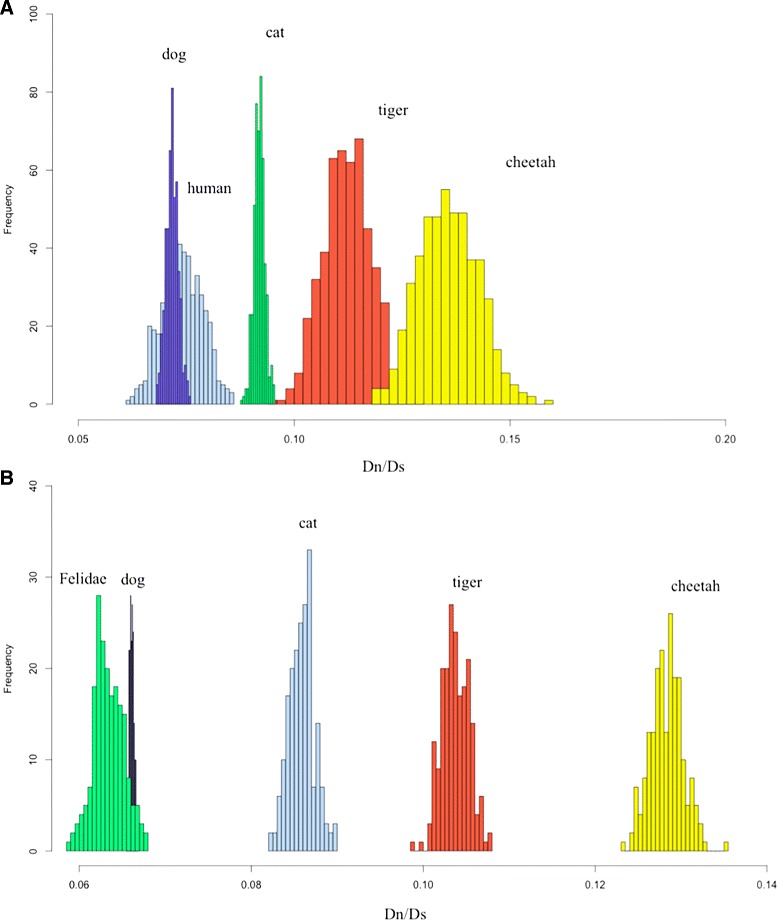
BACKGROUND: Patterns of genetic and genomic variance are informative in inferring population history for human, model species and endangered populations. RESULTS: Here the genome sequence of wild-born African cheetahs reveals extreme genomic depletion in SNV incidence, SNV density, SNVs of coding genes, MHC class I and II genes, and mitochondrial DNA SNVs. Cheetah genomes are on average 95 % homozygous compared to the genomes of the outbred domestic cat (24.08 % homozygous), Virunga Mountain Gorilla (78.12 %), inbred Abyssinian cat (62.63 %), Tasmanian devil, domestic dog and other mammalian species. Demographic estimators impute two ancestral population bottlenecks: one >100,000 years ago coincident with cheetah migrations out of the Americas and into Eurasia and Africa, and a second 11,084-12,589 years ago in Africa coincident with late Pleistocene large mammal extinctions. MHC class I gene loss and dramatic reduction in functional diversity of MHC genes would explain why cheetahs ablate skin graft rejection among unrelated individuals. Significant excess of non-synonymous mutations in AKAP4 (p<0.02), a gene mediating spermatozoon development, indicates cheetah fixation of five function-damaging amino acid variants distinct from AKAP4 homologues of other Felidae or mammals; AKAP4 dysfunction may cause the cheetah's extremely high (>80 %) pleiomorphic sperm. CONCLUSIONS: The study provides an unprecedented genomic perspective for the rare cheetah, with potential relevance to the species' natural history, physiological adaptations and unique reproductive disposition.
Overview
The claims and statistics of this paper haven’t been checked yet.
Run the check — free, no account needed. It reads the open-access text and checks the sources it cites.
Integrity signals
Registry
Cites
Statistics
Figures
Verification
Claims the paper makes
The claims and statistics of this paper haven’t been checked yet.
Run the check — free, no account needed. It reads the open-access text and checks the sources it cites.
Claims other papers make about this one
Each is checked against this paper’s own text: does it say what the citing paper says it does?
The source backs part of the claim, not all of it — or backs it for a different population, condition or comparison.
In the citing paper
“Muskox genetic diversity is lower than two mammalian species under threat that have undergo recent genetic bottlenecks, the Tasmanian devil (Sarcophilus harrisii)66 and the cheetah (Acinonyx jubatus)67.”
From Chromosomal-level reference genome assembly of muskox (Ovibos moschatus) from Banks Island in the Canadian Arctic, a resource for conservation genomics (2024) · cites this paper as [67]
Experimental — accuracy not yet measuredThe source backs part of the claim, not all of it — or backs it for a different population, condition or comparison.
In the citing paper
“Progressive Cactus has been developed over several years, and has already been successfully used as an integral component of high-profile comparative genomics projects16–20.”
From Progressive Cactus is a multiple-genome aligner for the thousand-genome era (2020) · cites this paper as [17]
Experimental — accuracy not yet measured
Self-check
Percentages, sums and reported differences re-computed from the paper’s own numbers.
The self-check needs the paper’s full text.
Citations
Cites
Gapped BLAST and PSI-BLAST: a new generation of protein database search programs
Altschul, S. (1997) · Nucleic Acids Research · doi:10.1093/nar/25.17.3389 · Cited by 73,302
The Sequence Alignment/Map format and SAMtools
Li, H., Handsaker, B., Wysoker, A., Fennell, T., Ruan, J., Homer, N., Marth, G., Abecasis, G., Durbin, R., & 1000 Genome Project Data Processing Subgroup (2009) · Bioinformatics · doi:10.1093/bioinformatics/btp352 · Cited by 62,041
Fast and accurate short read alignment with Burrows-Wheeler transform
Li, H., & Durbin, R. (2009) · Bioinformatics · doi:10.1093/bioinformatics/btp324 · Cited by 58,607
MAFFT Multiple Sequence Alignment Software Version 7: Improvements in Performance and Usability
Katoh, K., & Standley, D. M. (2013) · Molecular Biology and Evolution · doi:10.1093/molbev/mst010 · Cited by 46,209
MUSCLE: multiple sequence alignment with high accuracy and high throughput
Edgar, R. C. (2004) · Nucleic Acids Research · doi:10.1093/nar/gkh340 · Cited by 44,662
BEDTools: a flexible suite of utilities for comparing genomic features
Quinlan, A. R., & Hall, I. M. (2010) · Bioinformatics · doi:10.1093/bioinformatics/btq033 · Cited by 27,437
The variant call format and VCFtools
Danecek, P., Auton, A., Abecasis, G. R., Albers, C. A., Banks, E., DePristo, M. A., Handsaker, R. E., Lunter, G. A., Marth, G., Sherry, S. T., et al. (2011) · Bioinformatics · doi:10.1093/bioinformatics/btr330 · Cited by 16,450
PAML 4: Phylogenetic Analysis by Maximum Likelihood
Yang, Z. (2007) · Molecular Biology and Evolution · doi:10.1093/molbev/msm088 · Cited by 13,879
A method and server for predicting damaging missense mutations.
Adzhubei, I. A., Schmidt, S., Peshkin, L., Ramensky, V. E., Gerasimova, A., Bork, P., Kondrashov, A. S., & Sunyaev, S. R. (2010) · Nature Methods · doi:10.1038/nmeth0410-248 · Cited by 13,194
Cingolani, P., Platts, A., Wang, L. L., Coon, M., Nguyen, T., Wang, L., Land, S. J., Lu, X., & Ruden, D. M. (2012) · Fly · doi:10.4161/fly.19695 · Cited by 11,816
Cited by
Sorted by citations
Items 101–194 of 194
Yuan, J., Kitchener, A. C., Lackey, L. B., Sun, T., Jiangzuo, Q., Tuohetahong, Y., Zhao, L., Yang, P., Wang, G., Huang, C., et al. (2024) · Proceedings of the National Academy of Sciences · doi:10.1073/pnas.2310763120 · Cited by 6
Self-citationThe Cheetah: Evolutionary History and Paleoecology
Valkenburgh, B. V., Pang, B., Cherin, M., & Rook, L. (2018) · Elsevier eBooks · doi:10.1016/b978-0-12-804088-1.00003-4 · Cited by 6
Zhernakova, D. V., Kliver, S. F., Cherkasov, N., Tamazian, G., Rotkevich, M., Krasheninnikova, K., Evsyukov, I., Sidorov, S., Dobrynin, P. V., Yurchenko, A. A., et al. (2018) · PLoS ONE · doi:10.1371/journal.pone.0200423 · Cited by 6
Self-citationDraftde novoGenome Assembly of the Elusive Jaguarundi,Puma yagouaroundi
Tamazian, G., Dobrynin, P. V., Zhuk, A. S., Zhernakova, D. V., Perelman, P. L., Serdyukova, N. A., Graphodatsky, A. S., Komissarov, A. S., Kliver, S. F., Cherkasov, N., et al. (2021) · Journal of Heredity · doi:10.1093/jhered/esab036 · Cited by 6
Self-citationDeterminants of genetic diversity in sticklebacksPreprint
Kivikoski, M., Feng, X., Löytynoja, A., Momigliano, P., & Merilä, J. (2023) · bioRxiv (Cold Spring Harbor Laboratory) · doi:10.1101/2023.03.17.533073 · Cited by 7
Purging of Highly Deleterious Mutations Through an Extreme Bottleneck
Stuart, O. P., Cleave, R., Pearce, K., Magrath, M. J. L., & Mikheyev, A. S. (2025) · Molecular Biology and Evolution · doi:10.1093/molbev/msaf079 · Cited by 5
A chromosome-scale high-contiguity genome assembly of the cheetah ( Acinonyx jubatus )
Winter, S., Meißner, R., Greve, C., Hamadou, A. B., Hořín, P., Prost, S., & Burger, P. A. (2023) · Journal of Heredity · doi:10.1093/jhered/esad015 · Cited by 5
Synteny search identifies carnivore Y chromosome for evolution of male specific genes
Fan, H., Hu, Y., Shan, L., Yu, L., Wang, B., Li, M., Wu, Q., & Wei, F. (2018) · Integrative Zoology · doi:10.1111/1749-4877.12352 · Cited by 5
Selected abstracts of Bioinformatics: from Algorithms to Applications 2021 Conference
(2021) · BMC Bioinformatics · doi:10.1186/s12859-021-04475-z · Cited by 5
Toward telomere-to-telomere cat genomes for precision medicine and conservation biologyPreprint
Murphy, W. J., & Harris, A. J. (2024) · Genome Research · doi:10.1101/gr.278546.123 · Cited by 5
Lok, S., Lau, T. N. H., Trost, B., Tong, A. H. Y., Paton, T., Wintle, R. F., Engstrom, M. D., Gunn, A., & Scherer, S. W. (2024) · Scientific Reports · doi:10.1038/s41598-024-67270-9 · Cited by 4
“Muskox genetic diversity is lower than two mammalian species under threat that have undergo recent genetic bottlenecks, the Tasmanian devil ( Sarcophilus harrisii ) 66 and the cheetah ( Acinonyx jubatus ) 67 .”
BackgroundChavez, D. E., Hains, T., Espinoza‐Ulloa, S. A., Wayne, R. K., & Chaves, J. A. (2024) · Journal of Heredity · doi:10.1093/jhered/esae017 · Cited by 5
Peers, J. A., Nash, W. J., & Haerty, W. (2025) · Evolution · doi:10.1093/evolut/qpaf005 · Cited by 4
Baird, A. B., Robinson, M. J., & Bickham, J. W. (2019) · Journal of Mammalogy · doi:10.1093/jmammal/gyz028 · Cited by 4
Vertebrate genomics and adaptation – Status and prospects in Africa
Ishengoma, E. (2023) · Molecular Ecology · doi:10.1111/mec.16936 · Cited by 4
Meißner, R., Mokgokong, P. S., Pretorius, C., Winter, S., Labuschagne, K., Kotzé, A., Prost, S., Hořín, P., Dalton, D. L., & Burger, P. A. (2024) · Scientific Reports · doi:10.1038/s41598-024-54076-y · Cited by 4
Huffmeyer, A. A., Pukazhenthi, B. S., & Wayne, R. K. (2021) · Animal Reproduction Science · doi:10.1016/j.anireprosci.2021.106698 · Cited by 5
Lan, T., Fang, D., Li, H., Sahu, S. K., Wang, Q., Yuan, H., Zhu, Y., Yang, Z., Zhang, L., Yang, S., et al. (2022) · Frontiers in Genetics · doi:10.3389/fgene.2021.819493 · Cited by 5
A decade of GigaScience: A perspective on conservation genetics
O’Brien, S. J. (2022) · GigaScience · doi:10.1093/gigascience/giac055 · Cited by 4
Self-citationHumble, E., Dobrynin, P. V., Senn, H., Chuven, J., Scott, A. F., Mohr, D. W., Dudchenko, O., Omer, A. D., Colaric, Z., Aiden, E. L., et al. (2019) · bioRxiv (Cold Spring Harbor Laboratory) · doi:10.1101/867341 · Cited by 4
Self-citationLacking conservation genomics in the giant Galápagos tortoisePreprint
Loire, É., & Galtier, N. (2017) · bioRxiv (Cold Spring Harbor Laboratory) · doi:10.1101/101980 · Cited by 4
Performance of Sequential Markovian Coalescence Methods when Populations are StructuredPreprint
Nieto, A., Lao, Ó., & Mona, S. (2025) · bioRxiv (Cold Spring Harbor Laboratory) · doi:10.1101/2025.10.09.681379 · Cited by 4
Khalatbari, L., Godinho, R., Abolghasemi, H., Hakimi, E., Ghadirian, T., Jowkar, H., Breitenmoser, U., & Brito, J. C. (2023) · Conservation Genetics · doi:10.1007/s10592-023-01513-6 · Cited by 3
Faurby, S., Werdelin, L., & Svenning, J. (2016) · Genome biology · doi:10.1186/s13059-016-0943-y · Cited by 3
Koester, D. C., Maly, M. A., Putman, S. B., Edwards, K. L., Meeks, K. Z., & Crosier, A. E. (2022) · Animals · doi:10.3390/ani12070809 · Cited by 3
Demography reveals populational expansion of a recently extinct Iberian ungulate
Forcina, G., Woutersen, K., Ramirez, S. S., Angelone, S., Crampe, J., Pérez, J. M., Fandós, P., Granados, J. E., & Jowers, M. J. (2021) · Zoosystematics and Evolution · doi:10.3897/zse.97.61854 · Cited by 3
First Steps towards the Development of Epigenetic Biomarkers in Female Cheetahs (Acinonyx jubatus)
Weyrich, A., Guerrero-Altamirano, T., Yasar, S., Czirják, G. Á., Wachter, B., & Fickel, J. (2022) · Life · doi:10.3390/life12060920 · Cited by 3
The Evolutionary Dynamics of a Sex-Structured Population with Non-Overlapping Generations
Revutskaya, O. L., Неверова, Г. П., Жданова, О. Л., & Frisman, E. Y. (2023) · Mathematics · doi:10.3390/math11244971 · Cited by 3
Conservation Genomics of Neotropical Carnivores
Eduardo Eizirik, C., de Ferran, V., Sartor, C. C., Trindade, F. J., & Figueiró, H. V. (2023) · Springer eBooks · doi:10.1007/978-3-031-34854-9_19 · Cited by 2
Marr, M. M., Humble, E., Lurz, P. W. W., Wilson, L. A., Milne, E., Beckmann, K. M., Schoenebeck, J. J., Fung, U., Kitchener, A. C., Kortland, K., et al. (2025) · Evolutionary Applications · doi:10.1111/eva.70072 · Cited by 2
Kuno National Park is not yet ready for Cheetahs
Singh, U. S. (2022) · The Applied Biology & Chemistry Journal · doi:10.52679/tabcj.2022.0006 · Cited by 2
NONDOMESTIC FELID ABC BLOOD PHENOTYPING, GENOTYPING, AND CROSSMATCHING
Parkinson, L. A. B., Kuder, H., Kehl, A., Koenig, A., Good, J. L., Hausmann, J. C., & Giger, U. (2024) · Journal of Zoo and Wildlife Medicine · doi:10.1638/2023-0025 · Cited by 2
The assembled and annotated genome of the masked palm civet (Paguma larvata)
Liu, P., Jiang, H., Li, L., Zhou, J., Huang, W., & Chen, J. (2022) · GigaScience · doi:10.1093/gigascience/giac041 · Cited by 2
A Beautiful Life: High Risk–High Payoff in Genetic Science
O’Brien, S. J. (2019) · Annual Review of Animal Biosciences · doi:10.1146/annurev-animal-021419-083944 · Cited by 2
Self-citationShepherd, S. M. (2020) · Springer eBooks · doi:10.1007/978-3-030-42335-3_2 · Cited by 2
Lam, S. S., Chew, K. W., Show, P. L., Ling, N., Ok, Y. S., Peng, W., Alstrup, A. K. O., Adams, D. H., Rinklebe, J., & Sonne, C. (2020) · Environmental Research · doi:10.1016/j.envres.2020.109966 · Cited by 2
Response to Comment by Faurby, Werdelin and Svenning
O’Brien, S. J., Koepfli, K., Eduardo Eizirik, C., Johnson, W. E., Driscoll, C. A., Antunes, A., Schmidt‐Küntzel, A., Marker, L. L., & Dobrynin, P. V. (2016) · Genome biology · doi:10.1186/s13059-016-0942-z · Cited by 2
Self-citationIto, H., Nakajima, N., Onuma, M., Kishida, T., & Inoue‐Murayama, M. (2025) · Biology · doi:10.3390/biology14070880 · Cited by 1
Wang, S., Zhang, D., Jiao, X., Wu, L., Zhu, Q., Lv, H., Wang, H., Han, Z., Li, S., He, P., et al. (2025) · BMC Biology · doi:10.1186/s12915-025-02393-7 · Cited by 1
Range and diet diversity in the Pleistocene American “cheetah,” Miracinonyx trumani
Cassatt‐Johnstone, M., Wooldridge, T. B., Ghosh, S., Hall, E., Hewitson, S., Meachen, J., Wooller, M. J., Zazula, G., & Shapiro, B. (2026) · Current Biology · doi:10.1016/j.cub.2026.07.072 · Cited by 1
Lacking conservation genomics in the giant Galápagos tortoise
Loire, É., & Galtier, N. (2021) · Peer Community Journal · doi:10.24072/pcjournal.24 · Cited by 1
Salis, A. T., Schubert, B. W., Bray, S. C. E., Heiniger, H., Meachen, J., Cooper, A., & Mitchell, K. J. (2025) · Zoological Journal of the Linnean Society · doi:10.1093/zoolinnean/zlaf001 · Cited by 1
Fabiano, E. C., Bonatto, S. L., Schmidt‐Küntzel, A., O’Brien, S. J., Marker, L. L., & Eduardo Eizirik, C. (2025) · Genetics and Molecular Biology · doi:10.1590/1678-4685-gmb-2024-0253 · Cited by 1
Self-citationModular adaptation of the ribcage in response to artificial selection for endurance running
Webb, E. B., Hennekam, J. J., Schwartz, N. E., Garland, T., & Jones, K. E. (2026) · The Anatomical Record · doi:10.1002/ar.70130 · Cited by 2
Tian, Y., Lin, Y., Ma, Y., Li, J., Sahu, S. K., Fan, J., Lin, C., Li, Z., Shi, M., He, F., et al. (2025) · Biology · doi:10.3390/biology14010030 · Cited by 1
Nutritional Considerations for Captive Cheetahs
Whitehouse‐Tedd, K., Dierenfeld, E. S., Becker, A. A. M. J., Huys, G. R. B., Depauw, S., Kerr, K. R., WILLIAMS, J., & Janssens, G. (2018) · Elsevier eBooks · doi:10.1016/b978-0-12-804088-1.00026-5 · Cited by 1
Neal, D. (2018) · Cambridge University Press eBooks · doi:10.1017/9781139107976.010 · Cited by 1
Whole genome approach in conservation biology and its perspectives
Kliver, S. F. (2021) · Ecological genetics · doi:10.17816/ecogen65152 · Cited by 1
Self-citationDe novo assembly and annotation of Asiatic lion ( Panthera leo persica ) genomePreprint
Mitra, S., Ara, S., Sowpati, D. T., Kumar, A. S., Awasthi, G., Kumar, M., Tabusum, W., & Gaur, A. (2019) · bioRxiv (Cold Spring Harbor Laboratory) · doi:10.1101/549790 · Cited by 1
Acoustic and Genetic Approaches for Informing Population Status and Trends of Migratory Tree Bats
Hein, C. D., Hale, A. M., & Straw, B. R. (2021) · doi:10.2172/1779055 · Cited by 1
Darwin Questions the Fixity of Species
Neal, D. (2018) · Cambridge University Press eBooks · doi:10.1017/9781139107976.002
Biodiversity Loss and Countermeasures
Funk, S. M. (2020) · Encyclopedia of the UN sustainable development goals · doi:10.1007/978-3-319-71065-5_88-1
Chromosome-Level Genome Assemblies: Expanded Capabilities for Conservation Biology Research
Totikov, A., Tomarovsky, A. A., Derežanin, L., Dudchenko, O., Aiden, E. L., Koepfli, K., & Kliver, S. F. (2020) · doi:10.3390/iecge-07149
Self-citationErwin Panofsky: el humanismo como utopía
Salamero, R. C. (1988) · Turia: Revista cultural
Neal, D. (2018) · Cambridge University Press eBooks · doi:10.1017/9781139107976.024
Neal, D. (2018) · Cambridge University Press eBooks · doi:10.1017/9781139107976.020
Neal, D. (2018) · Cambridge University Press eBooks · doi:10.1017/9781139107976.025
Neal, D. (2018) · Cambridge University Press eBooks · doi:10.1017/9781139107976.015
Neal, D. (2018) · Cambridge University Press eBooks · doi:10.1017/9781139107976.001
Population Genetics: Summary and Synthesis
Neal, D. (2018) · Cambridge University Press eBooks · doi:10.1017/9781139107976.018
Applying Zygotic Selection Models to Natural Systems
Neal, D. (2018) · Cambridge University Press eBooks · doi:10.1017/9781139107976.016
Species Interactions and Community Structure
Neal, D. (2018) · Cambridge University Press eBooks · doi:10.1017/9781139107976.021
Understanding Natural Selection
Neal, D. (2018) · Cambridge University Press eBooks · doi:10.1017/9781139107976.004
Neal, D. (2018) · Cambridge University Press eBooks · doi:10.1017/9781139107976.007
Neal, D. (2018) · Cambridge University Press eBooks · doi:10.1017/9781139107976.013
Animal Behaviour, Altruism and Limiting Aggression
Neal, D. (2018) · Cambridge University Press eBooks · doi:10.1017/9781139107976.022
Neal, D. (2018) · Cambridge University Press eBooks · doi:10.1017/9781139107976.006
Sexual Selection and Mating Systems
Neal, D. (2018) · Cambridge University Press eBooks · doi:10.1017/9781139107976.023
Neal, D. (2018) · Cambridge University Press eBooks · doi:10.1017/9781139107976.005
Growth of Age-Structured and Stage-Structured Populations
Neal, D. (2018) · Cambridge University Press eBooks · doi:10.1017/9781139107976.008
Polygenic Inheritance and Quantitative Genetics
Neal, D. (2018) · Cambridge University Press eBooks · doi:10.1017/9781139107976.017
Darwin’s Evolutionary Theories
Neal, D. (2018) · Cambridge University Press eBooks · doi:10.1017/9781139107976.003
Migration, Gene Flow and Differentiation of Populations
Neal, D. (2018) · Cambridge University Press eBooks · doi:10.1017/9781139107976.014
Neal, D. (2018) · Cambridge University Press eBooks · doi:10.1017/9781139107976.019
Mutation and the Genetic Variation of Populations
Neal, D. (2018) · Cambridge University Press eBooks · doi:10.1017/9781139107976.011
Biodiversity Loss and Countermeasures
Funk, S. M. (2020) · Encyclopedia of the UN sustainable development goals · doi:10.1007/978-3-319-95981-8_88
Neal, D. (2018) · Cambridge University Press eBooks · doi:10.1017/9781139107976.026
Noga, A., Anyonge, W., & Powers, A. K. (2022) · bioRxiv (Cold Spring Harbor Laboratory) · doi:10.1101/2022.05.20.492788
Acton, E., Acton, J., & Acton, P. (2018) · Journal of Emerging Investigators · doi:10.59720/17-119
Review of heterozygosity visualization approaches in the context of conservation research
Tomarovsky, A. A., Totikov, A., Yakupova, A. R., Graphodatsky, A. S., & Kliver, S. F. (2023) · Ecological genetics · doi:10.17816/ecogen609552
Self-citationBiomechanics of Cheetah with Applications in Robotics and Athletics
Kherwar, P. K., Adhikari, B., & Adhikari, D. (2023) · Journal of Multidisciplinary Science MIKAILALSYS · doi:10.58578/mikailalsys.v2i1.2390
Casanova, M. (2025) · Paleobiology · doi:10.1017/pab.2024.46
Insights from molecular methods into past and present sea otter populations
Larson, S., Wellman, H. P., Beichman, A. C., Carter, N. H., & Smith, E. A. E. (2025) · Elsevier eBooks · doi:10.1016/b978-0-443-18805-3.00010-0
Ichizawa, S., Caspers, J., Uenoyama, R., Morisasa, M., Goto‐Inoue, N., Miyazaki, T., Suzuki, Y., Nakanishi, N., Endo, Y., Izawa, M., et al. (2025) · bioRxiv (Cold Spring Harbor Laboratory) · doi:10.1101/2025.09.01.673589
Oleksyk, T. K., Koepfli, K., & O’Brien, S. J. (2025) · Journal of Heredity · doi:10.1093/jhered/esaf060
Self-citationSamaha, G., Wade, C. M., Mazrier, H., Grueber, C. E., & Haase, B. (2021) · Figshare · doi:10.6084/m9.figshare.15128160
Poonia, A., Battu, P., Ghanghas, A., Singh, D., & Thakur, E. (2026) · Springer eBooks · doi:10.1007/978-981-95-3694-8_4
Genome Scans Reveal Species-Specific Selection in the Genus Lynx
Lorenzo‐Fernández, L., Bazzicalupo, E., Koen, E. L., Janečka, J. E., Murphy, W. J., Schmidt, K., & Godoy, J. A. (2026) · Genome Biology and Evolution · doi:10.1093/gbe/evag086
Meli, I., Madurell‐Malapeira, J., Rook, L., Michaud, M., Zoccante, S., & Lucenti, S. B. (2026) · The Anatomical Record · doi:10.1002/ar.70213
O'Regan, K., Ryan, L., & Hughes, G. M. (2026) · bioRxiv (Cold Spring Harbor Laboratory) · doi:10.64898/2026.08.03.742608
Peers, J. A., Sibley, H. R., Armstrong, E. E., Crosier, A. E., Nash, W. J., Koepfli, K., & Haerty, W. (2026) · Molecular Ecology · doi:10.1111/mec.70513
Self-citationBrainstem and cerebellar variations in cheetahs ( Acinonyx jubatus )
Baizer, J. S., Sherwood, C. C., Hof, P. R., Malungo, I. B., Ngwenya, A., Burkevica, A., Bertelsen, M. F., Manger, P. R., & Baker, J. F. (2026) · The Anatomical Record · doi:10.1002/ar.70324
Metadata
- Authors
- Dobrynin, P., Liu, S., Tamazian, G., Xiong, Z., Yurchenko, A. A., Krasheninnikova, K., Kliver, S., Schmidt-Küntzel, A., Koepfli, K.-P., Johnson, W., Kuderna, L. F. K., García-Pérez, R., Manuel, M. D., Godinez, R., Komissarov, A., Makunin, A., Brukhin, V., Qiu, W., Zhou, L., Li, F., Yi, J., Driscoll, C., Antunes, A., Oleksyk, T. K., Eizirik, E., Perelman, P., Roelke, M., Wildt, D., Diekhans, M., Marques-Bonet, T., Marker, L., Bhak, J., Wang, J., Zhang, G., & O’Brien, S. J.
- Affiliations
- St Petersburg University (RU)
- Sun Yat-sen University (CN)
- China National GeneBank (CN)
- Smithsonian Conservation Biology Institute (US)
- Consejo Superior de Investigaciones Científicas (ES)
- Harvard University (US)
- National Institutes of Health (US)
- Universidade do Porto (PT)
- Russian Academy of Sciences (RU)
- Leidos Biomedical Research Inc. (United States) (US)
- University of California, Santa Cruz (US)
- Cheetah Conservation Fund (NA)
- Ulsan National Institute of Science and Technology (KR)
- BGI Group (China) (CN)
- University of Copenhagen (DK)
- Corresponding author
- O’Brien, Stephen J.
- ORCID
- Dobrynin, Pavel
- Liu, Shiping
- Tamazian, Gaik
- Xiong, Zijun
- Yurchenko, Andrey A.
- Krasheninnikova, Ksenia
- Koepfli, Klaus-Peter
- Johnson, Warren
- Kuderna, Lukas F.K.
- García-Pérez, Raquel
- Komissarov, Aleksey
- Brukhin, Vladimir
- Zhou, Long
- Li, Fang
- Yi, Jian
- Driscoll, Carlos
- Antunes, Agostinho
- Perelman, Polina
- Roelke, Melody
- Diekhans, Mark
- Marker, Laurie
- Bhak, Jong
- Wang, Jun
- Zhang, Guojie
- O’Brien, Stephen J.
- Venue
- Genome Biology
- Published
- 2015-12
- Volume
- 16
- Issue
- 1
- Pages
- 277-277
- ISSN
- 1465-6906 (ISSN-L)
- 1474-760X
- PMC
- PMC4676127
- OpenAlex
- W2196011667
- Cited by
- 204
- References
- 95
- Citations by year
- 2026: 8 · 2025: 16 · 2024: 10 · 2023: 16 · 2022: 23 · 2021: 18 · 2020: 20 · 2019: 18 · 2018: 51 · 2017: 9 · 2016: 13
- FWCI
- 16.63
- Type
- journal article
- Language
- en
- Open access
- gold
- doi.org
- Licence
- Locations
- Genome biology (publishedVersion, cc-by)
- Europe PMC (PubMed Central) (publishedVersion, cc-by)
- PubMed Central (publishedVersion, cc-by)
- PubMed (publishedVersion)
- LA Referencia (Red Federada de Repositorios Institucionales de Publicaciones Científicas) (publishedVersion, other-oa)
- Research at the University of Copenhagen (University of Copenhagen) (publishedVersion, cc-by)
- RECERCAT (Consorci de Serveis Universitaris de Catalunya) (publishedVersion, other-oa)
- Digital Access to Scholarship at Harvard (DASH) (Harvard University) (submittedVersion, cc-by)
- NSUWorks (Nova Southeastern University) (submittedVersion, cc-by)
- DIGITAL.CSIC (Spanish National Research Council (CSIC)) (submittedVersion, cc-by)
- Repositori digital de la UPF (Universitat Pompeu Fabra) (submittedVersion, cc-by)
- Scholarworks@UNIST (Ulsan National Institute of Science and Technology) (submittedVersion)
- Figshare (cc-by)
- Funders
- Ministry of Environment
- Institució Catalana de Recerca i Estudis Avançats
- Saint Petersburg State University (1.50.1623.2013)
- Ministerio de Ciencia e Innovación (BFU2014-55090-P)
- Megagrants
- Topics
- Life Sciences › Biochemistry, Genetics and Molecular Biology › Genetics › Genetic diversity and population structure
- Life Sciences › Biochemistry, Genetics and Molecular Biology › Genetics › Genetic and phenotypic traits in livestock
- Life Sciences › Biochemistry, Genetics and Molecular Biology › Molecular Biology › Genomics and Phylogenetic Studies
- Keywords
- cheetah, inbreeding depression, homozygosity, population bottleneck, non-synonymous mutations, AKAP4, sperm abnormalities, skin graft rejection, Late Pleistocene extinction, demographic history
- MeSH terms
- Animals, Cats, Acinonyx, Dogs, Multigene Family, Male, Genetic Variation, Genome, Genomics
About these checks
Registry, retraction, Cites and statistics results are computed, not judged, with one exception: a printed reference that no index lists is read once by a model before it counts as a citation error. Claims are extracted by a model and kept only when their quote appears verbatim in the text; each cited source is then checked, with a model’s help, for whether it says what the claim relies on. Those verdicts can be wrong — read the claim’s quote and the cited source before relying on one.
Statistics and arithmetic are recomputed, not judged.
Confidence bands are shown only for fields calibrated on our annotated test set. None is calibrated yet, so no band is shown.
What counts as a claim ›How we measure confidence ›How we check this ›
Are you an author, or do you see a problem with this page? Request a review
