

The DOI matches its Crossref record; 69 of the 69 references it cites were found in a registry or an index.
GATA3-dependent cellular reprogramming requires activation-domain dependent recruitment of a chromatin remodeler
Open accessAbstract
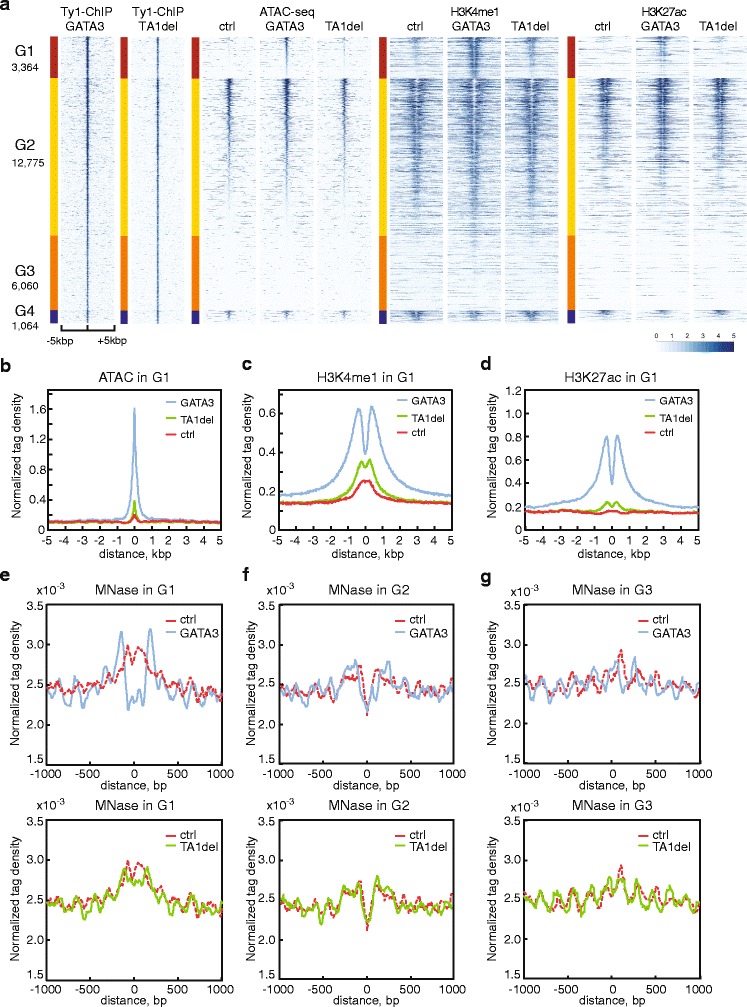
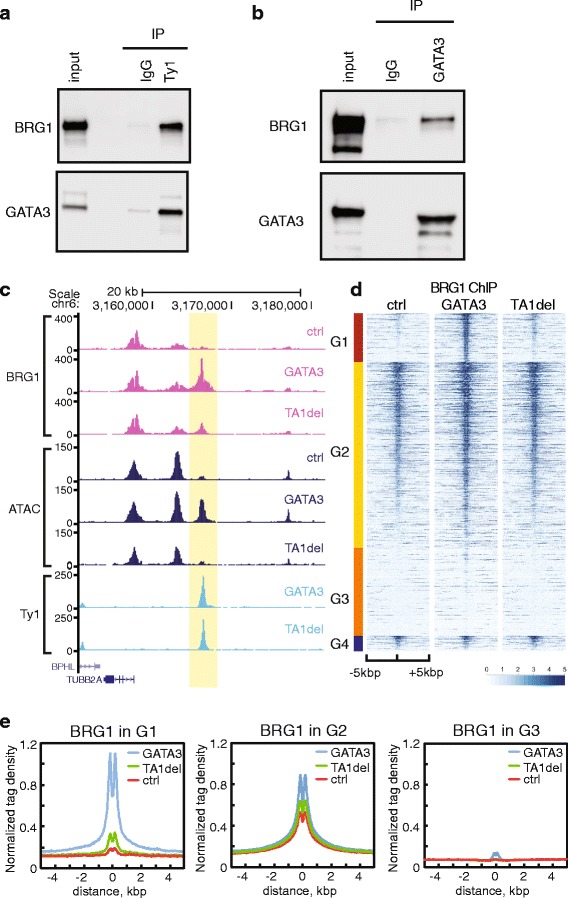
BACKGROUND: Transcription factor-dependent cellular reprogramming is integral to normal development and is central to production of induced pluripotent stem cells. This process typically requires pioneer transcription factors (TFs) to induce de novo formation of enhancers at previously closed chromatin. Mechanistic information on this process is currently sparse. RESULTS: Here we explore the mechanistic basis by which GATA3 functions as a pioneer TF in a cellular reprogramming event relevant to breast cancer, the mesenchymal to epithelial transition (MET). In some instances, GATA3 binds previously inaccessible chromatin, characterized by stable, positioned nucleosomes where it induces nucleosome eviction, alters local histone modifications, and remodels local chromatin architecture. At other loci, GATA3 binding induces nucleosome sliding without concomitant generation of accessible chromatin. Deletion of the transactivation domain retains the chromatin binding ability of GATA3 but cripples chromatin reprogramming ability, resulting in failure to induce MET. CONCLUSIONS: These data provide mechanistic insights into GATA3-mediated chromatin reprogramming during MET, and suggest unexpected complexity to TF pioneering. Successful reprogramming requires stable binding to a nucleosomal site; activation domain-dependent recruitment of co-factors including BRG1, the ATPase subunit of the SWI/SNF chromatin remodeling complex; and appropriate genomic context. The resulting model provides a new conceptual framework for de novo enhancer establishment by a pioneer TF.
Overview
The claims and statistics of this paper haven’t been checked yet.
Run the check — free, no account needed. It reads the open-access text and checks the sources it cites.
Integrity signals
Registry
Cites
Statistics
Figures
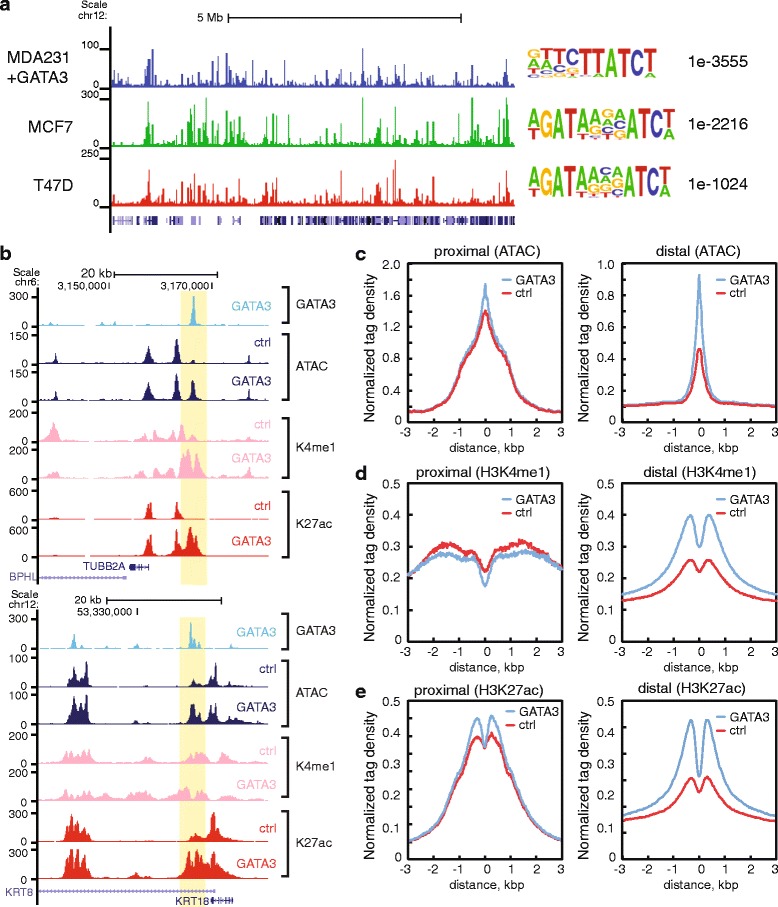
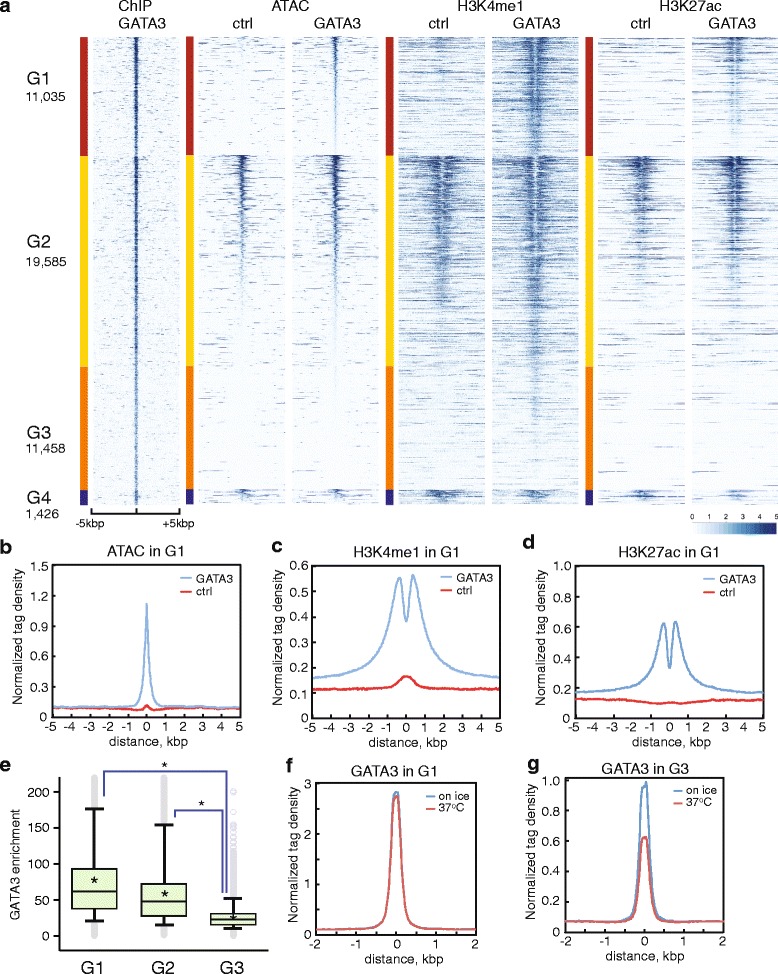
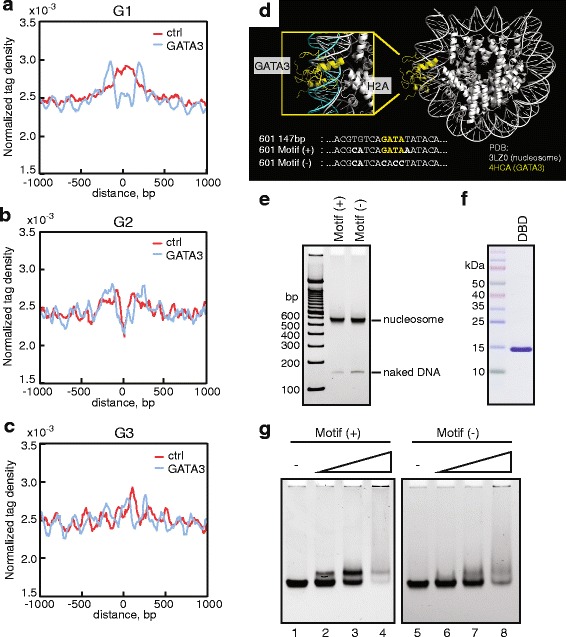
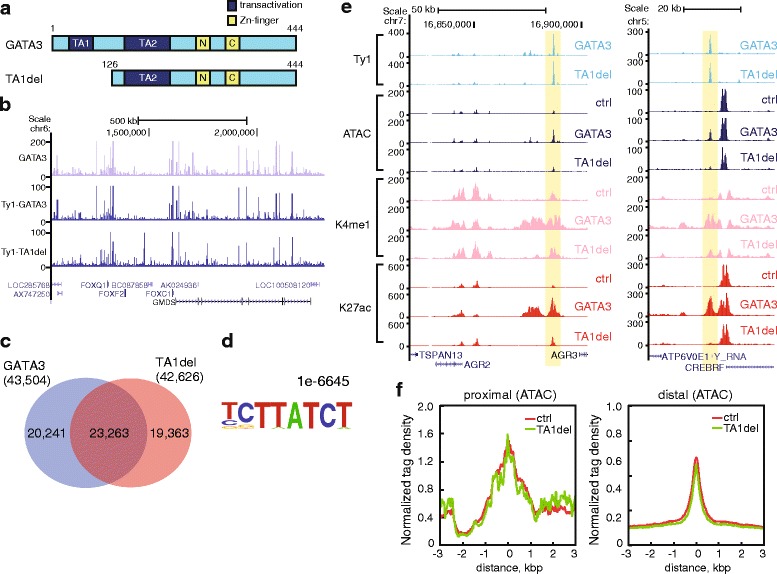
Verification
Claims the paper makes
The claims and statistics of this paper haven’t been checked yet.
Run the check — free, no account needed. It reads the open-access text and checks the sources it cites.
Claims other papers make about this one
Each is checked against this paper’s own text: does it say what the citing paper says it does?
The cited source says what the claim attributes to it.
In the citing paper
“Our results suggests that SOX9 harbours this ability but, as observed with other pioneer TFs (47,69,70), not all SOX9 binding events result in opening of chromatin.”
From SOX9 reprograms endothelial cells by altering the chromatin landscape (2022) · cites this paper as [69]
The cited source says what the claim attributes to it.
In the citing paper
“The mechanisms of pioneer factor action are still being established [37], but at least some of them (such as FOXA, OCT4 and SOX2/SOX11) have been shown to initiate chromatin opening by direct displacement of histones [38–41], whilst many others recruit chromatin remodelers [42–50].”
From Transcriptional enhancers and their communication with gene promoters (2021) · cites this paper as [49]
Self-check
Percentages, sums and reported differences re-computed from the paper’s own numbers.
The self-check needs the paper’s full text.
Citations
Cites
Robinson, M. D., McCarthy, D. J., & Smyth, G. K. (2010) · Bioinformatics · doi:10.1093/bioinformatics/btp616 · Cited by 41,364
PD-1 and PD-L1 Immune Checkpoint Blockade to Treat Breast Cancer
Hartkopf, A. D., Taran, F., Wallwiener, M., Walter, C. B., Krämer, B., Grischke, E., & Brucker, S. Y. (2016) · Breast Care · doi:10.1159/000453569 · Cited by 30,989
Ultrafast and memory-efficient alignment of short DNA sequences to the human genome.
Langmead, B., Trapnell, C., Pop, M., & Salzberg, S. L. (2009) · Genome Biology · doi:10.1186/gb-2009-10-3-r25 · Cited by 21,849
An integrated encyclopedia of DNA elements in the human genome
The ENCODE Project Consortium (2012) · Nature · doi:10.1038/nature11247 · Cited by 18,072
Heinz, S., Benner, C., Spann, N., Bertolino, E., Lin, Y. C., Laslo, P., Cheng, J. X., Murre, C., Singh, H., & Glass, C. K. (2010) · Molecular Cell · doi:10.1016/j.molcel.2010.05.004 · Cited by 13,382
Gene Expression Omnibus: NCBI gene expression and hybridization array data repository
Edgar, R. (2002) · Nucleic Acids Research · doi:10.1093/nar/30.1.207 · Cited by 13,288
Nishimura, R., Osako, T., Nishiyama, Y., Tashima, R., Nakano, M., Fujisue, M., Toyozumi, Y., & Arima, N. (2013) · Oncology · doi:10.1159/000353099 · Cited by 13,239
Comprehensive molecular portraits of human breast tumours
The Cancer Genome Atlas Network (2012) · Nature · doi:10.1038/nature11412 · Cited by 12,129
Buenrostro, J. D., Giresi, P. G., Zaba, L. C., Chang, H. Y., & Greenleaf, W. J. (2013) · Nature Methods · doi:10.1038/nmeth.2688 · Cited by 6,422
Lowary, P. T., & Widom, J. (1998) · Journal of Molecular Biology · doi:10.1006/jmbi.1997.1494 · Cited by 1,782
Cited by
Sorted by citations
Items 101–151 of 151
Proteasome Inhibition Reprograms Chromatin Landscape in Breast Cancer
Kinyamu, H. K., Bennett, B. D., Ward, J. M., & Archer, T. (2024) · Cancer Research Communications · doi:10.1158/2767-9764.crc-23-0476 · Cited by 6
Self-citationPioneer factors outline chromatin architecture
Gómora‐García, J. C., & Furlan-Magaril, M. (2025) · Current Opinion in Cell Biology · doi:10.1016/j.ceb.2025.102480 · Cited by 7
Indirect Mechanisms of Transcription Factor‐Mediated Gene Regulation during Cell Fate Changes
Larcombe, M. R., Hsu, S., Polo, J. M., & Knaupp, A. S. (2022) · Advanced Genetics · doi:10.1002/ggn2.202200015 · Cited by 9
Structural and Dynamic Changes of Nucleosome upon GATA3 Binding
Ishida, H., Matsumoto, A., Tanaka, H., Okuda, A., Morishima, K., Wade, P. A., Kurumizaka, H., Sugiyama, M., & Kono, H. (2023) · Journal of Molecular Biology · doi:10.1016/j.jmb.2023.168308 · Cited by 7
Self-citationCosta, J. R., Li, Y., Anuar, N. Z., O’Connor, D., Rahman, S., Rapoz-D’Silva, T., Fung, K. T. M., Pocock, R., Li, Z., Henderson, S. R., et al. (2025) · Cell Reports · doi:10.1016/j.celrep.2025.115705 · Cited by 5
GATA3 differentially regulates the transcriptome via zinc finger 2-modulated phase separation
Chen, Y., Wan, Y., Pei, X., Wei, Z., Wang, T., Zhang, J., & Chen, L. (2025) · Cell Reports · doi:10.1016/j.celrep.2025.115702 · Cited by 5
The role of Gata3 in renin cell identity
Neyra, J. S., Medrano, S., Martini, A. G., Sequeira-Lόpez, M. L. S., & Gómez, R. A. (2023) · American Journal of Physiology-Renal Physiology · doi:10.1152/ajprenal.00098.2023 · Cited by 5
Bisson, J. A., Gordillo, M., Kumar, R., de Silva, N., Yang, E., Banks, K. M., Shi, Z., Lee, K., Yang, D., Chung, W. K., et al. (2025) · eLife · doi:10.7554/elife.100797.3 · Cited by 5
It’s a Phase That EBF1 Is Going Through
Kee, B. L. (2020) · Immunity · doi:10.1016/j.immuni.2020.11.013 · Cited by 5
P4HTM: A Novel Downstream Target of GATA3 in Breast CancerPreprint
DiDonna, S. C., Nagornyuk, A., Adhikari, N., Takada, M., & Takaku, M. (2023) · Research Square · doi:10.21203/rs.3.rs-2622989/v1 · Cited by 5
Self-citationStructural studies of functional nucleosome complexes with transacting factors
Kurumizaka, H. (2022) · Proceedings of the Japan Academy Series B · doi:10.2183/pjab.98.001 · Cited by 4
Self-citationBreast Cancer Heterogeneity: A focus on Epigenetics and In Vitro 3D Model Systems.
Suresh, P. K. (2018) · Europe PMC (PubMed Central) · doi:10.22074/cellj.2018.5442 · Cited by 4
Yang, H., Zhang, H., Luan, Y., Liu, T., Roberts, K. G., Qian, M., Zhang, B., Yang, W., Pérez-Andreu, V., Xu, J., et al. (2020) · bioRxiv (Cold Spring Harbor Laboratory) · doi:10.1101/2020.02.23.961672 · Cited by 4
Nami, B., Ghanaeian, A., & Wang, Z. (2020) · bioRxiv (Cold Spring Harbor Laboratory) · doi:10.1101/2020.03.24.006379 · Cited by 4
Dishevelled-1 regulates global transcriptomic changes and associates with ETS1 transcription factor
Martinez‐Marin, D., Sharma, M., van Wunnik, J. C., de Miranda, F. S., Boligala, G. P., Jull, E. C., Stroman, G. C., Babcock, R. L., & Pruitt, K. (2025) · Nature Communications · doi:10.1038/s41467-025-61551-1 · Cited by 3
Kim, H. M., Park, S. H., Park, S. Y., Cha, S. H., Do, J. H., Kim, A. Y., Jeon, M. J., Shim, J. S., & Joung, Y. H. (2022) · Plant Cell Reports · doi:10.1007/s00299-022-02886-7 · Cited by 3
Chen, X., Yang, H., Liu, G., & Zhang, Y. (2021) · BMC Bioinformatics · doi:10.1186/s12859-021-04239-9 · Cited by 3
Chen, P., Du, R., Chang, Z., Gao, W., Zhao, W., & Dong, G. (2023) · Journal of Gastrointestinal Oncology · doi:10.21037/jgo-23-271 · Cited by 2
Sekulovski, N., Carleton, A. E., Lin, C., & Taniguchi, K. (2025) · Development · doi:10.1242/dev.204621 · Cited by 2
SMARCA4-deficient central nervous system metastases: A case series and systematic review
Morris, M., Ararat, K., Cutshall, H. P., Gökden, M., Rodriguez, A., Rooper, L. M., Lindberg, M. R., & Nix, J. S. (2024) · Journal of Neuropathology & Experimental Neurology · doi:10.1093/jnen/nlae039 · Cited by 2
Sekulovski, N., Wettstein, J. C., Carleton, A. E., Juga, L. N., Taniguchi, L. E., Ma, X., Rao, S., Schmidt, J. K., Golos, T. G., Lin, C., et al. (2024) · eLife · doi:10.7554/elife.89367.3 · Cited by 2
Bioinformatic and experimental analyses of GATA3 and its regulatory miRNAs in breast Cancer
Roohy, F., Moghanibashi, M., & Tahmasebi, S. (2024) · Discover Oncology · doi:10.1007/s12672-024-01479-y · Cited by 2
The regulatory role of pioneer factors during cardiovascular lineage specification – A mini review
Sierra-Pagán, J. E., & Garry, D. J. (2022) · Frontiers in Cardiovascular Medicine · doi:10.3389/fcvm.2022.972591 · Cited by 2
Fuglerud, B. M., Drissler, S., Lotto, J., Stephan, T. L., Thakur, A., Cullum, R. L., & Hoodless, P. A. (2020) · bioRxiv (Cold Spring Harbor Laboratory) · doi:10.1101/2020.09.11.293993 · Cited by 2
ASCL1 interacts with the mSWI/SNF at distal regulatory elements to regulate neural differentiationPreprint
Păun, O., Tan, Y. X., Patel, H., Strohbuecker, S., Ghanate, A. D., Gigli, C. C., Sopeña, M. L., Gerontogianni, L., Goldstone, R. J., Ang, S., et al. (2022) · bioRxiv (Cold Spring Harbor Laboratory) · doi:10.1101/2022.10.09.510609 · Cited by 2
Feed-forward loops by NR5A2 ensure robust gene activation during pre-implantation development
Kobayashi, W., Ruangroengkulrith, S., Arslantas, E. N., Mohanan, A., & Tachibana, K.-E. K. (2025) · Development · doi:10.1242/dev.205059 · Cited by 1
Recognition of diverse GATA motifs necessitates multimodal GATA3-DNA binding
Gharui, S., Puntambekar, S. S., Sarkar, R. R., Narlikar, L., & Sengupta, D. (2026) · Biochemical and Biophysical Research Communications · doi:10.1016/j.bbrc.2026.153718 · Cited by 1
Du, C., Jiang, J., Li, Y., Yu, M., Jin, J., Chen, S., Fan, H., Macfarlan, T. S., Cao, B., & Sun, M. (2022) · bioRxiv (Cold Spring Harbor Laboratory) · doi:10.1101/2022.08.02.502490 · Cited by 1
Temporally resolved early BMP-driven transcriptional cascade during human amnion specificationPreprint
Sekulovski, N., Wettstein, J. C., Carleton, A. E., Juga, L. N., Taniguchi, L. E., Ma, X., Rao, S., Schmidt, J. K., Golos, T. G., Lin, C., et al. (2023) · bioRxiv (Cold Spring Harbor Laboratory) · doi:10.1101/2023.06.19.545574 · Cited by 1
Bisson, J. A., Gordillo, M., Kumar, R., de Silva, N., Yang, E., Banks, K. M., Shi, Z., Lee, K., Yang, D., Chung, W. K., et al. (2024) · eLife · doi:10.7554/elife.100797.1 · Cited by 1
Bisson, J. A., Gordillo, M., Kumar, R., de Silva, N., Yang, E., Banks, K. M., Shi, Z., Lee, K., Yang, D., Chung, W. K., et al. (2024) · eLife · doi:10.7554/elife.100797 · Cited by 1
Elucidating Blood Origin: From Reprogramming to Ontogeny
Gomes, A. M. (2018) · Portuguese National Funding Agency for Science, Research and Technology (RCAAP Project by FCT)
NUCOME : A Comprehensive Database of Nucleosome Organizations in Mammalian GenomesPreprint
Chen, X., Yang, H., & Zhang, Y. (2018) · bioRxiv (Cold Spring Harbor Laboratory) · doi:10.1101/414094
GATA3 mutation disrupts a functional network governed by estrogen receptor, FOXA1 and GATA3Preprint
Takaku, M., Grimm, S. A., Kumar, B. D., Bennett, B. D., & Wade, P. A. (2019) · bioRxiv (Cold Spring Harbor Laboratory) · doi:10.1101/654871
Self-citationBlelloch, R. H. (2018) · Faculty Opinions – Post-Publication Peer Review of the Biomedical Literature · doi:10.3410/f.727397521.793549797
Saotome, M., Poduval, D. B., Grimm, S. A., Nagornyuk, A., Gunarathna, S., Shimbo, T., Wade, P. A., & Takaku, M. (2023) · bioRxiv (Cold Spring Harbor Laboratory) · doi:10.1101/2023.03.02.530867
Self-citationTakaku, M., Saotome, M., Poduval, D. B., Grimm, S. A., Nagornyuk, A., Gunarathna, S., Shimbo, T., & Wade, P. A. (2023) · Research Square · doi:10.21203/rs.3.rs-2587918/v1
Self-citationAlpsoy, A., Utturkar, S. M., Carter, B. C., Dhiman, A., Torregrosa‐Allen, S. E., Currie, M. P., Elzey, B. D., & Dykhuizen, E. C. (2023) · doi:10.1158/0008-5472.c.6512724.v1
Temporally resolved early BMP-driven transcriptional cascade during human amnion specificationPreprint
Sekulovski, N., Wettstein, J. C., Carleton, A. E., Taniguchi, L. E., Ma, X., Rao, S., Schmidt, J. K., Golos, T. G., Lin, C., & Taniguchi, K. (2023) · eLife · doi:10.7554/elife.89367.1
Temporally resolved early BMP-driven transcriptional cascade during human amnion specificationPreprint
Sekulovski, N., Wettstein, J. C., Carleton, A. E., Juga, L. N., Taniguchi, L. E., Ma, X., Rao, S., Schmidt, J. K., Golos, T. G., Lin, C., et al. (2024) · eLife · doi:10.7554/elife.89367.2
Morse, R. H. (2024) · Elsevier eBooks · doi:10.1016/b978-0-12-814809-9.00009-3
Bisson, J. A., Gordillo, M., Kumar, R., de Silva, N., Yang, E., Banks, K. M., Shi, Z., Lee, K., Yang, D., Chung, W. K., et al. (2025) · eLife · doi:10.7554/elife.100797.2
Chen, X., Yang, H., Liu, G., & Zhang, Y. (2021) · Figshare · doi:10.6084/m9.figshare.14776523
Additional file 1 of Nucleosome reorganisation in breast cancer tissues
Jacob, D. R., Guiblet, W. M., Mamayusupova, H., Shtumpf, M., Ciuta, I., Ruje, L., Gretton, S., Bikova, M., Correa, C., Dellow, E., et al. (2024) · Figshare · doi:10.6084/m9.figshare.25522559
Non-Coding RNA-GATA Axis: Mechanisms and Implications in Cancer Progression and Metastases
Kumar, A., Daimary, U. D., Hegde, M., Abbas, M. A. E., Alqahtani, M. S., Almubarak, H. A., Tergaonkar, V., Sethi, G., & Kunnumakkara, A. B. (2025) · Cancers · doi:10.3390/cancers18010143
Sekulovski, N., Kabir, M., Rengarajan, A., Carleton, A. E., Schmidt, J. K., Lin, C., & Taniguchi, K. (2026) · bioRxiv (Cold Spring Harbor Laboratory) · doi:10.64898/2026.02.10.705168
Li, X., & Eisen, M. B. (2026) · bioRxiv (Cold Spring Harbor Laboratory) · doi:10.64898/2026.02.23.707495
Assay for Transposase-Accessible Chromatin Sequencing (ATAC-seq) of Cancer Cells in Culture
Gura, K., Long, T., Takaku, M., Dhasarathy, A., & Manu (2026) · Methods in molecular biology · doi:10.1007/978-1-0716-5072-1_7
Self-citationKahlman, E. J. E. M., van der Zanden, N., Zatkova, E., Bos, C., Bacchetta, J., Belge, H., Bootsma-Robroeks, C. M., Brandi, M. L., Cambier, J., Colliou, É., et al. (2026) · Kidney International Reports · doi:10.1016/j.ekir.2026.107078
Moon, J.-I., Park, S. G., 윤희인, Yu, W., Lee, D., Ahn, S., Cho, Y., 우경미Woo, K. M., van Wijnen, A. J., Kim, K.-T., et al. (2026) · Cell Reports · doi:10.1016/j.celrep.2026.118020
Metadata
- Authors
- Takaku, M., Grimm, S. A., Shimbo, T., Perera, L., Menafra, R., Stunnenberg, H. G., Archer, T. K., Machida, S., Kurumizaka, H., & Wade, P. A.
- Affiliations
- National Institutes of Health (US)
- National Institute of Environmental Health Sciences (US)
- Radboud University Nijmegen (NL)
- Waseda University (JP)
- Corresponding author
- Wade, Paul A.
- ORCID
- Venue
- Genome Biology
- Published
- 2016-02-27
- Volume
- 17
- Issue
- 1
- Pages
- 36-36
- ISSN
- 1465-6906 (ISSN-L)
- 1474-760X
- PMC
- PMC4769547
- OpenAlex
- W2281053309
- Cited by
- 151
- References
- 69
- Citations by year
- 2026: 6 · 2025: 11 · 2024: 18 · 2023: 22 · 2022: 14 · 2021: 16 · 2020: 16 · 2019: 18 · 2018: 20 · 2017: 6 · 2016: 4
- FWCI
- 8.32
- Type
- journal article
- Language
- en
- Open access
- gold
- doi.org
- Locations
- Genome biology (publishedVersion, cc-by)
- Europe PMC (PubMed Central) (publishedVersion, cc-by)
- PubMed Central (publishedVersion, cc-by)
- PubMed (publishedVersion)
- Radboud Repository (Radboud University) (submittedVersion)
- Radboud Repository (Radboud University) (submittedVersion, other-oa)
- Funders
- National Institute of Environmental Health Sciences (ES101965, ES071006, ES043010)
- Ministry of Education, Culture, Sports, Science, and Technology (25116002)
- Japan Society for the Promotion of Science
- Topics
- Life Sciences › Biochemistry, Genetics and Molecular Biology › Molecular Biology › Genomics and Chromatin Dynamics
- Life Sciences › Biochemistry, Genetics and Molecular Biology › Molecular Biology › Chromatin Remodeling and Cancer
- Life Sciences › Biochemistry, Genetics and Molecular Biology › Molecular Biology › Epigenetics and DNA Methylation
- Keywords
- GATA3, pioneer transcription factors, cellular reprogramming, mesenchymal-epithelial transition, chromatin remodeling, SWI/SNF complex, SMARCA4, nucleosome eviction, nucleosome sliding, histone modifications, transactivation domain, breast cancer, chromatin accessibility
- MeSH terms
- Breast Neoplasms, Chromatin, Chromosomal Proteins, Non-Histone, Female, Humans, Nucleosomes, Transcription Factors, Chromatin Assembly and Disassembly, GATA3 Transcription Factor, Induced Pluripotent Stem Cells, Epithelial-Mesenchymal Transition, Cellular Reprogramming
About these checks
Registry, retraction, Cites and statistics results are computed, not judged, with one exception: a printed reference that no index lists is read once by a model before it counts as a citation error. Claims are extracted by a model and kept only when their quote appears verbatim in the text; each cited source is then checked, with a model’s help, for whether it says what the claim relies on. Those verdicts can be wrong — read the claim’s quote and the cited source before relying on one.
Statistics and arithmetic are recomputed, not judged.
Confidence bands are shown only for fields calibrated on our annotated test set. None is calibrated yet, so no band is shown.
What counts as a claim ›How we measure confidence ›How we check this ›
Are you an author, or do you see a problem with this page? Request a review
