

The DOI matches its Crossref record; 32 of the 32 references it cites were found in a registry or an index.
Predicting RNA splicing from DNA sequence using Pangolin
Open accessPublished version of a preprint
Abstract
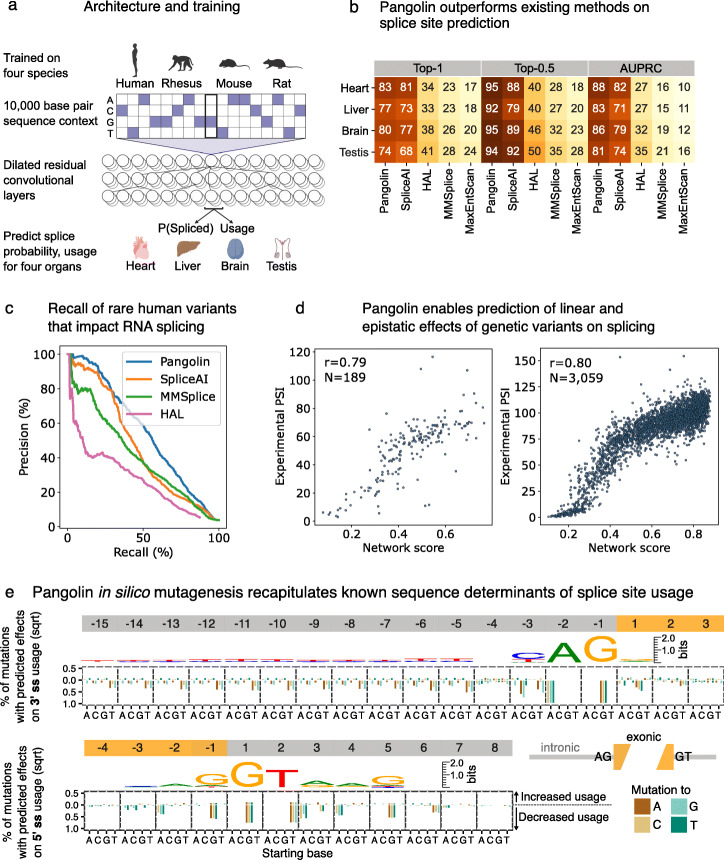
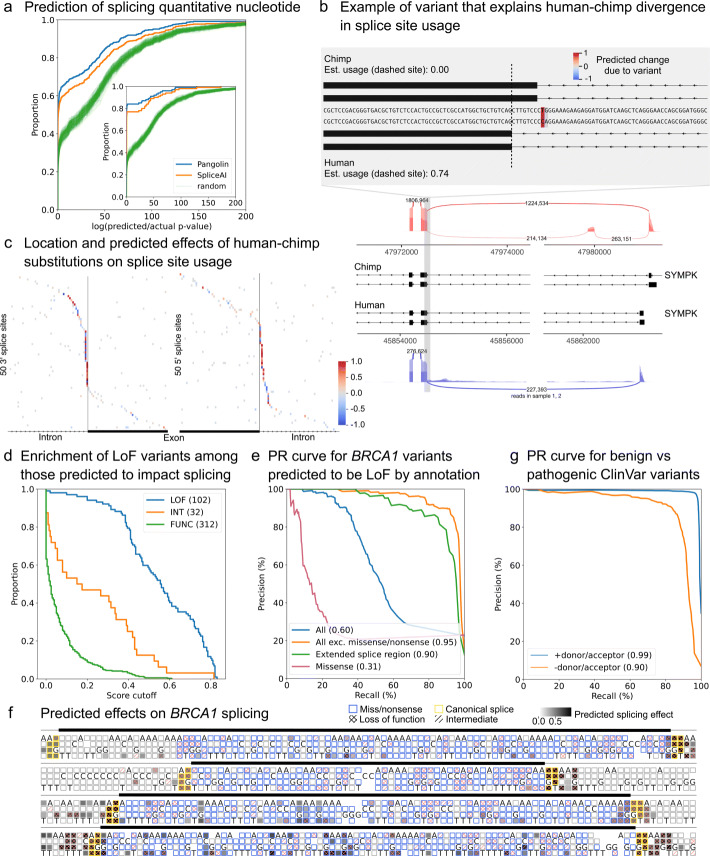
Recent progress in deep learning has greatly improved the prediction of RNA splicing from DNA sequence. Here, we present Pangolin, a deep learning model to predict splice site strength in multiple tissues. Pangolin outperforms state-of-the-art methods for predicting RNA splicing on a variety of prediction tasks. Pangolin improves prediction of the impact of genetic variants on RNA splicing, including common, rare, and lineage-specific genetic variation. In addition, Pangolin identifies loss-of-function mutations with high accuracy and recall, particularly for mutations that are not missense or nonsense, demonstrating remarkable potential for identifying pathogenic variants.
Overview
The claims and statistics of this paper haven’t been checked yet.
Run the check — free, no account needed. It reads the open-access text and checks the sources it cites.
Integrity signals
Registry
Cites
Statistics
Figures
Verification
Claims the paper makes
The claims and statistics of this paper haven’t been checked yet.
Run the check — free, no account needed. It reads the open-access text and checks the sources it cites.
Claims other papers make about this one
Each is checked against this paper’s own text: does it say what the citing paper says it does?
The source backs part of the claim, not all of it — or backs it for a different population, condition or comparison.
In the citing paper
“Similarly, sequence-based models of post-transcriptional regulation rely on genome annotations and transformed measurements extracted from RNA-seq to isolate each regulatory mechanism (for example, percent spliced-in for splicing)14–23.”
From Predicting RNA-seq coverage from DNA sequence as a unifying model of gene regulation (2025) · cites this paper as [16]
Experimental — accuracy not yet measuredThe cited source says what the claim attributes to it.
In the citing paper
“When comparing Borzoi to Pangolin16 for the task of classifying the causal sQTLs from matched negatives, Pangolin has a slight advantage (Fig. 7d–e and Supplementary Fig. 12c; dAUPRC = 0.01, evaluated on all SNPs within distances of ≤10,000 bp from an annotated splice site).”
From Predicting RNA-seq coverage from DNA sequence as a unifying model of gene regulation (2025) · cites this paper as [16]
The cited source says what the claim attributes to it.
In the citing paper
“Identifying splice sites in DNA sequences has formed the basis for a successful approach to interpreting the splicing code and prioritizing pathogenic splicing variants15,16.”
From Predicting RNA-seq coverage from DNA sequence as a unifying model of gene regulation (2025) · cites this paper as [16]
Self-check
Percentages, sums and reported differences re-computed from the paper’s own numbers.
The self-check needs the paper’s full text.
Citations
Cites
STAR: ultrafast universal RNA-seq aligner
Dobin, A., Davis, C. A., Schlesinger, F., Drenkow, J., Zaleski, C., Jha, S., Batut, P., Chaisson, M., & Gingeras, T. R. (2013) · Bioinformatics · doi:10.1093/bioinformatics/bts635 · Cited by 51,709
RSEM: accurate transcript quantification from RNA-Seq data with or without a reference genome
Li, B., & Dewey, C. N. (2011) · BMC Bioinformatics · doi:10.1186/1471-2105-12-323 · Cited by 22,179
Decoupled Weight Decay Regularization
Loshchilov, I., & Hutter, F. (2017) · arXiv · doi:10.48550/arxiv.1711.05101 · Cited by 12,522
The GTEx Consortium atlas of genetic regulatory effects across human tissues
The GTEx Consortium, Aguet, F., Anand, S., Ardlie, K. G., Gabriel, S., Getz, G. A., Graubert, A., Hadley, K., Handsaker, R. E., Huang, K. H., et al. (2020) · Science · doi:10.1126/science.aaz1776 · Cited by 5,547
ClinVar: improving access to variant interpretations and supporting evidence
Landrum, M. J., Lee, J. M., Benson, M., Brown, G. R., Chao, C., Chitipiralla, S., Gu, B., Hart, J., Hoffman, D., Jang, W., et al. (2018) · Nucleic Acids Research · doi:10.1093/nar/gkx1153 · Cited by 4,196
Predicting splicing from primary sequence with deep learning
Jaganathan, K., Kyriazopoulou Panagiotopoulou, S., McRae, J. F., Darbandi, S. F., Knowles, D., Li, Y. I., Kosmicki, J. A., Arbelaez, J., Cui, W., Schwartz, G. B., et al. (2019) · Cell · doi:10.1016/j.cell.2018.12.015 · Cited by 2,853
Self-citationMaximum Entropy Modeling of Short Sequence Motifs with Applications to RNA Splicing Signals
Yeo, G. W.-M., & Burge, C. B. (2004) · Journal of Computational Biology · doi:10.1089/1066527041410418 · Cited by 2,042
Liftoff: accurate mapping of gene annotations
Shumate, A., & Salzberg, S. L. (2020) · Bioinformatics · doi:10.1093/bioinformatics/btaa1016 · Cited by 991
Accurate classification of BRCA1 variants with saturation genome editing
Findlay, G. M., Daza, R. M., Martin, B., Zhang, M. D., Leith, A. P., Gasperini, M., Janizek, J. D., Huang, X., Starita, L. M., & Shendure, J. (2018) · Nature · doi:10.1038/s41586-018-0461-z · Cited by 843
Gene expression across mammalian organ development
Cardoso-Moreira, M., Halbert, J., Valloton, D., Velten, B., Chen, C., Shao, Y., Liechti, A., Ascenção, K., Rummel, C., Ovchinnikova, S., et al. (2019) · Nature · doi:10.1038/s41586-019-1338-5 · Cited by 838
Cited by
Sorted by citations
AlphaGenome: advancing regulatory variant effect prediction with a unified DNA sequence model
Avsec, Ž., Latysheva, N., Cheng, J., Novati, G., Taylor, K. R., Ward, T., Bycroft, C., Nicolaisen, L., Arvaniti, E., Pan, J., et al. (2025) · doi:10.1101/2025.06.25.661532 · Cited by 395
Advancing regulatory variant effect prediction with AlphaGenome
Avsec, Ž., Latysheva, N., Cheng, J., Novati, G., Taylor, K. R., Ward, T., Bycroft, C., Nicolaisen, L., Arvaniti, E., Pan, J., et al. (2026) · Nature · doi:10.1038/s41586-025-10014-0 · Cited by 373
“…outcomes can be modelled at three levels: the probability that any given nucleotide acts as a splice donor or acceptor (splice site prediction) 4,11,16 , competitive selection among potential splice sites (splice site usage prediction) 11,16 and prediction of specific introns (splice junction…”
Regulation of pre-mRNA splicing: roles in physiology and disease, and therapeutic prospects
Rogalska, M. E., Vivori, C., & Valcárcel, J. (2022) · Nature Reviews Genetics · doi:10.1038/s41576-022-00556-8 · Cited by 284
Predicting RNA-seq coverage from DNA sequence as a unifying model of gene regulation
Linder, J., Srivastava, D., Yuan, H., Agarwal, V., & Kelley, D. R. (2025) · Nature Genetics · doi:10.1038/s41588-024-02053-6 · Cited by 265
SpliceAI-visual: a free online tool to improve SpliceAI splicing variant interpretation
Agathe, J. D. S., Filser, M., Isidor, B., Besnard, T., Guéguen, P., Perrin, A., Goethem, C. V., Verebi, C., Masingue, M., Rendu, J., et al. (2023) · Human Genomics · doi:10.1186/s40246-023-00451-1 · Cited by 201
Metadata
- Authors
- Zeng, T., & Li, Y. I.
- Affiliations
- University of Chicago (US)
- Corresponding author
- Li, Yang I
- ORCID
- Venue
- Genome Biology
- Published
- 2022-04-21
- Volume
- 23
- Issue
- 1
- Pages
- 103-103
- ISSN
- 1465-6906 (ISSN-L)
- 1474-760X
- PMC
- PMC9022248
- OpenAlex
- W4226065462
- Cited by
- 283
- References
- 32
- Citations by year
- 2026: 100 · 2025: 96 · 2024: 56 · 2023: 27 · 2022: 4
- FWCI
- 14.94
- Type
- journal article
- Language
- en
- Open access
- gold
- doi.org
- Locations
- Genome biology (publishedVersion, cc-by)
- bioRxiv (Cold Spring Harbor Laboratory) (acceptedVersion, cc-by-nc)
- PubMed Central (publishedVersion, cc-by)
- PubMed (publishedVersion)
- DOAJ (DOAJ: Directory of Open Access Journals) (submittedVersion, cc-by-sa)
- Funders
- national institute of general medical sciences (R01GM130738)
- Topics
- Life Sciences › Biochemistry, Genetics and Molecular Biology › Molecular Biology › RNA Research and Splicing
- Life Sciences › Biochemistry, Genetics and Molecular Biology › Genetics › Genomics and Rare Diseases
- Life Sciences › Biochemistry, Genetics and Molecular Biology › Molecular Biology › Genomics and Phylogenetic Studies
- Keywords
- splice site strength, pangolins, deep learning, genetic variants, variant effect prediction, loss-of-function mutations, pathogenic variant identification, tissue-specific splicing
- MeSH terms
- Pangolins, Animals, Base Sequence, Mutation, RNA Splicing, RNA Splice Sites
About these checks
Registry, retraction, Cites and statistics results are computed, not judged, with one exception: a printed reference that no index lists is read once by a model before it counts as a citation error. Claims are extracted by a model and kept only when their quote appears verbatim in the text; each cited source is then checked, with a model’s help, for whether it says what the claim relies on. Those verdicts can be wrong — read the claim’s quote and the cited source before relying on one.
Statistics and arithmetic are recomputed, not judged.
Confidence bands are shown only for fields calibrated on our annotated test set. None is calibrated yet, so no band is shown.
What counts as a claim ›How we measure confidence ›How we check this ›
Are you an author, or do you see a problem with this page? Request a review
