

The DOI matches its Crossref record; 88 of the 89 references it cites were found in a registry or an index, and 1 are not checked yet.
A bioinformatic framework for immune repertoire diversity profiling enables detection of immunological status
Open accessAbstract
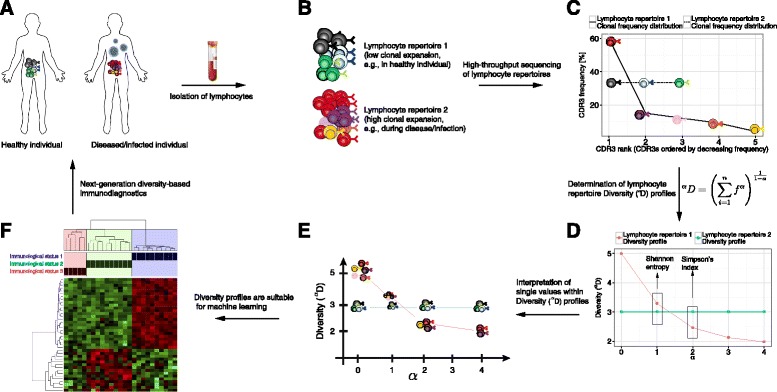
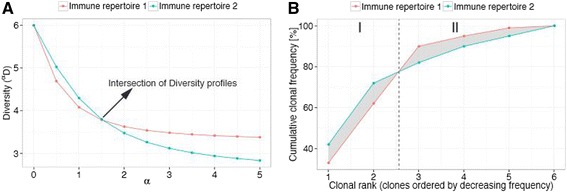
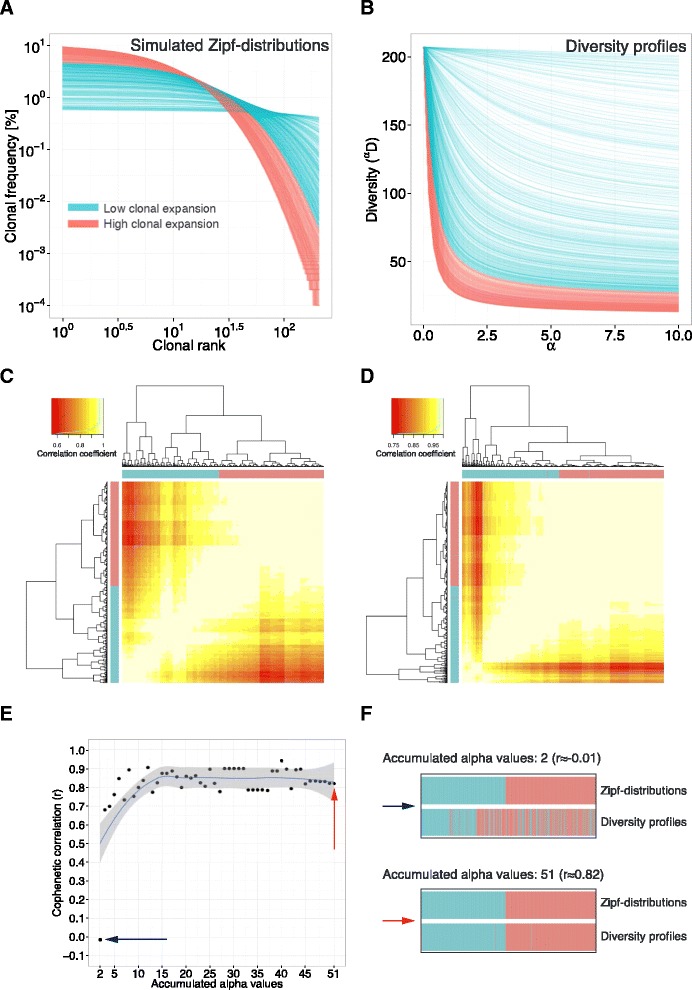
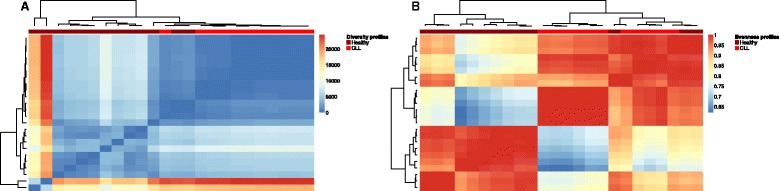
BACKGROUND: Lymphocyte receptor repertoires are continually shaped throughout the lifetime of an individual in response to environmental and pathogenic exposure. Thus, they may serve as a fingerprint of an individual's ongoing immunological status (e.g., healthy, infected, vaccinated), with far-reaching implications for immunodiagnostics applications. The advent of high-throughput immune repertoire sequencing now enables the interrogation of immune repertoire diversity in an unprecedented and quantitative manner. However, steadily increasing sequencing depth has revealed that immune repertoires vary greatly among individuals in their composition; correspondingly, it has been reported that there are few shared sequences indicative of immunological status ('public clones'). Disconcertingly, this means that the wealth of information gained from repertoire sequencing remains largely unused for determining the current status of immune responses, thereby hampering the implementation of immune-repertoire-based diagnostics. METHODS: Here, we introduce a bioinformatics repertoire-profiling framework that possesses the advantage of capturing the diversity and distribution of entire immune repertoires, as opposed to singular public clones. The framework relies on Hill-based diversity profiles composed of a continuum of single diversity indices, which enable the quantification of the extent of immunological information contained in immune repertoires. RESULTS: We coupled diversity profiles with unsupervised (hierarchical clustering) and supervised (support vector machine and feature selection) machine learning approaches in order to correlate patients' immunological statuses with their B- and T-cell repertoire data. We could predict with high accuracy (greater than or equal to 80 %) a wide range of immunological statuses such as healthy, transplantation recipient, and lymphoid cancer, suggesting as a proof of principle that diversity profiling can recover a large amount of immunodiagnostic fingerprints from immune repertoire data. Our framework is highly scalable as it easily allowed for the analysis of 1000 simulated immune repertoires; this exceeds the size of published immune repertoire datasets by one to two orders of magnitude. CONCLUSIONS: Our framework offers the possibility to advance immune-repertoire-based fingerprinting, which may in the future enable a systems immunogenomics approach for vaccine profiling and the accurate and early detection of disease and infection.
Overview
The claims and statistics of this paper haven’t been checked yet.
Run the check — free, no account needed. It reads the open-access text and checks the sources it cites.
Integrity signals
Registry
Cites
Statistics
Figures
Verification
Claims the paper makes
The claims and statistics of this paper haven’t been checked yet.
Run the check — free, no account needed. It reads the open-access text and checks the sources it cites.
Claims other papers make about this one
Each is checked against this paper’s own text: does it say what the citing paper says it does?
In the citing paper
“It was demonstrated that statistical classifiers can identify immune profiles of patients with chronic lymphocytic leukemia [220], multiple sclerosis [221] or influenza [222] from NGS data alone.”
From Computational approaches to therapeutic antibody design: established methods and emerging trends (2020) · cites this paper as [220]
Self-check
Percentages, sums and reported differences re-computed from the paper’s own numbers.
The self-check needs the paper’s full text.
Citations
Cites
R: A Language and Environment for Statistical Computing
R Core Team (2000) · doi:10.32614/r.manuals · Cited by 355,893
A Mathematical Theory of Communication
Shannon, C. E. (1948) · Bell System Technical Journal · doi:10.1002/j.1538-7305.1948.tb01338.x · Cited by 88,486
A Mathematical Theory of Communication
Shannon, C. E. (1948) · The MIT Press eBooks · doi:10.1002/j.1538-7305.1948.tb00917.x · Cited by 50,387
A mathematical theory of communication
Hockett, C. F., Shannon, C., & Weaver, W. (1948) · MOCO · doi:10.1145/584091.584093 · Cited by 30,543
Simpson, E. (1949) · Nature · doi:10.1038/163688a0 · Cited by 14,809
Gotelli, N., & Colwell, R. K. (2001) · Ecology Letters · doi:10.1046/j.1461-0248.2001.00230.x · Cited by 6,529
Diversity and Evenness: A Unifying Notation and Its Consequences
Hill, M. (1973) · Ecology · doi:10.2307/1934352 · Cited by 6,486
Jost, L. (2006) · Oikos · doi:10.1111/j.2006.0030-1299.14714.x · Cited by 4,669
On Measures of Entropy and Information
Rényi, A. (1961) · Project Euclid (Cornell University) · Cited by 4,031
Cellular and Molecular Immunology
Abbas, A. K., Lichtman, A. H., & Pillai, S. S. (1994) · Cited by 3,571
Research works printed but not linked: 4
- Janeway C, Shlomchik MJ, Walport M. Immunobiology. 6th ed. New York: Garland Science; 2004.
- Evert S, Baroni M. zipfR: Word frequency distributions in R. In: Proceedings of the 45th Annual Meeting of the Association for Computational Linguistics, Posters and Demonstrations Sessions. Prague, Czech Republic: Association for Computational Linguistics; 2007. p. 29–32.
- de Vries A, Ripley BD. Ggdendro: tools for extracting dendrogram and tree diagram plot data for use with ggplot. 2013.
- Galili T. Dendextend: extending R’s dendrogram functionality. 2014.
Cited by
Sorted by citations
Intratumoral plasma cells predict outcomes to PD-L1 blockade in non-small cell lung cancer
Patil, N. S., Nabet, B. Y., Müller, S., Koeppen, H., Zou, W., Giltnane, J. M., Au‐Yeung, A., Srivats, S., Cheng, J. H., Takahashi, C., et al. (2022) · Cancer Cell · doi:10.1016/j.ccell.2022.02.002 · Cited by 423
Overview of methodologies for T-cell receptor repertoire analysis
Rosati, E., Dowds, C. M., Liaskou, E., Henriksen, E. K. K., Karlsen, T. H., & Franke, A. (2017) · BMC Biotechnology · doi:10.1186/s12896-017-0379-9 · Cited by 322
Kovaltsuk, A., Leem, J., Kelm, S., Snowden, J., Deane, C. M., & Krawczyk, K. (2018) · The Journal of Immunology · doi:10.4049/jimmunol.1800708 · Cited by 247
Methods and Applications of CRISPR-Mediated Base Editing in Eukaryotic Genomes
Hess, G. T., Tycko, J., Yao, D., & Bassik, M. C. (2017) · Molecular Cell · doi:10.1016/j.molcel.2017.09.029 · Cited by 234
Practical guidelines for B-cell receptor repertoire sequencing analysis
Yaari, G., & Kleinstein, S. H. (2015) · Genome Medicine · doi:10.1186/s13073-015-0243-2 · Cited by 224
Metadata
- Authors
- Greiff, V., Bhat, P., Cook, S. C., Menzel, U., Kang, W., & Reddy, S. T.
- Affiliations
- ETH Zurich (CH)
- Corresponding author
- Reddy, Sai T.
- Venue
- Genome Medicine
- Published
- 2015-05-28
- Volume
- 7
- Issue
- 1
- Pages
- 49-49
- ISSN
- 1756-994X (ISSN-L)
- PMC
- PMC4489130
- OpenAlex
- W1483854882
- Cited by
- 181
- References
- 89
- Citations by year
- 2026: 14 · 2025: 14 · 2024: 25 · 2023: 11 · 2022: 23 · 2021: 15 · 2020: 21 · 2019: 15 · 2018: 18 · 2017: 13 · 2016: 8 · 2015: 3
- FWCI
- 7.07
- Type
- journal article
- Language
- en
- Open access
- gold
- doi.org
- Locations
- Genome Medicine (publishedVersion, cc-by)
- Europe PMC (PubMed Central) (publishedVersion, cc-by)
- PubMed Central (publishedVersion, cc-by)
- PubMed (publishedVersion)
- Repository for Publications and Research Data (ETH Zurich) (submittedVersion, cc-by)
- ETH Zürich Research Collection (cc-by)
- Funders
- National Science Foundation
- Schweizerischer Nationalfonds zur Förderung der Wissenschaftlichen Forschung
- Eidgenössische Technische Hochschule Zürich
- SystemsX.ch
- Topics
- Life Sciences › Immunology and Microbiology › Immunology › T-cell and B-cell Immunology
- Life Sciences › Biochemistry, Genetics and Molecular Biology › Molecular Biology › vaccines and immunoinformatics approaches
- Physical Sciences › Computer Science › Artificial Intelligence › Artificial Immune Systems Applications
- Keywords
- immune repertoire diversity, immune status, immunodiagnosis, B cell receptor repertoire, T cell receptor repertoire, disease detection
About these checks
Registry, retraction, Cites and statistics results are computed, not judged, with one exception: a printed reference that no index lists is read once by a model before it counts as a citation error. Claims are extracted by a model and kept only when their quote appears verbatim in the text; each cited source is then checked, with a model’s help, for whether it says what the claim relies on. Those verdicts can be wrong — read the claim’s quote and the cited source before relying on one.
Statistics and arithmetic are recomputed, not judged.
Confidence bands are shown only for fields calibrated on our annotated test set. None is calibrated yet, so no band is shown.
What counts as a claim ›How we measure confidence ›How we check this ›
Are you an author, or do you see a problem with this page? Request a review
