

The DOI matches its Crossref record; 64 of the 65 references it cites were found in a registry or an index.
Microglia prevent beta-amyloid plaque formation in the early stage of an Alzheimer’s disease mouse model with suppression of glymphatic clearance
Open accessPublished version of a preprint
Abstract
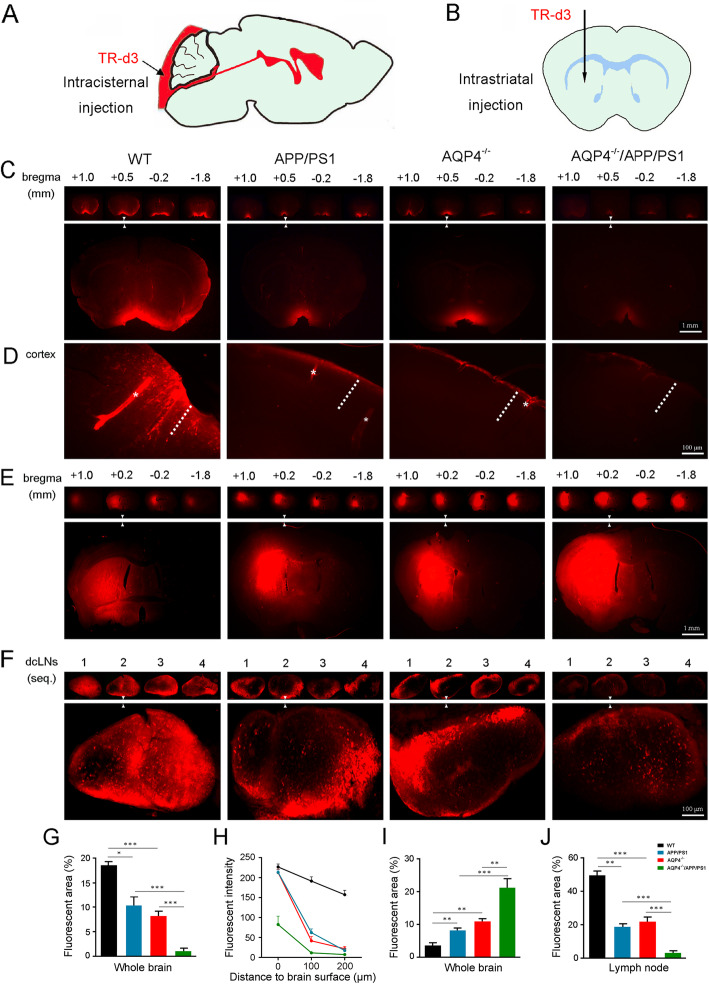
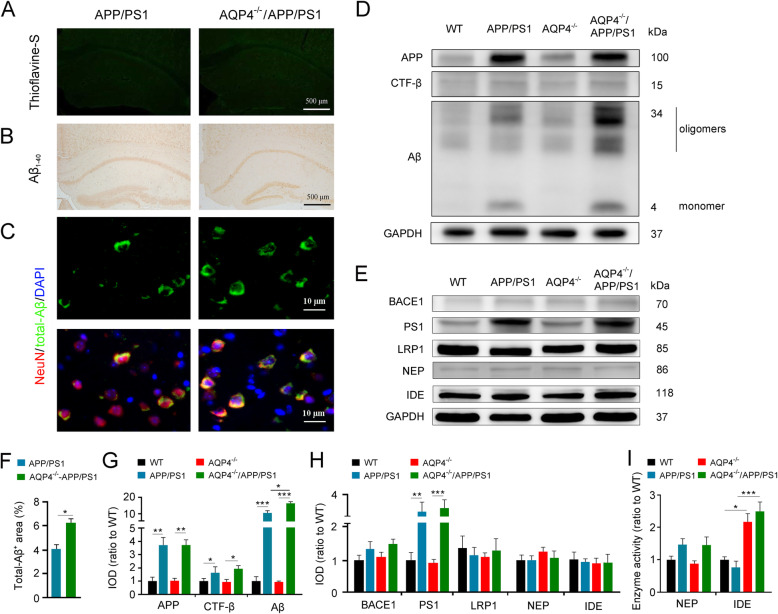
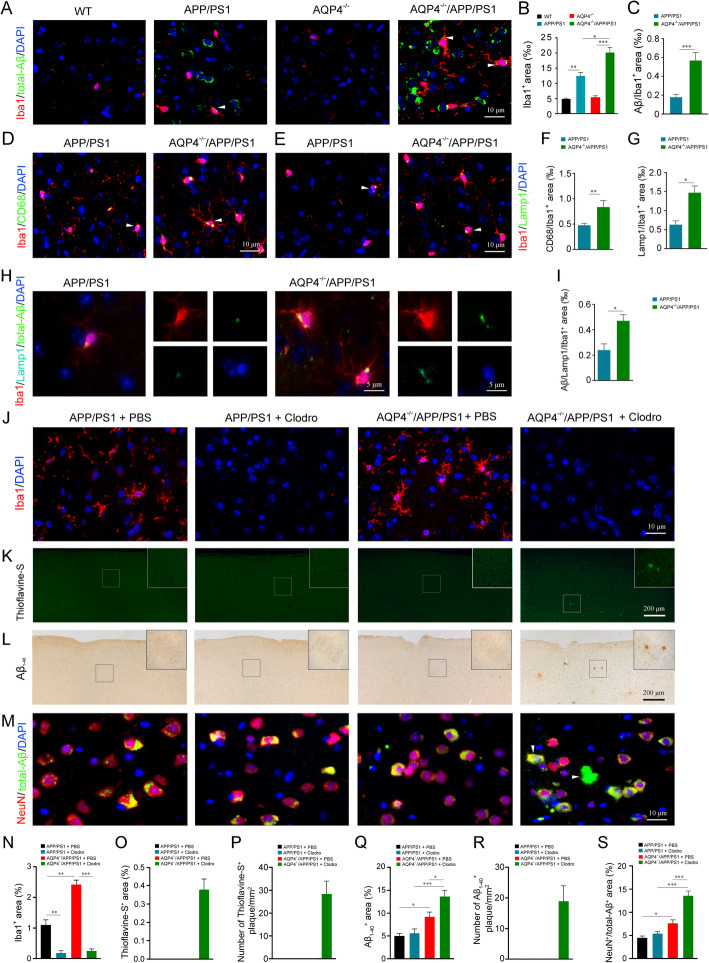
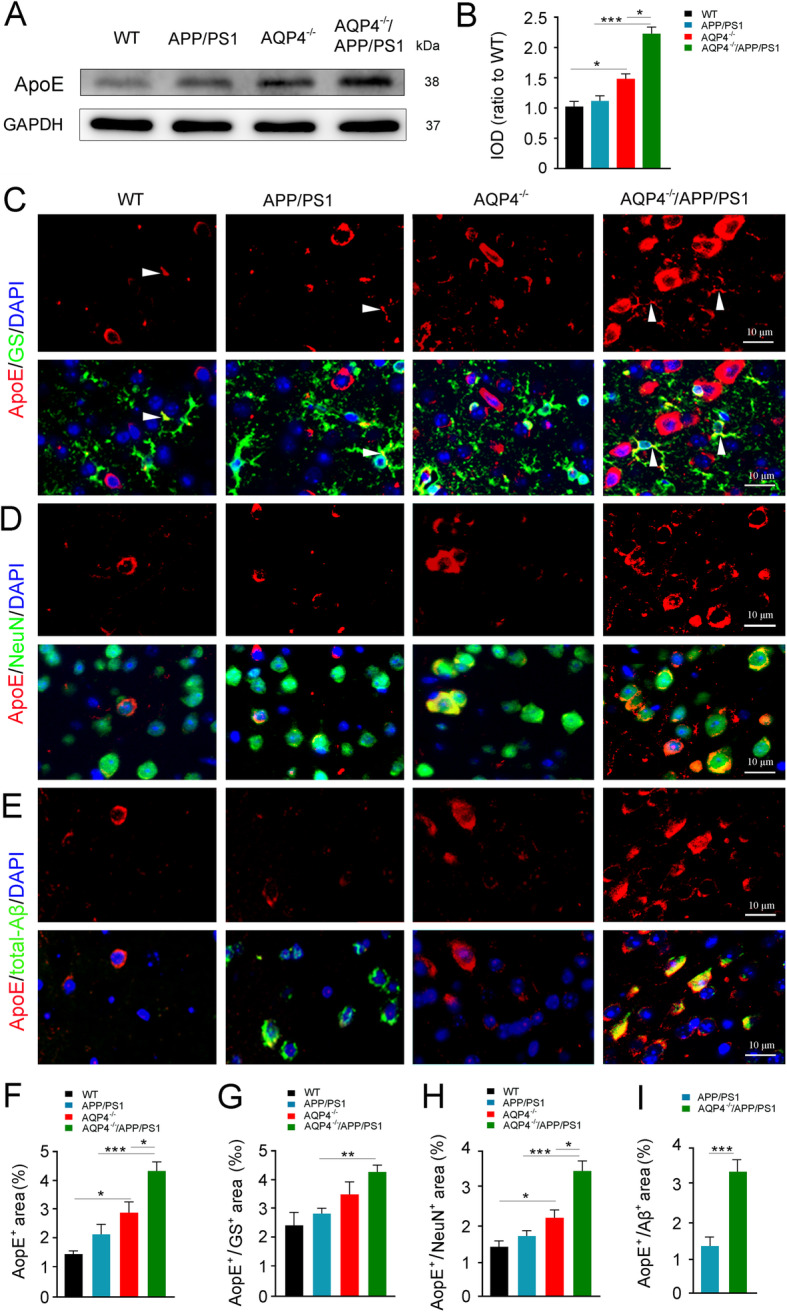
Background: Soluble beta-amyloid (Aβ) can be cleared from the brain through various mechanisms including enzymatic degradation, glial cell phagocytosis, transport across the blood-brain barrier, and glymphatic clearance. However, the relative contribution of each clearance system and their compensatory effects in delaying the pathological process of Alzheimer’s disease (AD) are currently unknown. Methods: Fluorescent trace, immunofluorescence, and Western blot analyses were performed to compare glymphatic clearance ability and Aβ accumulation among 3-month-old APP695/PS1-dE9 transgenic (APP/PS1) mice, wild-type mice, aquaporin 4 knock out (AQP4 −/− ) mice, and AQP4 −/− /APP/PS1 mice. The consequence of selectively eliminating microglial cells, or downregulating apolipoprotein E (apoE) expression, on Aβ burden, was also investigated in the frontal cortex of AQP4 −/− /APP/PS1 mice and APP/PS1 mice. Results: AQP4 deletion in APP/PS1 mice significantly exaggerated glymphatic clearance dysfunction, and intraneuronal accumulation of Aβ and apoE, although it did not lead to Aβ plaque deposition. Notably, microglia, but not astrocytes, increased activation and phagocytosis of Aβ in the cerebral cortex of AQP4 −/− /APP/PS1 mice, compared with APP/PS1 mice. Selectively eliminating microglia in the frontal cortex via local injection of clodronate liposomes resulted in deposition of Aβ plaques in AQP4 −/− /APP/PS1 mice, but not APP/PS1 mice. Moreover, knockdown of apoE reduced intraneuronal Aβ levels in both APP/PS1 mice and AQP4 −/− /APP/PS1 mice, indicating an inhibitory effect of apoE on Aβ clearance. Conclusion: The above results suggest that the glymphatic system mediated Aβ and apoE clearance and microglia mediated Aβ degradation synergistically prevent Aβ plague formation in the early stages of the AD mouse model. Protecting one or both of them might be beneficial to delaying the onset of AD.
Overview
The claims and statistics of this paper haven’t been checked yet.
Run the check — free, no account needed. It reads the open-access text and checks the sources it cites.
Integrity signals
Registry
Cites
Statistics
Figures
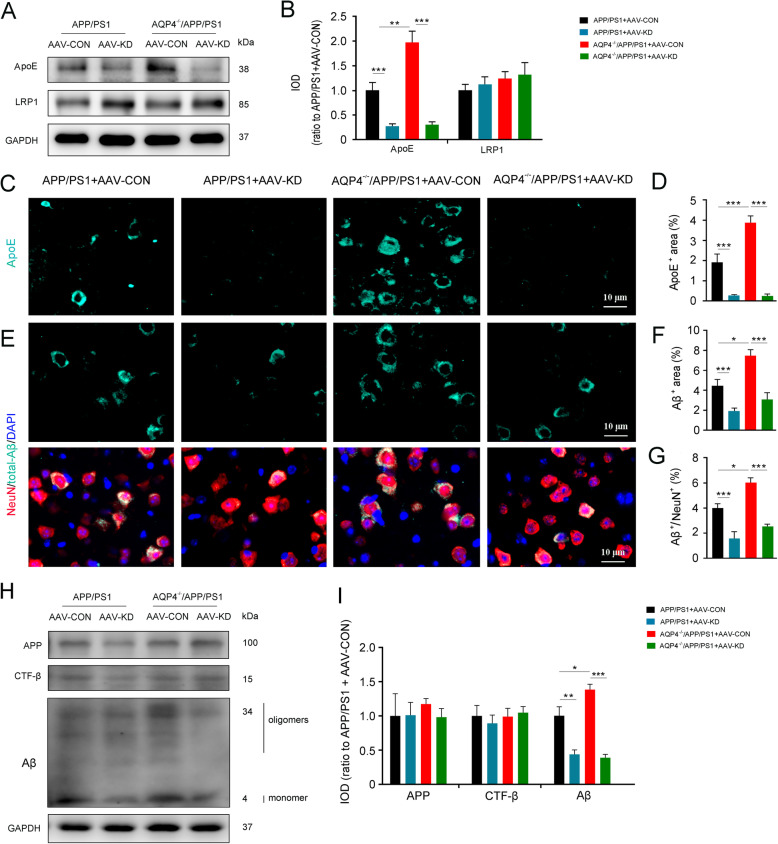
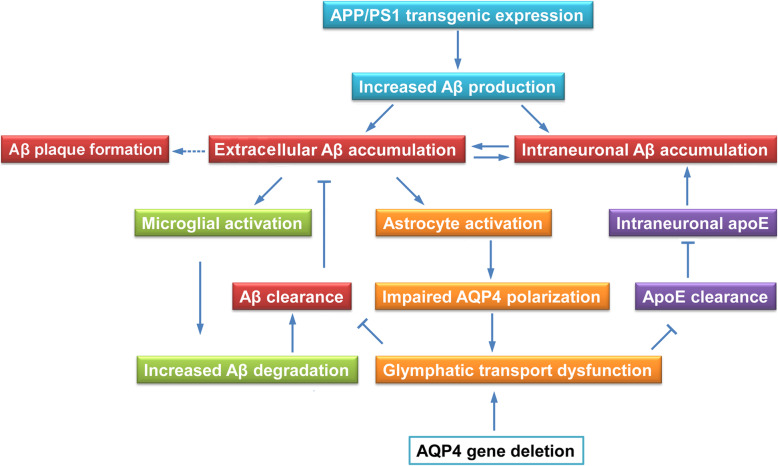
Verification
Claims the paper makes
The claims and statistics of this paper haven’t been checked yet.
Run the check — free, no account needed. It reads the open-access text and checks the sources it cites.
Claims other papers make about this one
Each is checked against this paper’s own text: does it say what the citing paper says it does?
In the citing paper
“In the early stages of AD, activated microglia cause phagocytosis and clearance of pathologic Aβ and/or tau, positively affecting AD pathologies in animal models [89, 90].”
From Tau and neuroinflammation in Alzheimer’s disease: interplay mechanisms and clinical translation (2023) · cites this paper as [90]
Self-check
Percentages, sums and reported differences re-computed from the paper’s own numbers.
The self-check needs the paper’s full text.
Citations
Cites
The amyloid hypothesis of Alzheimer's disease at 25 years
Selkoe, D. J., & Hardy, J. (2016) · EMBO Molecular Medicine · doi:10.15252/emmm.201606210 · Cited by 6,164
Iliff, J. J., Wang, M., Liao, Y., Plogg, B. A., Peng, W., Gundersen, G. A., Benveniste, H., Vates, G. E., Deane, R., Goldman, S. A., et al. (2012) · Science Translational Medicine · doi:10.1126/scitranslmed.3003748 · Cited by 5,824
Structural and functional features of central nervous system lymphatic vessels
Louveau, A., Smirnov, I., Keyes, T. J., Eccles, J. D., Rouhani, S. J., Peske, J. D., Derecki, N. C., Castle, D., Mandell, J. W., Lee, K. S., et al. (2015) · Nature · doi:10.1038/nature14432 · Cited by 4,413
Oakley, H., Cole, S. L., Logan, S., Maus, E., Shao, P., Craft, J., Guillozet-Bongaarts, A., Ohno, M., Disterhoft, J., Van Eldik, L., et al. (2006) · The Journal of Neuroscience · doi:10.1523/jneurosci.1202-06.2006 · Cited by 3,530
A dural lymphatic vascular system that drains brain interstitial fluid and macromolecules
Aspelund, A., Antila, S., Proulx, S. T., Karlsen, T. V., Karaman, S., Detmar, M., Wiig, H., & Alitalo, K. (2015) · Journal of Experimental Medicine · doi:10.1084/jem.20142290 · Cited by 2,198
Decreased Clearance of CNS β-Amyloid in Alzheimer’s Disease
Mawuenyega, K. G., Sigurdson, W., Ovod, V., Munsell, L., Kasten, T., Morris, J. C., Yarasheski, K. E., & Bateman, R. J. (2010) · Science · doi:10.1126/science.1197623 · Cited by 2,078
The Cellular Phase of Alzheimer’s Disease
De Strooper, B., & Karran, E. (2016) · Cell · doi:10.1016/j.cell.2015.12.056 · Cited by 1,990
Clearance systems in the brain—implications for Alzheimer disease
Tarasoff-Conway, J. M., Carare, R. O., Osorio, R. S., Glodzik, L., Butler, T., Fieremans, E., Axel, L., Rusinek, H., Nicholson, C., Zlokovic, B. V., et al. (2015) · Nature Reviews Neurology · doi:10.1038/nrneurol.2015.119 · Cited by 1,678
Impairment of paravascular clearance pathways in the aging brain
Kress, B. T., Iliff, J. J., Xia, M., Wang, M., Wei, H. S., Zeppenfeld, D., Xie, L., Kang, H., Xu, Q., Liew, J. A., et al. (2014) · Annals of Neurology · doi:10.1002/ana.24271 · Cited by 1,521
Functional aspects of meningeal lymphatics in ageing and Alzheimer’s disease
Da Mesquita, S., Louveau, A., Vaccari, A., Smirnov, I., Cornelison, R. C., Kingsmore, K. M., Contarino, C., Onengut-Gumuscu, S., Farber, E., Raper, D., et al. (2018) · Nature · doi:10.1038/s41586-018-0368-8 · Cited by 1,445
Nielsen, S. M., Nagelhus, E. A., Amiry-Moghaddam, M. R., Bourque, C. W., Agre, P. C., & Ottersen, O. P. (1997) · Journal of Neuroscience · doi:10.1523/jneurosci.17-01-00171.1997 · Cited by 1,440
Apolipoprotein E and Alzheimer disease: pathobiology and targeting strategies
Yamazaki, Y., Zhao, N., Caulfield, T. R., Liu, C.-C., & Bu, G. (2019) · Nature Reviews Neurology · doi:10.1038/s41582-019-0228-7 · Cited by 1,425
Taoka, T., Masutani, Y., Kawai, H., Nakane, T., Matsuoka, K., Yasuno, F., Kishimoto, T., & Naganawa, S. (2017) · Japanese Journal of Radiology · doi:10.1007/s11604-017-0617-z · Cited by 1,224
ApoE4 markedly exacerbates tau-mediated neurodegeneration in a mouse model of tauopathy
Initiative, A. D. N., Shi, Y., Yamada, K., Liddelow, S. A., Smith, S. T., Zhao, L., Luo, W., Tsai, R. M., Spina, S., Grinberg, L. T., et al. (2017) · Nature · doi:10.1038/nature24016 · Cited by 1,220
Impairment of Glymphatic Pathway Function Promotes Tau Pathology after Traumatic Brain Injury
Iliff, J. J., Chen, M. J., Plog, B. A., Zeppenfeld, D. M., Soltero, M., Yang, L., Singh, I., Deane, R., & Nedergaard, M. (2014) · The Journal of Neuroscience · doi:10.1523/jneurosci.3020-14.2014 · Cited by 1,159
Brain-wide pathway for waste clearance captured by contrast-enhanced MRI
Iliff, J. J., Lee, H., Yu, M., Feng, T., Logan, J., Nedergaard, M., & Benveniste, H. (2013) · Journal of Clinical Investigation · doi:10.1172/jci67677 · Cited by 1,148
Lack of apolipoprotein E dramatically reduces amyloid β-peptide deposition
Bales, K. R., Verina, T., Dodel, R. C., Du, Y., Altstiel, L., Bender, M., Hyslop, P., Johnstone, E. M., Little, S. P., Cummins, D. J., et al. (1997) · Nature Genetics · doi:10.1038/ng1197-263 · Cited by 830
Insulin-degrading Enzyme Regulates Extracellular Levels of Amyloid β-Protein by Degradation
Qiu, W. Q., Walsh, D. M., Ye, Z., Vekrellis, K., Zhang, J., Podlisny, M. B., Rosner, M. R., Safavi, A., Hersh, L. B., & Selkoe, D. J. (1998) · Journal of Biological Chemistry · doi:10.1074/jbc.273.49.32730 · Cited by 812
Co-expression of multiple transgenes in mouse CNS: a comparison of strategies
Jankowsky, J. L., Slunt, H. H., Ratovitski, T., Jenkins, N. A., Copeland, N. G., & Borchelt, D. R. (2001) · Biomolecular Engineering · doi:10.1016/s1389-0344(01)00067-3 · Cited by 746
Aquaporin-4-dependent glymphatic solute transport in the rodent brain
Mestre, H., Hablitz, L. M., Xavier, A. L., Feng, W., Zou, W., Pu, T., Monai, H., Murlidharan, G., Castellanos Rivera, R. M., Simon, M. J., et al. (2018) · eLife · doi:10.7554/elife.40070 · Cited by 738
Self-citationZeppenfeld, D. M., Simon, M., Haswell, J. D., D’Abreo, D., Murchison, C., Quinn, J. F., Grafe, M. R., Woltjer, R. L., Kaye, J., & Iliff, J. J. (2017) · JAMA Neurology · doi:10.1001/jamaneurol.2016.4370 · Cited by 651
ApoE and Aβ in Alzheimer’s Disease: Accidental Encounters or Partners?
Kanekiyo, T., Xu, H., & Bu, G. (2014) · Neuron · doi:10.1016/j.neuron.2014.01.045 · Cited by 608
Self-citationSuppression of glymphatic fluid transport in a mouse model of Alzheimer's disease
Peng, W., Achariyar, T. M., Li, B., Liao, Y., Mestre, H., Hitomi, E., Regan, S., Kasper, T., Peng, S., Ding, F., et al. (2016) · Neurobiology of Disease · doi:10.1016/j.nbd.2016.05.015 · Cited by 580
ApoE2, ApoE3, and ApoE4 Differentially Stimulate APP Transcription and Aβ Secretion
Huang, Y.-W. A., Zhou, B., Wernig, M., & Südhof, T. C. (2017) · Cell · doi:10.1016/j.cell.2016.12.044 · Cited by 528
Activation of microglia and astrocytes: a roadway to neuroinflammation and Alzheimer’s disease
Kaur, D., Sharma, V., & Deshmukh, R. R. (2019) · Inflammopharmacology · doi:10.1007/s10787-019-00580-x · Cited by 503
Deletion of aquaporin-4 in APP/PS1 mice exacerbates brain Aβ accumulation and memory deficits
Xu, Z., Xiao, N., Chen, Y., Huang, H., Marshall, C., Gao, J., Cai, Z., Wu, T., Hu, G., & Xiao, M. (2015) · Molecular Neurodegeneration · doi:10.1186/s13024-015-0056-1 · Cited by 500
Self-citationClearance of Alzheimer's Aβ Peptide
Tanzi, R. E., Moir, R. D., & Wagner, S. L. (2004) · Neuron · doi:10.1016/j.neuron.2004.08.024 · Cited by 446
Progressive age‐related development of Alzheimer‐like pathology in APP/PS1 mice
Trinchese, F., Liu, S., Battaglia, F., Walter, S., Mathews, P. M., & Arancio, O. (2004) · Annals of Neurology · doi:10.1002/ana.20101 · Cited by 384
Smith, A. J., Yao, X., Dix, J. A., Jin, B.-J., & Verkman, A. S. (2017) · eLife · doi:10.7554/elife.27679 · Cited by 362
Intraneuronal Aβ accumulation and origin of plaques in Alzheimer's disease
Gouras, G. K., Almeida, C. G., & Takahashi, R. H. (2005) · Neurobiology of Aging · doi:10.1016/j.neurobiolaging.2005.05.022 · Cited by 338
APOE ε4: The most prevalent yet understudied risk factor for Alzheimer's disease
Michaelson, D. M. (2014) · Alzheimer's & Dementia · doi:10.1016/j.jalz.2014.06.015 · Cited by 331
Clearance of cerebral Aβ in Alzheimer’s disease: reassessing the role of microglia and monocytes
Zuroff, L. R., Daley, D. A., Black, K. L., & Koronyo‐Hamaoui, M. (2017) · Cellular and Molecular Life Sciences · doi:10.1007/s00018-017-2463-7 · Cited by 292
Astrocytic LRP1 Mediates Brain Aβ Clearance and Impacts Amyloid Deposition
Liu, C.-C., Hu, J., Zhao, N., Wang, J., Wang, N., Cirrito, J. R., Kanekiyo, T., Holtzman, D. M., & Bu, G. (2017) · The Journal of Neuroscience · doi:10.1523/jneurosci.3442-16.2017 · Cited by 267
Achariyar, T. M., Li, B., Peng, W., Verghese, P. B., Shi, Y., McConnell, E., Benraiss, A., Kasper, T., Song, W., Takano, T., et al. (2016) · Molecular Neurodegeneration · doi:10.1186/s13024-016-0138-8 · Cited by 256
Genetic mouse models of brain ageing and Alzheimer's disease
Bilkei‐Gorzó, A. (2013) · Pharmacology & Therapeutics · doi:10.1016/j.pharmthera.2013.12.009 · Cited by 253
Intraneuronal Aβ-Amyloid Precedes Development of Amyloid Plaques in Down Syndrome
Gyure, K. A., Durham, R., Stewart, W. F., Smialek, J. E., & Troncoso, J. C. (2001) · Archives of Pathology & Laboratory Medicine · doi:10.5858/2001-125-0489-iaapdo · Cited by 248
Deep cervical lymph node ligation aggravates AD‐like pathology of APP/PS1 mice
Wang, L., Zhang, Y., Zhao, Y., Marshall, C., Wu, T., & Xiao, M. (2019) · Brain Pathology · doi:10.1111/bpa.12656 · Cited by 199
Self-citationClearance of amyloid β-peptide from brain: transport or metabolism?
Zlokovic, B. V., Yamada, S., Holtzman, D., Ghiso, J., & Frangione, B. (2000) · Nature Medicine · doi:10.1038/77397 · Cited by 186
Tai, L. M., Bilousova, T., Jungbauer, L., Roeske, S. K., Youmans, K. L., Yu, C., Poon, W. W., Cornwell, L. B., Miller, C. A., Vinters, H. V., et al. (2013) · Journal of Biological Chemistry · doi:10.1074/jbc.m112.442103 · Cited by 165
Apolipoprotein E4 Alters Astrocyte Fatty Acid Metabolism and Lipid Droplet Formation
Farmer, B., Kluemper, J., & Johnson, L. (2019) · Cells · doi:10.3390/cells8020182 · Cited by 164
Smith, A. J., & Verkman, A. S. (2017) · The FASEB Journal · doi:10.1096/fj.201700999 · Cited by 162
Fryer, J. D., Taylor, J. W., DeMattos, R. B., Bales, K. R., Paul, S. M., Parsadanian, M., & Holtzman, D. M. (2003) · The Journal of Neuroscience · doi:10.1523/jneurosci.23-21-07889.2003 · Cited by 160
Anti-apoE immunotherapy inhibits amyloid accumulation in a transgenic mouse model of Aβ amyloidosis
Kim, J., Eltorai, A. E. M., Jiang, H., Liao, F., Verghese, P. B., Kim, J., Stewart, F. R., Basak, J. M., & Holtzman, D. M. (2012) · Journal of Experimental Medicine · doi:10.1084/jem.20121274 · Cited by 160
APOE4-mediated amyloid-β pathology depends on its neuronal receptor LRP1
Tachibana, M., Holm, M.-L., Liu, C.-C., Shinohara, M., Aikawa, T., Oue, H., Yamazaki, Y., Martens, Y. A., Murray, M. E., Sullivan, P. M., et al. (2019) · Journal of Clinical Investigation · doi:10.1172/jci124853 · Cited by 156
Tanaka, Y., CHAMBERS, J. K., Matsuwaki, T., Yamanouchi, K., & Nishihara, M. (2014) · Acta Neuropathologica Communications · doi:10.1186/s40478-014-0078-x · Cited by 155
Neuronal apolipoprotein E4 increases cell death and phosphorylated tau release in alzheimer disease
Wadhwani, A. R., Affaneh, A., Van Gulden, S., & Kessler, J. A. (2019) · Annals of Neurology · doi:10.1002/ana.25455 · Cited by 142
Astroglial Regulation of Apolipoprotein E Expression in Neuronal Cells
Harris, F. M., Tesseur, I., Brecht, W. J., Xu, Q., Mullendorff, K., Chang, S., Wyss-Coray, T., Mahley, R. W., & Huang, Y. (2004) · Journal of Biological Chemistry · doi:10.1074/jbc.m309475200 · Cited by 135
Fan, Y., Zhang, J., Sun, X., Gao, L., Zeng, X., Ding, J., Cao, C., Niu, L., & Hu, G. (2005) · Journal of Neuroscience Research · doi:10.1002/jnr.20664 · Cited by 110
Apolipoprotein E polymorphism and susceptibility to Alzheimer's disease.
Kamboh, M. I. (1995) · PubMed · Cited by 105
Impaired brain glymphatic flow in experimental hepatic encephalopathy
Hadjihambi, A., Harrison, I. F., Costas‐Rodríguez, M., Vanhaecke, F., Arias, N., Gallego‐Durán, R., Mastitskaya, S., Hosford, P. S., Damink, S. W. M. O., Davies, N. A., et al. (2018) · Journal of Hepatology · doi:10.1016/j.jhep.2018.08.021 · Cited by 105
Glial reaction in aging and Alzheimer's disease
Unger, J. W. (1998) · Microscopy Research and Technique · doi:10.1002/(sici)1097-0029(19981001)43:1 · Cited by 103
Deposition of mouse amyloid β in human APP/PS1 double and single AD model transgenic mice
van Groen, T., Kiliaan, A. J., & Kadish, I. (2006) · Neurobiology of Disease · doi:10.1016/j.nbd.2006.05.010 · Cited by 103
Smith, A. J., Duan, T., & Verkman, A. S. (2019) · Acta Neuropathologica Communications · doi:10.1186/s40478-019-0728-0 · Cited by 102
Han, X., Li, Q., Lan, X., El‐Mufti, L. H., Ren, H., & Wang, J. (2019) · Molecular Neurobiology · doi:10.1007/s12035-019-1502-9 · Cited by 92
Kuszczyk, M. A., Sanchez, S., Pankiewicz, J., Kim, J., Duszczyk, M., Guridi, M., Asuni, A. A., Sullivan, P. M., Holtzman, D. M., & Sadowski, M. J. (2013) · The American Journal of Pathology · doi:10.1016/j.ajpath.2013.01.034 · Cited by 89
Aquaporin-4 mediates astrocyte response to β-amyloid
Yang, W., Wu, Q., Chan, Y., Gao, J., Xiao, M., Gu, M., Ding, J., & Hu, G. (2012) · Molecular and Cellular Neuroscience · doi:10.1016/j.mcn.2012.02.002 · Cited by 84
Self-citationLiposomal clodronate selectively eliminates microglia from primary astrocyte cultures
Kumamaru, H., Saiwai, H., Kobayakawa, K., Kubota, K., van Rooijen, N., Inoue, K., Iwamoto, Y., & Okada, S. (2012) · Journal of Neuroinflammation · doi:10.1186/1742-2094-9-116 · Cited by 76
Aquaporin 4 deletion exacerbates brain impairments in a mouse model of chronic sleep disruption
Zhang, R., Liu, Y., Chen, Y., Li, Q., Marshall, C., Wu, T., Hu, G., & Xiao, M. (2019) · CNS Neuroscience & Therapeutics · doi:10.1111/cns.13194 · Cited by 76
Self-citationFu, Y., Zhao, J., Atagi, Y., Nielsen, H. M., Liu, C.-C., Zheng, H., Shinohara, M., Kanekiyo, T., & Bu, G. (2016) · Molecular Neurodegeneration · doi:10.1186/s13024-016-0099-y · Cited by 69
Kohl, A., Dehghani, F., Korf, H., & Hailer, N. P. (2003) · Experimental Neurology · doi:10.1016/s0014-4886(02)00049-3 · Cited by 59
Pankiewicz, J. E., Guridi, M., Kim, J., Asuni, A. A., Sanchez, S., Sullivan, P. M., Holtzman, D. M., & Sadowski, M. J. (2014) · Acta Neuropathologica Communications · doi:10.1186/s40478-014-0075-0 · Cited by 57
Cedazo-Mı́nguez, A., Wiehager, B., Winblad, B., Hüttinger, M., & Cowburn, R. F. (2001) · Neurochemistry International · doi:10.1016/s0197-0186(00)00128-5 · Cited by 50
The Roles of Apolipoprotein E, Lipids, and Glucose in the Pathogenesis of Alzheimer’s Disease
Shinohara, M., & Sato, N. (2019) · Advances in experimental medicine and biology · doi:10.1007/978-981-13-3540-2_5 · Cited by 28
Tolédano, A., Álvarez, M., Toledano‐Díaz, A., Merino, J. J., & Rodriguez, J. J. (2016) · Current Alzheimer Research · doi:10.2174/1567205013666151116141217 · Cited by 21
Cited by
Sorted by citations
Rasmussen, M. K., Mestre, H., & Nedergaard, M. (2021) · Physiological Reviews · doi:10.1152/physrev.00031.2020 · Cited by 642
Tau and neuroinflammation in Alzheimer’s disease: interplay mechanisms and clinical translation
Chen, Y., & Yu, Y. (2023) · Journal of Neuroinflammation · doi:10.1186/s12974-023-02853-3 · Cited by 516
Więckowska-Gacek, A., Mietelska-Porowska, A., Wydrych, M., & Wojda, U. (2021) · Ageing Research Reviews · doi:10.1016/j.arr.2021.101397 · Cited by 343
Microglia Phenotypes in Aging and Neurodegenerative Diseases
Wendimu, M. Y., & Hooks, S. B. (2022) · Cells · doi:10.3390/cells11132091 · Cited by 336
Microglia and Alzheimer’s Disease
Merighi, S., Nigro, M., Travagli, A., & Gessi, S. (2022) · International Journal of Molecular Sciences · doi:10.3390/ijms232112990 · Cited by 236
Metadata
- Authors
- Feng, W., Zhang, Y., Wang, Z., Xu, H., Wu, T., Marshall, C., Gao, J., & Xiao, M.
- Affiliations
- Nanjing Brain Hospital (CN)
- Jiangsu Province Hospital (CN)
- University of Kentucky (US)
- Corresponding author
- Gao, Junying
- Xiao, Ming
- Venue
- Alzheimer's Research & Therapy
- Published
- 2020-10-02
- Volume
- 12
- Issue
- 1
- Pages
- 125-125
- ISSN
- 1758-9193 (ISSN-L)
- PMC
- PMC7532614
- OpenAlex
- W3090445757
- Cited by
- 150
- References
- 65
- Citations by year
- 2026: 20 · 2025: 27 · 2024: 27 · 2023: 35 · 2022: 25 · 2021: 15 · 2020: 1
- FWCI
- 11.39
- Type
- journal article
- Language
- en
- Open access
- gold
- doi.org
- Locations
- Alzheimer s Research & Therapy (publishedVersion, cc-by)
- Research Square (acceptedVersion, cc-by)
- PubMed Central (publishedVersion, cc-by)
- PubMed (publishedVersion)
- UKnowledge (University of Kentucky) (submittedVersion, cc-by)
- DOAJ (DOAJ: Directory of Open Access Journals) (submittedVersion, cc-by-sa)
- Funders
- National Natural Science Foundation of China (81671070, 81772454)
- Topics
- Life Sciences › Neuroscience › Cellular and Molecular Neuroscience › Alzheimer's disease research and treatments
- Life Sciences › Neuroscience › Neurology › Neuroinflammation and Neurodegeneration Mechanisms
- Health Sciences › Medicine › Clinical Neurology › Cerebrospinal fluid and hydrocephalus
- Keywords
- Alzheimer's disease, amyloid-beta, glymphatic system, microglia, aquaporin-4, apolipoprotein E, amyloid plaque formation, APP/PS1 mice, clodronate liposomes, microglial phagocytosis, amyloid clearance, astrocytes
- MeSH terms
- Alzheimer Disease, Animals, Disease Models, Animal, Mice, Transgenic, Amyloid beta-Peptides, Amyloid beta-Protein Precursor, Microglia, Mice, Presenilin-1, Plaque, Amyloid
About these checks
Registry, retraction, Cites and statistics results are computed, not judged, with one exception: a printed reference that no index lists is read once by a model before it counts as a citation error. Claims are extracted by a model and kept only when their quote appears verbatim in the text; each cited source is then checked, with a model’s help, for whether it says what the claim relies on. Those verdicts can be wrong — read the claim’s quote and the cited source before relying on one.
Statistics and arithmetic are recomputed, not judged.
Confidence bands are shown only for fields calibrated on our annotated test set. None is calibrated yet, so no band is shown.
What counts as a claim ›How we measure confidence ›How we check this ›
Are you an author, or do you see a problem with this page? Request a review
